DIpil Das
What’s the Story?
In this new monthly series, Leading Indicators of US Retail Sales, we examine several key macroeconomic indicators of US retail sales and analyze how they may impact the industry in the months to come. We analyze the latest available data, as of the end of January 2021.Why It Matters
Macroeconomic indicators have a significant impact on overall retail sales growth. Looking at 10 indicators (unemployment rate, labor force participation rate, disposable income per capita, average hourly raises, consumer sentiment, savings rate, gas price, interest rate, housing starts and housing prices), we can historically account for a majority of the variation in retail sales growth and create a strong basis for predicting sales moving forward. The close correlation between retail sales growth predictions based on economic indicators and actual retail sales growth is shown in Figure 1.Figure 1. US Actual Retail Sales ex. Auto and Gas Sales vs. Model Predicted Sales, January 2000–February 2020 (YoY % Change) [caption id="attachment_122854" align="aligncenter" width="725"]
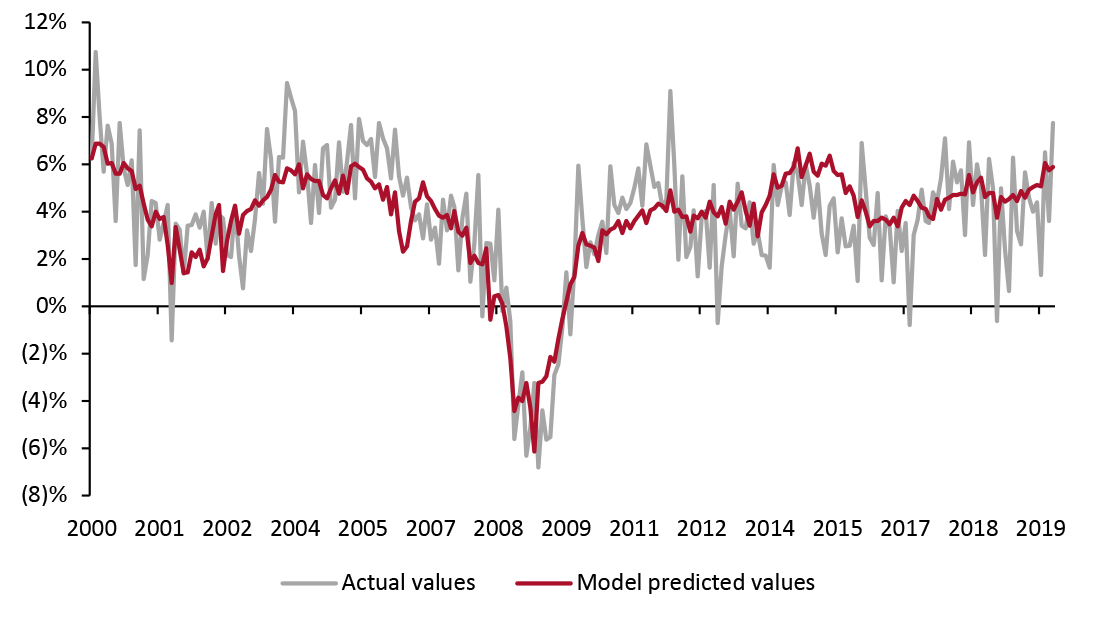 Source: BEA/BLS/Federal Reserve Board of Governors /S&P/Coresight Research[/caption]
Over the past 10 months, virus concerns have caused consumers to drastically reduce their spending on experiences and services, helping to keep retail sales growth strong despite lagging economic indicators. However, as vaccination efforts step up and consumers slowly begin to revert to some pre-pandemic behaviors, we expect economic indicators to supersede health concerns to again become the most valuable predictors of retail sales.
Source: BEA/BLS/Federal Reserve Board of Governors /S&P/Coresight Research[/caption]
Over the past 10 months, virus concerns have caused consumers to drastically reduce their spending on experiences and services, helping to keep retail sales growth strong despite lagging economic indicators. However, as vaccination efforts step up and consumers slowly begin to revert to some pre-pandemic behaviors, we expect economic indicators to supersede health concerns to again become the most valuable predictors of retail sales.
Leading Indicators of US Retail Sales: In Detail
Indicators Overview Of the 10 indicators we examined, four are likely to have a negative impact on retail sales in the immediate future, while six will likely have a positive effect. However, this simple comparison shrouds the fact that three of the negative indicators also tend to have the largest effect on sales. Relatively high unemployment, low labor force participation, poor consumer sentiment, and a very high savings rate will all significantly reduce retail spending. Of the positive indicators, an increase in disposable income will likely be the driving force keeping sales growth afloat.Figure 2. US: Leading Indicators of Retail Sales, as of the End of January 2021 [caption id="attachment_122866" align="aligncenter" width="725"]
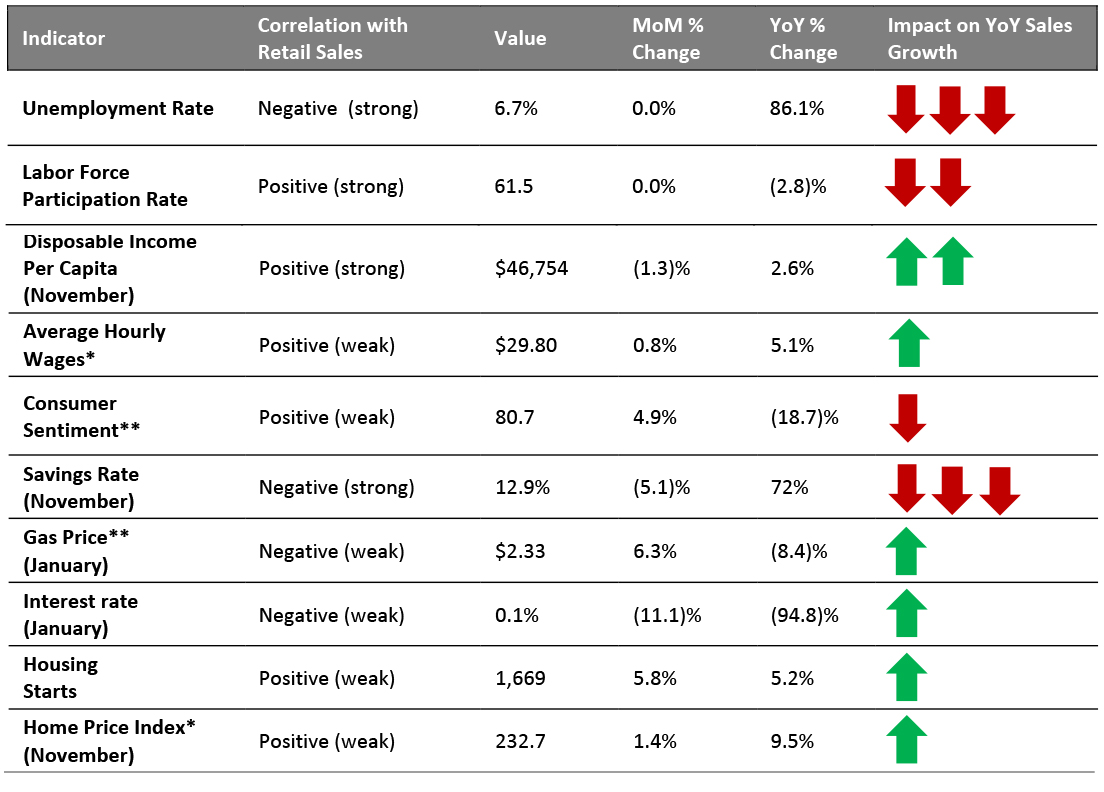 Latest available data from December unless otherwise indicated
 *Results may not be statistically significant
**Not included in predictive model
Source: BEA/BLS/Federal Reserve Board of Governors /S&P/University of Michigan/US Energy Information Administration/Coresight Research [/caption] Looking ahead to yet-to-be-reported January sales and projected sales in February, we predict that retail sales will increase by about 7% overall, year over year, as illustrated in Figure 3. On the lower bound of this forecast, we could see retail sales growth as low as 5.6% if consumers demonstrate heightened concern about the virus and the state of the economy. On the upper bound, we could also see sales as high as 9.2% if consumers are especially emboldened by stimulus checks to spend more. These projections include an adjustment of the model used in Figure 1 to account for the unprecedented impact of Covid-19 on spending habits.
Figure 3. US Retail Sales ex. Auto and Gas (YoY % Change) [caption id="attachment_122867" align="aligncenter" width="725"]
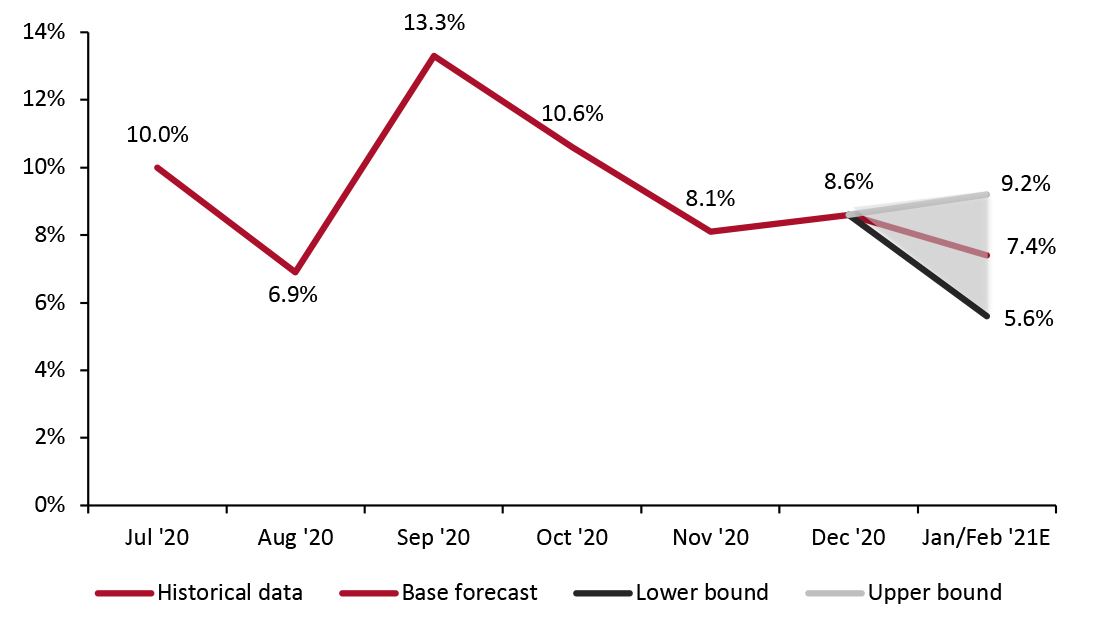 Note: BEA/BLS/Federal Reserve Board of Governors /S&P/Coresight Research[/caption]
The Job Market
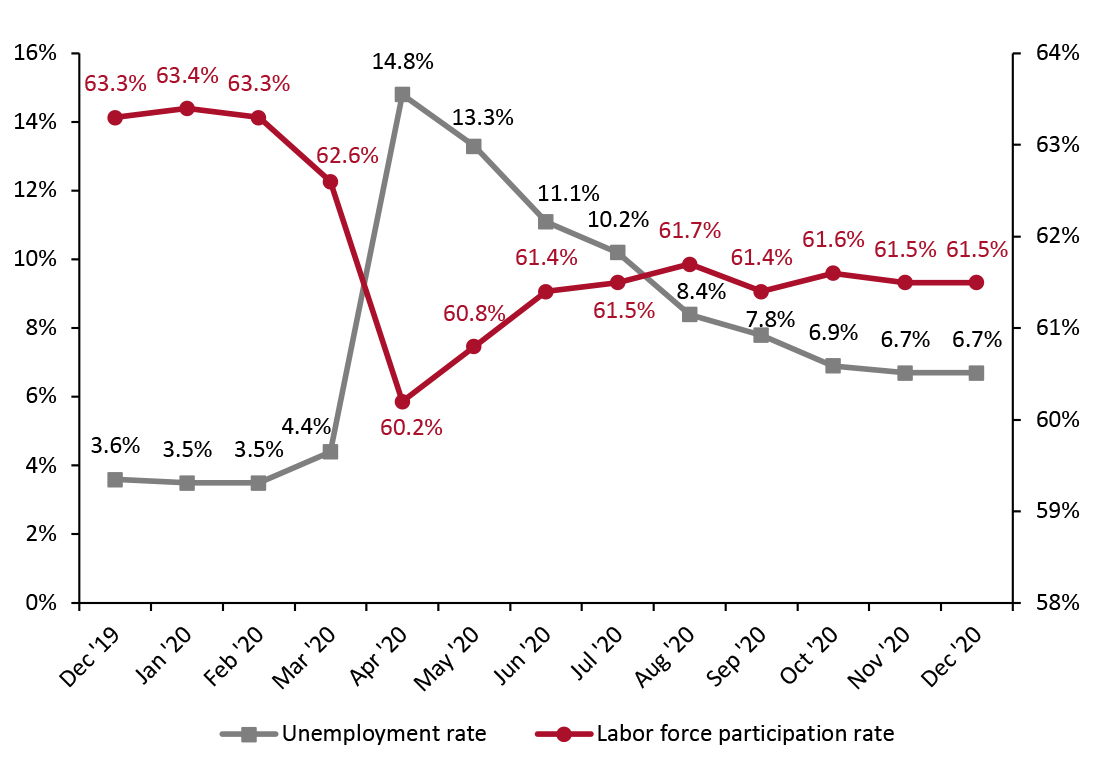
The job market has recovered substantially from the beginning of the pandemic, with unemployment having dropped considerably since the April 2020 spike. However, the bounceback has stalled in recent months: The unemployment rate stayed constant at 6.7% between November and December 2020 and remains up 86.1% year over year, according to data from the US Bureau of Labor Statistics (BLS).
Furthermore, long-term unemployment (27 weeks and over) has been on the rise. In December 2020, the number of long-term unemployed Americans rose by 27,000 to 3.96 million—representing 37.1% of all unemployed people, according to BLS data.
Alongside high unemployment during Covid-19 lockdowns in April 2020, the labor force participation rate dropped significantly, following a dip in March. Although it bounced back between May and July, data from the BLS shows that the labor force participation rate has remained largely steady since then, at a level lower than pre-pandemic normality: December’s 61.5% participation rate is exactly the same as the rate in July.
This dip in participation has not been uniform across the gender gap: The National Women’s Law Center estimates that 12.1 million women lost their jobs between February and April last year, and that more than 44% of those jobs were yet to return as of December. Furthermore, in December, women lost 156,000 jobs while men gained 16,000. Similarly, the drop in employment has hit minorities the hardest: For example, the BLS reported that the unemployment rate was 9.9% for African Americans in December (compared to the 6.7% total), although this is higher than the record-low rates in 2019.
Note: BEA/BLS/Federal Reserve Board of Governors /S&P/Coresight Research[/caption]
The Job Market
The job market has recovered substantially from the beginning of the pandemic, with unemployment having dropped considerably since the April 2020 spike. However, the bounceback has stalled in recent months: The unemployment rate stayed constant at 6.7% between November and December 2020 and remains up 86.1% year over year, according to data from the US Bureau of Labor Statistics (BLS).
Furthermore, long-term unemployment (27 weeks and over) has been on the rise. In December 2020, the number of long-term unemployed Americans rose by 27,000 to 3.96 million—representing 37.1% of all unemployed people, according to BLS data.
Alongside high unemployment during Covid-19 lockdowns in April 2020, the labor force participation rate dropped significantly, following a dip in March. Although it bounced back between May and July, data from the BLS shows that the labor force participation rate has remained largely steady since then, at a level lower than pre-pandemic normality: December’s 61.5% participation rate is exactly the same as the rate in July.
This dip in participation has not been uniform across the gender gap: The National Women’s Law Center estimates that 12.1 million women lost their jobs between February and April last year, and that more than 44% of those jobs were yet to return as of December. Furthermore, in December, women lost 156,000 jobs while men gained 16,000. Similarly, the drop in employment has hit minorities the hardest: For example, the BLS reported that the unemployment rate was 9.9% for African Americans in December (compared to the 6.7% total), although this is higher than the record-low rates in 2019.
Figure 4. US Unemployment Rate (Left Axis, %) and Labor Force Participation Rate (Right Axis, %) [caption id="attachment_122868" align="aligncenter" width="725"]
 Source: BLS[/caption]
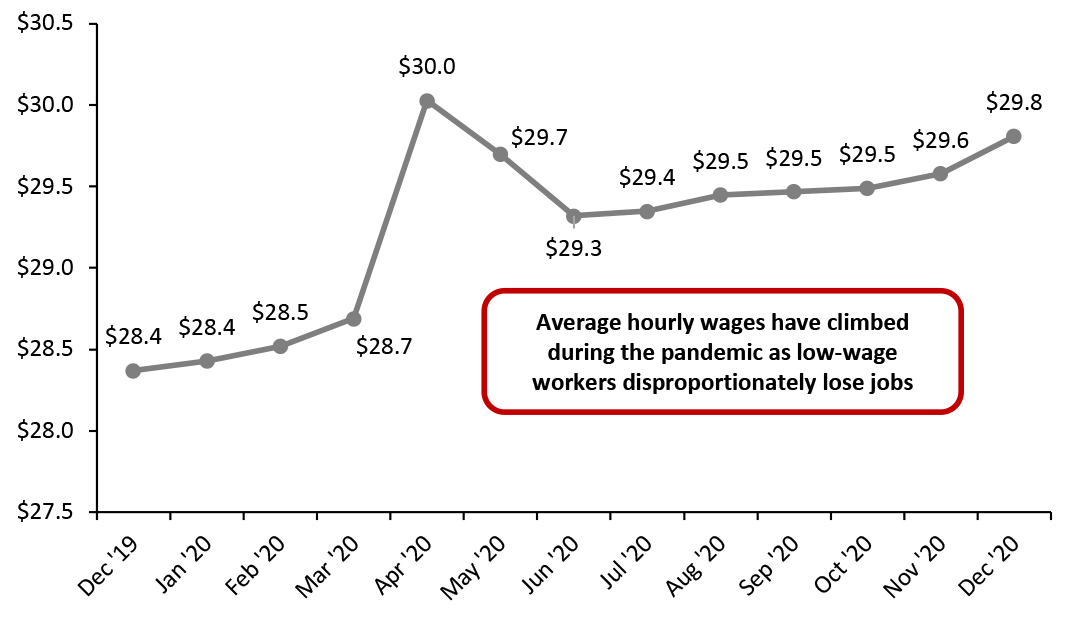
Average hourly wages across all private-sector employees stood at $29.81 as of December 2020, up 5.1% year over year and 0.8% month over month, according to data from the BLS. Every month since April, year-over-year growth of average wages has exceeded pre-pandemic growth rates dating back to 2008, when the BLS began reporting the monthly data.
Source: BLS[/caption]
Average hourly wages across all private-sector employees stood at $29.81 as of December 2020, up 5.1% year over year and 0.8% month over month, according to data from the BLS. Every month since April, year-over-year growth of average wages has exceeded pre-pandemic growth rates dating back to 2008, when the BLS began reporting the monthly data.
Figure 5. US Average Hourly Wages, All Private-Sector Employees (USD) [caption id="attachment_122874" align="aligncenter" width="725"]
 Source: BLS[/caption]
While a sustained rise in average hourly wages is typically a positive indicator for consumer spending, 2020’s rise in wages has been driven largely by a reduction in the number of low-wage workers employed. In January 2021, Federal Reserve Board Governor Lael Brainard said that the unemployment rate for the lowest quartile of earners is likely above 20%, far higher than the overall 6.7% rate in December 2020. Earlier in the pandemic, the Federal Reserve also indicated that nearly 40% of workers living in households earning less than $40,000 lost their jobs or were furloughed in early April, explaining the spike in wages that month.
Implications
The labor force participation and unemployment rates are two of the strongest predictors of retail sales, so their stalled recovery is worrisome for a sustained retail recovery. Although consumers have been able to maintain strong spending on retail goods, much of that spending has been fueled by pent-up demand, stimulus checks and an inability to spend on services and experiences. Retailers should be aware of appealing to a large portion of consumers who remain out of work and are increasingly cost conscious.
Income, Savings and Sentiment
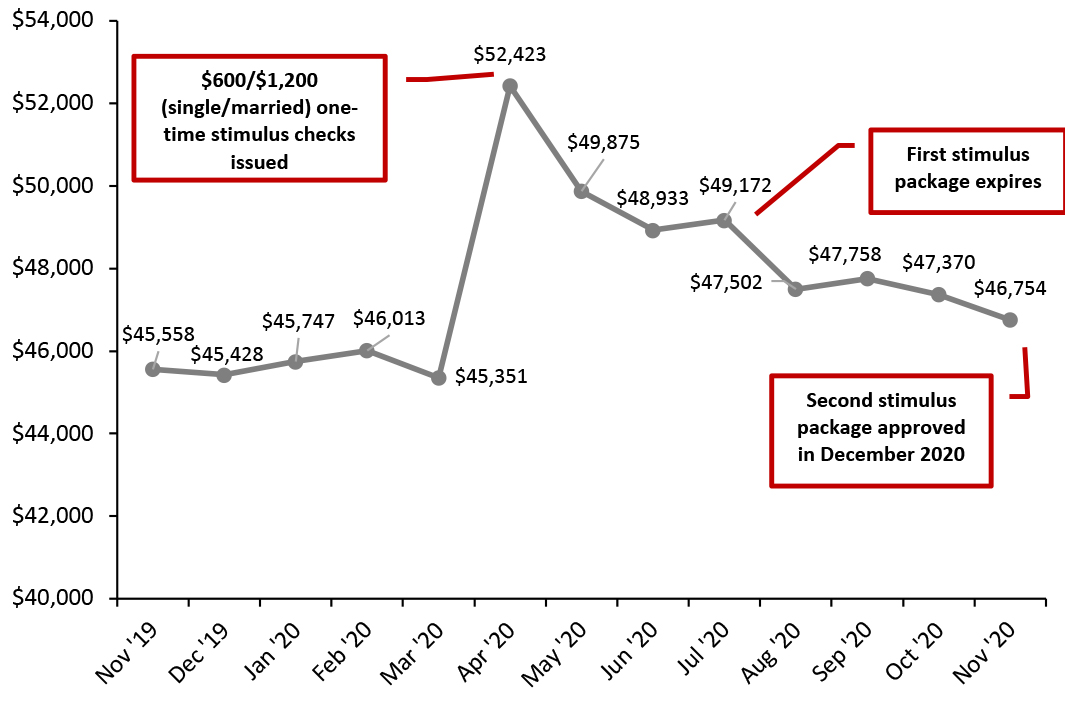
Disposable income has risen during the pandemic: Sitting at $46,754 per capita annualized in November 2020 (the latest month from which data were available), real disposable income remains up 2.6% year over year despite dropping 1.3% between October and November, according to data from the US Bureau of Economic Analysis (BEA).
Source: BLS[/caption]
While a sustained rise in average hourly wages is typically a positive indicator for consumer spending, 2020’s rise in wages has been driven largely by a reduction in the number of low-wage workers employed. In January 2021, Federal Reserve Board Governor Lael Brainard said that the unemployment rate for the lowest quartile of earners is likely above 20%, far higher than the overall 6.7% rate in December 2020. Earlier in the pandemic, the Federal Reserve also indicated that nearly 40% of workers living in households earning less than $40,000 lost their jobs or were furloughed in early April, explaining the spike in wages that month.
Implications
The labor force participation and unemployment rates are two of the strongest predictors of retail sales, so their stalled recovery is worrisome for a sustained retail recovery. Although consumers have been able to maintain strong spending on retail goods, much of that spending has been fueled by pent-up demand, stimulus checks and an inability to spend on services and experiences. Retailers should be aware of appealing to a large portion of consumers who remain out of work and are increasingly cost conscious.
Income, Savings and Sentiment
Disposable income has risen during the pandemic: Sitting at $46,754 per capita annualized in November 2020 (the latest month from which data were available), real disposable income remains up 2.6% year over year despite dropping 1.3% between October and November, according to data from the US Bureau of Economic Analysis (BEA).
Figure 6. US Annualized Real Disposable Income Per Capita (USD) [caption id="attachment_122870" align="aligncenter" width="725"]
 Source: BEA[/caption]
However, like the rise in wages, this increase in disposable income has been largely artificially generated. Stimulus checks and extended unemployment benefits have played a key role in keeping disposable income afloat through the crisis.
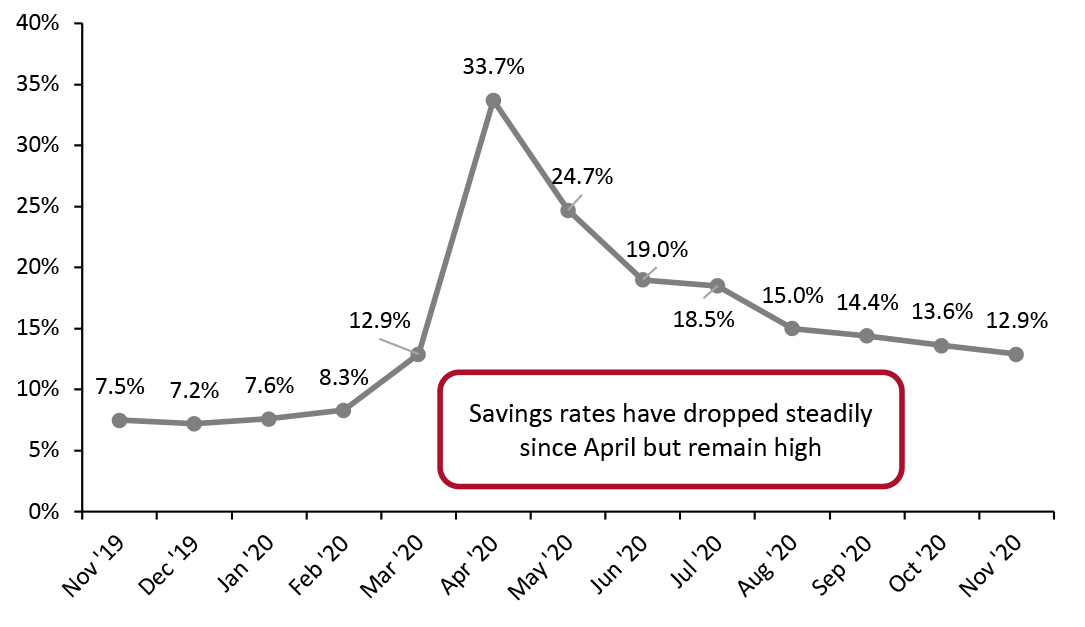
Personal savings rates, after skyrocketing to more than 30% at the beginning of the pandemic, remain unprecedentedly high. The November 2020 savings rate stood at 12.9%, up 72% year over year but down 5.1% month over month as the savings rate continues to inch back down toward pre-crisis levels, according to BEA data.
Source: BEA[/caption]
However, like the rise in wages, this increase in disposable income has been largely artificially generated. Stimulus checks and extended unemployment benefits have played a key role in keeping disposable income afloat through the crisis.
Personal savings rates, after skyrocketing to more than 30% at the beginning of the pandemic, remain unprecedentedly high. The November 2020 savings rate stood at 12.9%, up 72% year over year but down 5.1% month over month as the savings rate continues to inch back down toward pre-crisis levels, according to BEA data.
Figure 7. Personal Savings Rate (%) [caption id="attachment_122871" align="aligncenter" width="725"]
 Source: BEA[/caption]
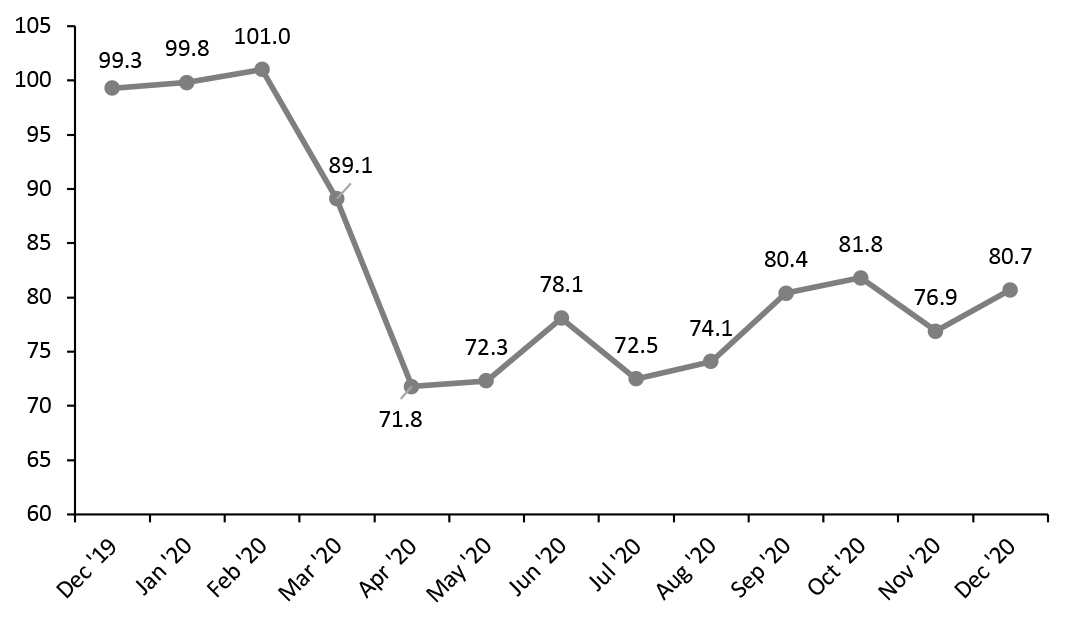
Consumer sentiment has also been recovering from its steep drop at the outset of the pandemic, although its resurgence has stalled in recent months. After rebounding from 71.8 in April to 81.8 in October, consumer sentiment fell by 1.1% overall between October and December (see Figure 8).
Source: BEA[/caption]
Consumer sentiment has also been recovering from its steep drop at the outset of the pandemic, although its resurgence has stalled in recent months. After rebounding from 71.8 in April to 81.8 in October, consumer sentiment fell by 1.1% overall between October and December (see Figure 8).
Figure 8. University of Michigan Consumer Sentiment Index [caption id="attachment_122872" align="aligncenter" width="725"]
 Source: University of Michigan[/caption]
Consumer sentiment is likely to improve as coronavirus cases decrease amid continued vaccination efforts, but, for now, consumers remain wary of spending in uncertain times, causing a drag on retail sales.
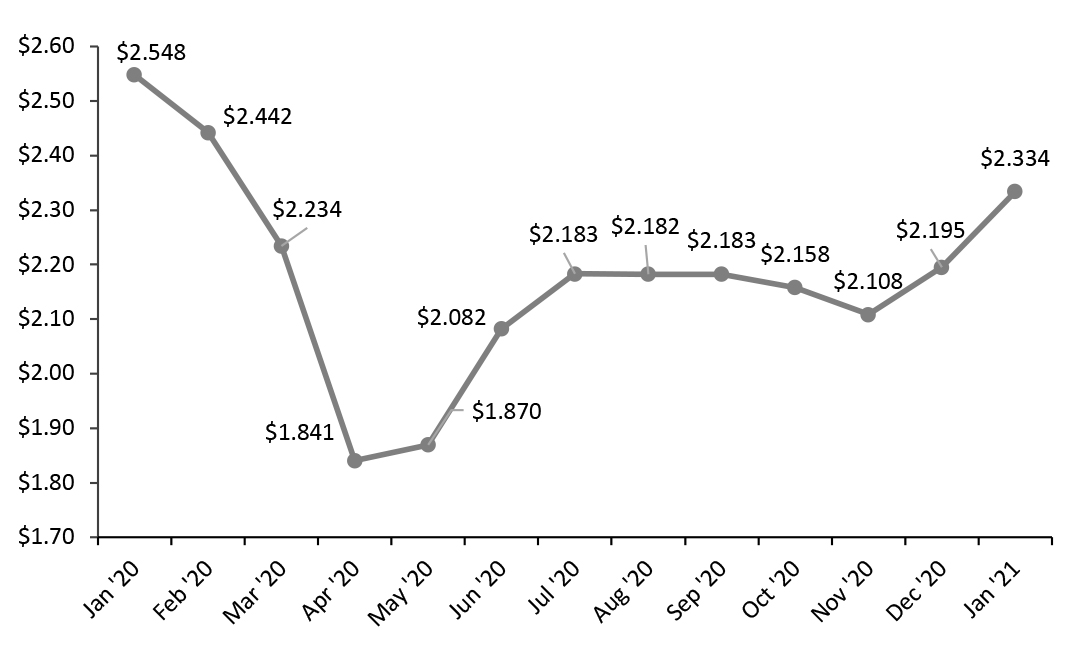
Like consumer sentiment, gas prices remain substantially lower than pre-pandemic values, as shown in Figure 9.
Source: University of Michigan[/caption]
Consumer sentiment is likely to improve as coronavirus cases decrease amid continued vaccination efforts, but, for now, consumers remain wary of spending in uncertain times, causing a drag on retail sales.
Like consumer sentiment, gas prices remain substantially lower than pre-pandemic values, as shown in Figure 9.
Figure 9. US Regular All Formulations Gas Price (Dollars per Gallon) [caption id="attachment_122873" align="aligncenter" width="725"]
 Source: US Energy Information Administration[/caption]
Low gas prices have helped consumers afford to spend more on alternative products. In addition, consumers have been driving less due to Covid-19 restrictions. December gasoline sales were down 12.1% year over year, freeing up money to be spent on retail goods.
Implications
A high savings rate is always a worrisome sign for retail sales, but increases in savings during the pandemic thus far have largely been the result of consumers saving money they would otherwise have spent on services and experiences, not retail. While a rise in hourly wages belies the true status of the economic landscape, a rise in disposable income driven by stimulus checks has helped to steady retail sales in the midst of uncertainty, even as consumer sentiment remains far below pre-crisis levels. Moving forward, retailers can expect a rebound in income following the receipt of a second round of stimulus checks and supported by low gasoline prices and consumers driving less.
Housing
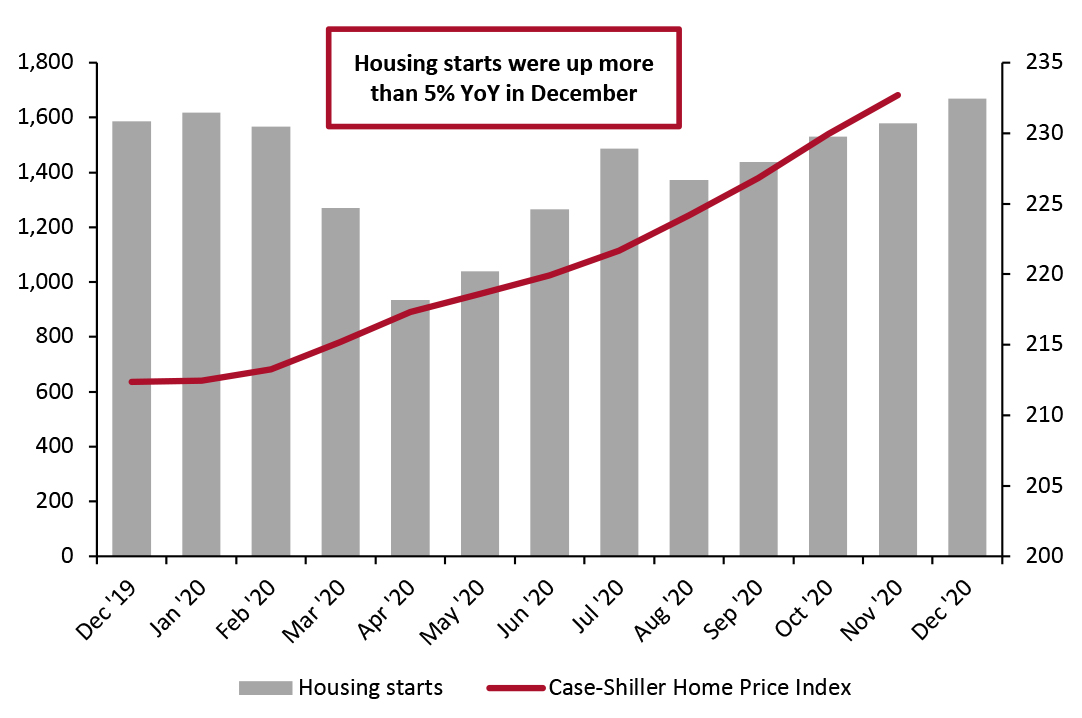
Despite the economic uncertainty of the pandemic, consumers are buying houses at record rates. The number of housing starts steadily increased every month from September to December 2020. By December, housing starts were up 5.2% on a year-over-year basis, according to data from the US Department of Housing and Urban Development (HUD).
Consumers are likely taking advantage of record-low interest rates to secure borrower-friendly mortgages. The current interest rate (as of January 2021) is near zero, at just 0.08% (rounded to 0.1% in Figure 2)—more than a 94% decrease from January 2020 and largely unchanged from the Federal Reserve System’s initial slashing of rates in March.
As indicated by Figure 10, this fast-moving housing market driven by low interest rates has unsurprisingly boosted housing prices: In November 2020, the latest month for which Case-Shiller Home Price Index data were available, housing prices were up 9.5% year over year, according to data from S&P. Unlike housing starts, which tend to be more variable and dipped at the beginning of the pandemic, the home price index has grown in every month reported so far during the pandemic.
Source: US Energy Information Administration[/caption]
Low gas prices have helped consumers afford to spend more on alternative products. In addition, consumers have been driving less due to Covid-19 restrictions. December gasoline sales were down 12.1% year over year, freeing up money to be spent on retail goods.
Implications
A high savings rate is always a worrisome sign for retail sales, but increases in savings during the pandemic thus far have largely been the result of consumers saving money they would otherwise have spent on services and experiences, not retail. While a rise in hourly wages belies the true status of the economic landscape, a rise in disposable income driven by stimulus checks has helped to steady retail sales in the midst of uncertainty, even as consumer sentiment remains far below pre-crisis levels. Moving forward, retailers can expect a rebound in income following the receipt of a second round of stimulus checks and supported by low gasoline prices and consumers driving less.
Housing
Despite the economic uncertainty of the pandemic, consumers are buying houses at record rates. The number of housing starts steadily increased every month from September to December 2020. By December, housing starts were up 5.2% on a year-over-year basis, according to data from the US Department of Housing and Urban Development (HUD).
Consumers are likely taking advantage of record-low interest rates to secure borrower-friendly mortgages. The current interest rate (as of January 2021) is near zero, at just 0.08% (rounded to 0.1% in Figure 2)—more than a 94% decrease from January 2020 and largely unchanged from the Federal Reserve System’s initial slashing of rates in March.
As indicated by Figure 10, this fast-moving housing market driven by low interest rates has unsurprisingly boosted housing prices: In November 2020, the latest month for which Case-Shiller Home Price Index data were available, housing prices were up 9.5% year over year, according to data from S&P. Unlike housing starts, which tend to be more variable and dipped at the beginning of the pandemic, the home price index has grown in every month reported so far during the pandemic.
Figure 10. Housing Starts (Left Axis) and Case-Shiller US Home Price Index (Right Axis) [caption id="attachment_122863" align="aligncenter" width="725"]
 Source: HUD/US Census Bureau[/caption]
Home prices tend to reflect the long-term economic outlook more than several other indicators mentioned, likely explaining why they have remained strong throughout the pandemic. Furthermore, a migration from cities to the suburbs during the crisis likely buoyed demand and helped keep prices strong.
Implications
Strong housing prices generally help consumers feel more wealthy and, as a result, lead them to spend more. Combined with strong growth in the stock market, the growth in home value during the crisis has likely helped consumers feel more confident spending on retail goods in an otherwise uncertain time—and should continue to do so over the first half of 2021. Sales in the home-improvement retail category have also been strong during the pandemic, partly because consumers have been spending more time at home but also due to the increase in housing starts—specifically, single-unit homes that require more maintenance. Retailers can expect home-owning consumers to continue spending more in general due to the wealth effect, and home products look poised to continue to do well in a fast-paced housing market. However, household debt was up 3.4% year over year in the third quarter of 2020, according to the Federal Reserve, and bears keeping an eye on as consumers spend more on houses.
Source: HUD/US Census Bureau[/caption]
Home prices tend to reflect the long-term economic outlook more than several other indicators mentioned, likely explaining why they have remained strong throughout the pandemic. Furthermore, a migration from cities to the suburbs during the crisis likely buoyed demand and helped keep prices strong.
Implications
Strong housing prices generally help consumers feel more wealthy and, as a result, lead them to spend more. Combined with strong growth in the stock market, the growth in home value during the crisis has likely helped consumers feel more confident spending on retail goods in an otherwise uncertain time—and should continue to do so over the first half of 2021. Sales in the home-improvement retail category have also been strong during the pandemic, partly because consumers have been spending more time at home but also due to the increase in housing starts—specifically, single-unit homes that require more maintenance. Retailers can expect home-owning consumers to continue spending more in general due to the wealth effect, and home products look poised to continue to do well in a fast-paced housing market. However, household debt was up 3.4% year over year in the third quarter of 2020, according to the Federal Reserve, and bears keeping an eye on as consumers spend more on houses.
What We Think
While the issuance of new stimulus checks will boost disposable income and subsequently retail sales, the stall in the recovery of the labor market is a concerning sign for spending among low-income consumers. Implications for Brands/Retailers- The continued struggles of the labor market remain a hindrance for retail sales and look unlikely to let up within the next two to three months.
- High disposable income bolstered by stimulus checks will help keep sales growth stronger than it would otherwise be, likely keeping winter sales growth in the high single digits.
- A strong housing market will boost feelings of wealth among the roughly two-thirds of the US population that own their own home, thus bolstering spending, especially among home-related goods.