Nitheesh NH
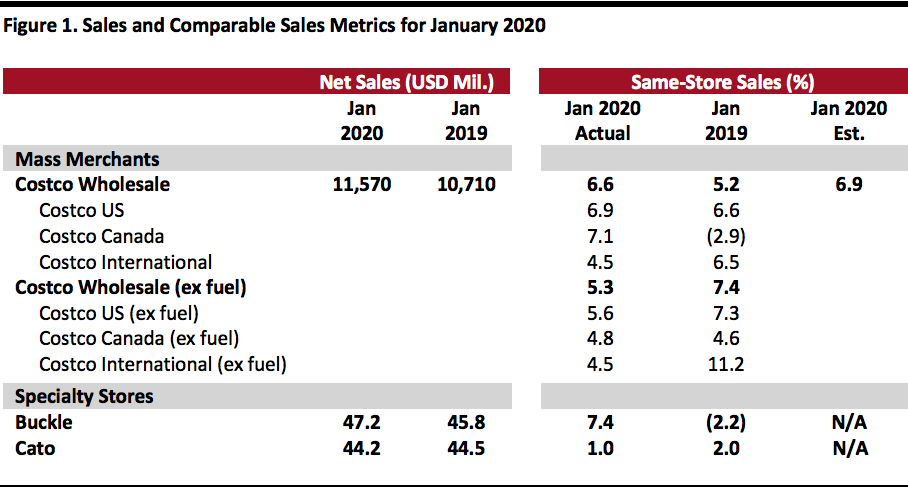
[caption id="attachment_103535" align="aligncenter" width="700"] Source: Company reports/StreetAccount[/caption]
 Source: Company reports/StreetAccount[/caption]
Costco January Comps Fall Short of Expectations, Online Comp Growth Slows
- In January (formally, the four weeks ended February 2), Costco’s global same-store sales increased 6.6%, slowing from December’s 9.0% growth and 300 basis points (bps) below the consensus estimate recorded by StreetAccount. Ex fuel, global comps were up 5.3% in January.
- Costco’s online comparable sales climbed 17.6% in January, a steep slowdown from December’s exceptional 42.6% growth, although December growth was driven primarily by Thanksgiving, Black Friday and Cyber Monday, all of which fell a week later in 2019 than in 2018 and pushed Cyber Monday and its revenues into December.
- Ex fuel and forex, Costco US comps were up 5.3% in January, versus 8.4% in December. In the US, the regions with the strongest results were the Midwest, Texas and San Diego. Internationally, Costco saw strongest results in Japan, Mexico and Australia.
- Currency fluctuations positively impacted overall comps by about 10 bps. Canada same-store sales benefited positively by around 130 bps from foreign exchange rates while Costco’s “other international” segment was hurt 30 bps.
- Cannibalization from newly opened locations negatively impacted US comps by approximately 20 bps and other intern ational segment by 150 bps. Overall, cannibalization negatively impacted comparable sales by 30 bps.
- In the merchandise segment, excluding currency effects, comps for food and sundries were positive mid-single digits: sundries, deli and candy departments showed the strongest results. Hardlines posted positive low- to mid-single digit comps: automotive, health and beauty aids, and garden were better-performing departments. Softlines grew low to mid-single digits: jewelry, special order kiosks and housewares performed better than other departments.
- Fresh-food comparable sales were up mid-single digits, with service deli and produce performing better than other departments.
- In the ancillary businesses, gas, hearing aids and pharmacy saw the strongest comp sales increases.
- Gasoline price inflation positively impacted total comps by about 120 bps, with the overall average selling price increasing to $2.74 per gallon this year from $2.47 last year.
- As of February 2, 2020, the company operated 785 warehouses (546 in the US), versus 768 warehouses (533 in the US) as of February 3, 2019.
Buckle Comps Increase, Women’s Segment Grows Twice As Fast As Men’s
- Buckle’s comparable sales increased 7.4% in January (the four weeks ended February 1), following 5.0% growth in December. January net sales increased 3.2% year over year after December’s 4.8% increase.
- By business segment, total sales in the men’s segment were up about 4.0% year over year. The men’s business accounted for approximately 49% of total sales in January versus 50% during the same period last year.
- Total sales in the women’s segment were up 8.0% year over year, while price points were down slightly. The women’s segment accounted for around 51% of total monthly sales in January 2019 versus 50% in January 2018.
- By product type, accessory sales were up 10.5% year over year in January and footwear sales were up 36.5% year over year. Accessories and footwear each accouted for 8% of total sales in January. Average accessory price points slipped about 4.5% while average footwear price points were down some 7.0%.
- December units per transaction remained flat and average transaction value was down 0.5% year over year in January.
- As of February 6, 2020, the company operated 448 stores across 42 states, down from 450 stores as of February 6, 2019.
Cato Same-Store Sales Increase Slightly
- Cato’s comparable sales were up 1% in January (the four weeks ended February 1), after coming in flat in December. Cato’s total sales slipped 1.0% year over year to $44.2 million in January following December’s 2.0% fall.
- As of February 1, 2020, the company operated 1,281 stores in 31 states, down from 1,311 stores in 33 states as of February 2, 2019.