Nitheesh NH
The Coresight Research US Retail Traffic and In-Store Metrics report reviews year-over-year changes in selected store-based metrics, including sales, traffic and conversion rates.
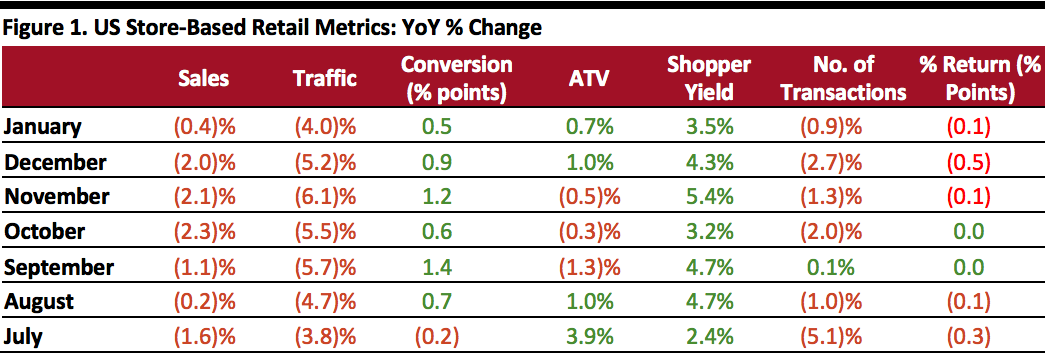 ATV = average transaction value; % return = percentage of goods returned to stores
Source: RetailNext[/caption] Data for January shows performance remained relatively stable over the four weeks:
- US store-based traffic continued to fall in January, according to RetailNext, declining 4% year over year versus December’s 5.2% fall and November’s 6.1% decline.
- The conversion rate (sales transactions as a percentage of traffic) advanced 0.5 percentage points in January, slightly slower than the 0.9-percentage-point increase in December.
- Transaction volume slid 0.9% in January following a 2.7% decline in December.
- The product return rate declined 0.1 percentage points in January after a 0.5-percentage-point decrease in December.
- Shopper yield (sales divided by traffic) continued a 12-month growth streak, increasing 3.5% year over year in January, compared to 4.3% growth in December.
- Average transaction volume (ATV, sales divided by transactions) grew 0.7% in January following 1% growth in December.
ATV = average transaction value; % return = percentage of goods returned to storesSource: RetailNext[/caption] Data for January shows performance remained relatively stable over the four weeks:
- The second week performed slightly better, registering the only positive sales increase in the month in any week as well as the largest increase in ATV and shopper yield.
- January traffic remained relatively stable across the month, declining 3.6%–4.3% each week.
- January 1 performed the best for sales, traffic and ATV, while January 16 and January 29 performed best for conversion rate and shopper yield, respectively.
- Traffic was slowest on January 29, while sales were lowest on January 21. January 5 performed the worst in terms of conversion rate and shopper yield.