
DIpil Das
Coresight Research’s measure of core retail sales is the unadjusted year-over-year change, excluding gasoline and automobiles. This metric stood at 2.6% in January, lower than the 6.3% in December. Calendar shifts, which pushed Black Friday and Cyber Monday six days later than in 2018, contributed to strong growth in December.
[caption id="attachment_103765" align="aligncenter" width="700"]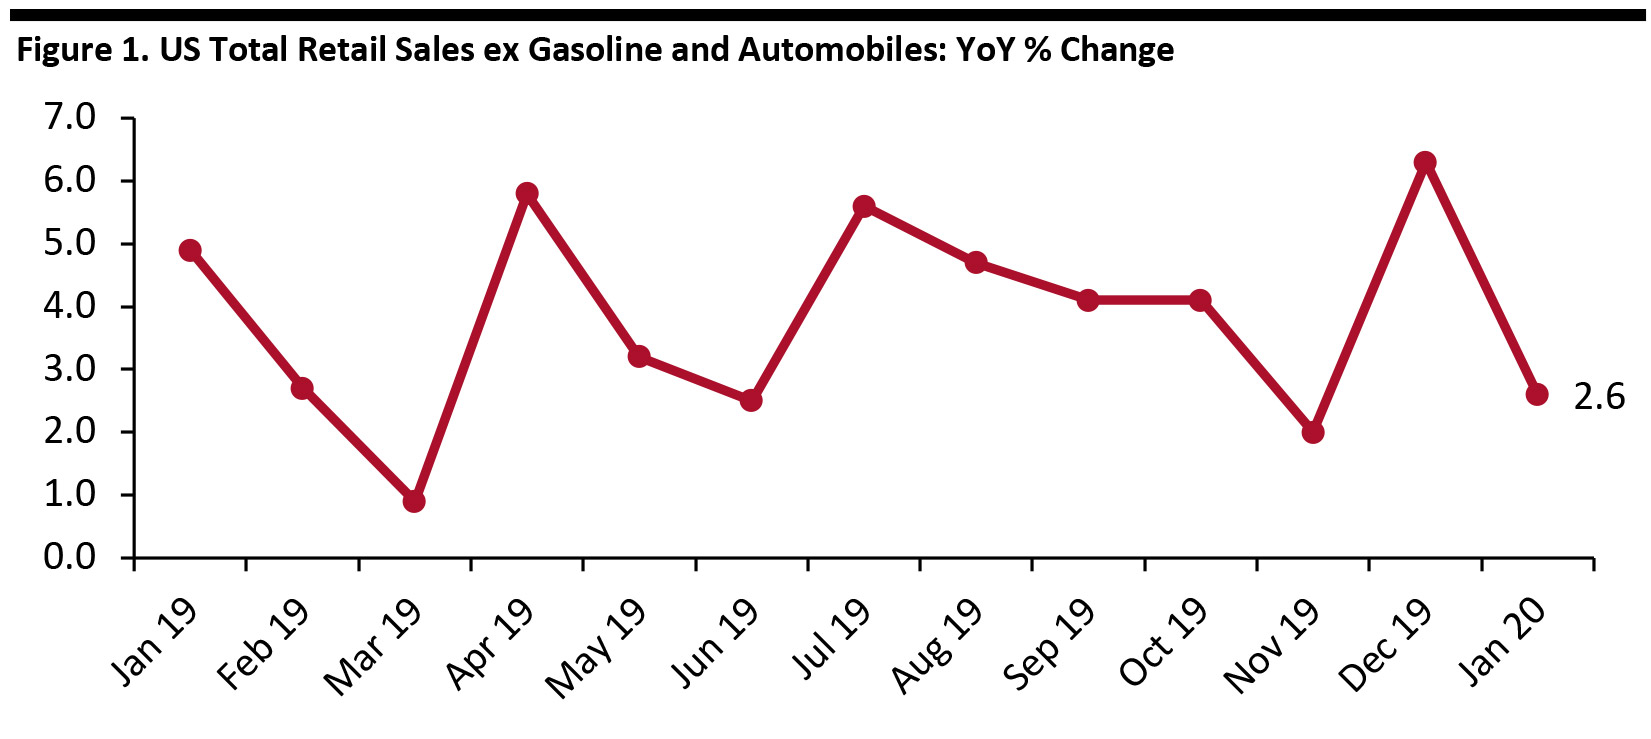 Data is not seasonally adjusted
Source: US Census Bureau/Coresight Research [/caption] Retail Sales Increase Month Over Month The Census Bureau’s core metric is seasonally adjusted retail sales including automobiles and gasoline. Sales by this measure grew 4.0% year over year in January, slower than the 5.6% growth seen in December. On a month-over-month basis and seasonally adjusted, retail sales increased 0.1% in January. [caption id="attachment_103766" align="aligncenter" width="700"]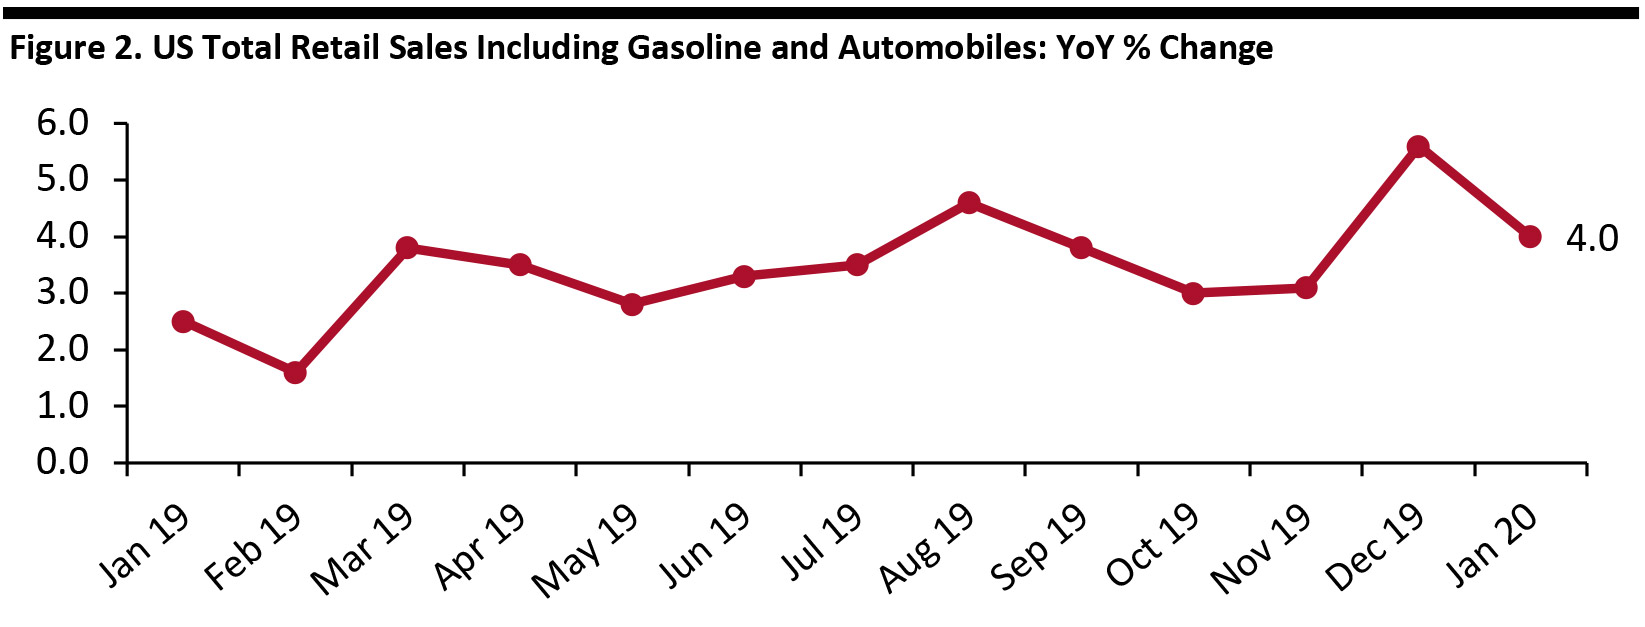 Data is seasonally adjusted
Source: US Census Bureau [/caption] Retail Sales Growth by Sector Sales growth turned negative for several sectors in January, including building material and garden supply retailers; health and personal care stores; and, sporting goods, hobby, musical instrument and book stores. Electronics and appliance stores continued to see sales decline, down 2.9% year over year in January, deteriorating further from December’s 1.1% slide. Sales growth accelerated in food and beverage stores with sales at grocery stores up 3.0%, slightly above the overall food sector’s 2.9% growth. Sales at department stores (a sub-set of general-merchandise stores) remained negative in January, posting a 3.9% decline following a 5.6% decline in December. Clothing-store sales declined 0.7% in January, from December’s 1.4% increase. Nonstore retailer sales growth slowed to 7.0% in January, from 22.9% in December. Gasoline station sales continued to grow in January, up 10.6% year over year. [caption id="attachment_103767" align="aligncenter" width="700"]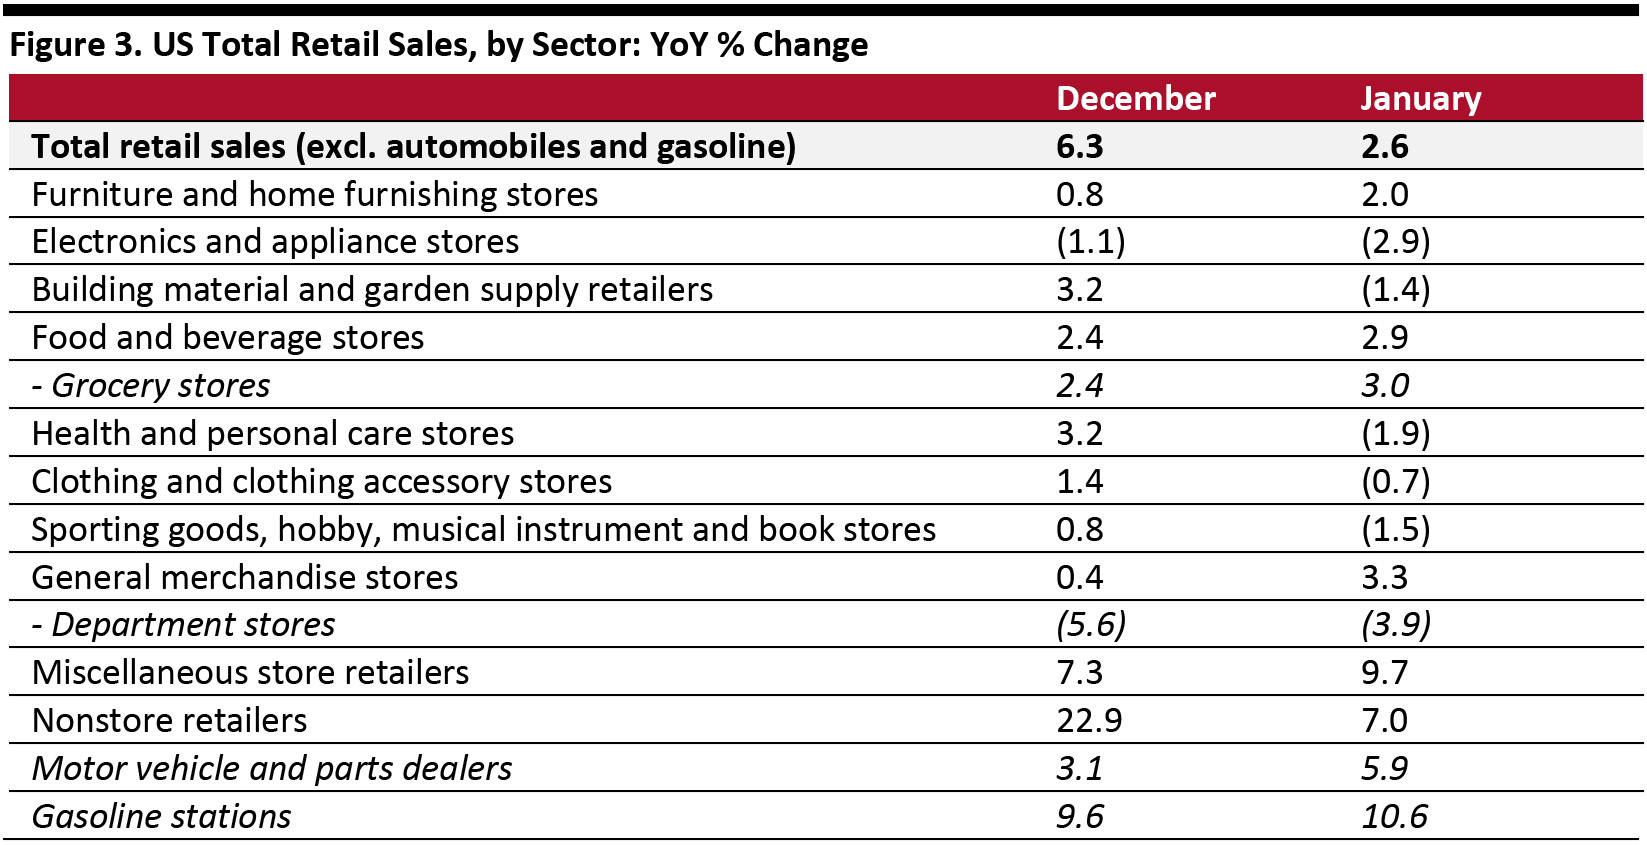 Data is not seasonally adjusted
Source: US Census Bureau/Coresight Research [/caption]
Data is not seasonally adjusted Source: US Census Bureau/Coresight Research [/caption] Retail Sales Increase Month Over Month The Census Bureau’s core metric is seasonally adjusted retail sales including automobiles and gasoline. Sales by this measure grew 4.0% year over year in January, slower than the 5.6% growth seen in December. On a month-over-month basis and seasonally adjusted, retail sales increased 0.1% in January. [caption id="attachment_103766" align="aligncenter" width="700"]
Data is seasonally adjusted Source: US Census Bureau [/caption] Retail Sales Growth by Sector Sales growth turned negative for several sectors in January, including building material and garden supply retailers; health and personal care stores; and, sporting goods, hobby, musical instrument and book stores. Electronics and appliance stores continued to see sales decline, down 2.9% year over year in January, deteriorating further from December’s 1.1% slide. Sales growth accelerated in food and beverage stores with sales at grocery stores up 3.0%, slightly above the overall food sector’s 2.9% growth. Sales at department stores (a sub-set of general-merchandise stores) remained negative in January, posting a 3.9% decline following a 5.6% decline in December. Clothing-store sales declined 0.7% in January, from December’s 1.4% increase. Nonstore retailer sales growth slowed to 7.0% in January, from 22.9% in December. Gasoline station sales continued to grow in January, up 10.6% year over year. [caption id="attachment_103767" align="aligncenter" width="700"]
Data is not seasonally adjusted Source: US Census Bureau/Coresight Research [/caption]