Feb 22, 2019
2 min

January 2019 US Monthly Retail Traffic and In-Store Metrics Report: Post-Holiday Fatigue and Inclement Weather Drive Underwhelming January Traffic

Insight Report
Insight Reports Gated Insight Reports

Nitheesh NH
Our US Monthly Retail Traffic and In-Store Metrics Report reviews year-over-year changes in selected store-based metrics, including sales, traffic and conversion rates. U.S. store-based traffic and sales declined in January, while the conversion rate grew by 0.4 percentage points, according to RetailNext. ATV grew 5.5%, maintaining its strong showing since October. The rate of product returns declined significantly, 2.4 percentage points, representing the first decline since August.
  • Retail traffic recorded a significant 10.7% decline year over year in January, the largest in the past twelve months, following a 5.9% decline in December.
  • Shopper yield (sales divided by traffic) experienced a notable 7.5% year over year growth in January following a 0.3% decline in December. This is the largest increase in shopper yield in the past twelve months.
January performance varied over the course of the four weeks, with in-store net sales experiencing declines between 6.3% and 8.1% and traffic declining 6.9% and 16.5%, with the second week of the month being the worst performing for both metrics. The underwhelming performance was considerably influenced by post-holiday fatigue, following a strong showing in the last two weeks of December, and the extreme cold. ATV and shopper yield registered growth in each week of the month. All regions posted sales and traffic declines in January compared to the same period last year. The Midwest registered the largest year-over-year decline in traffic of all regions at 17.5%, owing to severe weather conditions. With warmer and wetter conditions, the South experienced the lowest decline, at 5.8%. The Midwest also recorded the largest year-over-year in-store sales decline among all regions, down 16.8%, whereas the West, which enjoyed warmer and drier conditions, reported the smallest decline, down 1.4%. [caption id="attachment_77414" align="aligncenter" width="620"] 
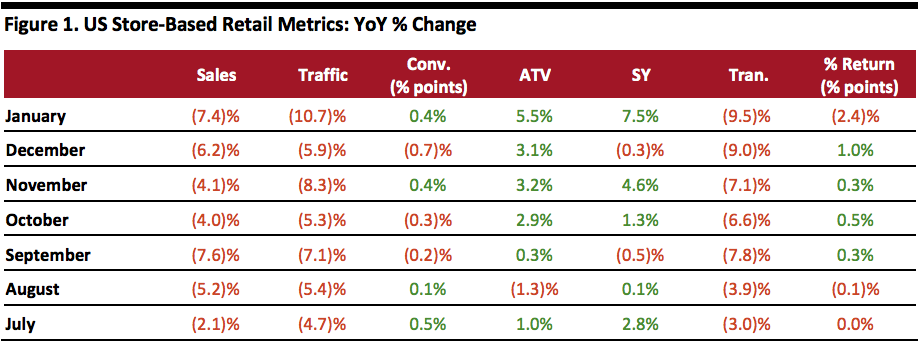
Conv. = conversion rate, ATV = average transaction value, SY = shopper yield, Tran. = number of transactions and % Return = percentage of goods returned to stores
Source: RetailNext
[/caption]

Trending Reports

US Consumer Tracker: Shopper Shifts Amid Summertime Cyclicality

December 2020 Monthly Consumer Update: US, UK and China

US Consumer Tracker: Shopper Shifts Amid Summertime Cyclicality

The C-Suite’s Evolution: Embracing Technology and Adapting to Hybrid Working …

For You

Woolworths (ASX: WOW) Company Profile

Signet Jewelers (NYSE: SIG) Company Profile

Li Ning Company Limited (SEHK: 2331) Company Profile

Earnings Insights 2Q22, Week 3: Capri and Ralph Lauren Report …

Recently Read

US Consumer Tracker: Shopper Shifts Amid Summertime Cyclicality

December 2020 Monthly Consumer Update: US, UK and China

US Consumer Tracker: Shopper Shifts Amid Summertime Cyclicality

The C-Suite’s Evolution: Embracing Technology and Adapting to Hybrid Working …