albert Chan
Introduction
What’s the Story?
In this report, we discuss five key ongoing consumer shopping trends in the US grocery market, using data sourced from IRI. We examine basket size and trip frequency, sales channels, price per unit, private labels and foodservice.
Why It Matters
The CPG and grocery sector showed exceptional strength throughout the pandemic, remaining one of the strongest performing retail segments. During 2022, CPG retailers and grocers must look to build on pandemic-driven momentum and position themselves for longer-term growth. To do so, companies need to identify which trends are returning to pre-pandemic preferences and which are proving sticky.
How US Consumers are Shopping for Groceries: Coresight Research Analysis
We summarize five shopping trends covered in this report in Figure 1 and discuss each in detail below.
Figure 1. Key Ongoing Shopping Trends in the US Grocery Market [caption id="attachment_142664" align="alignnone" width="550"]
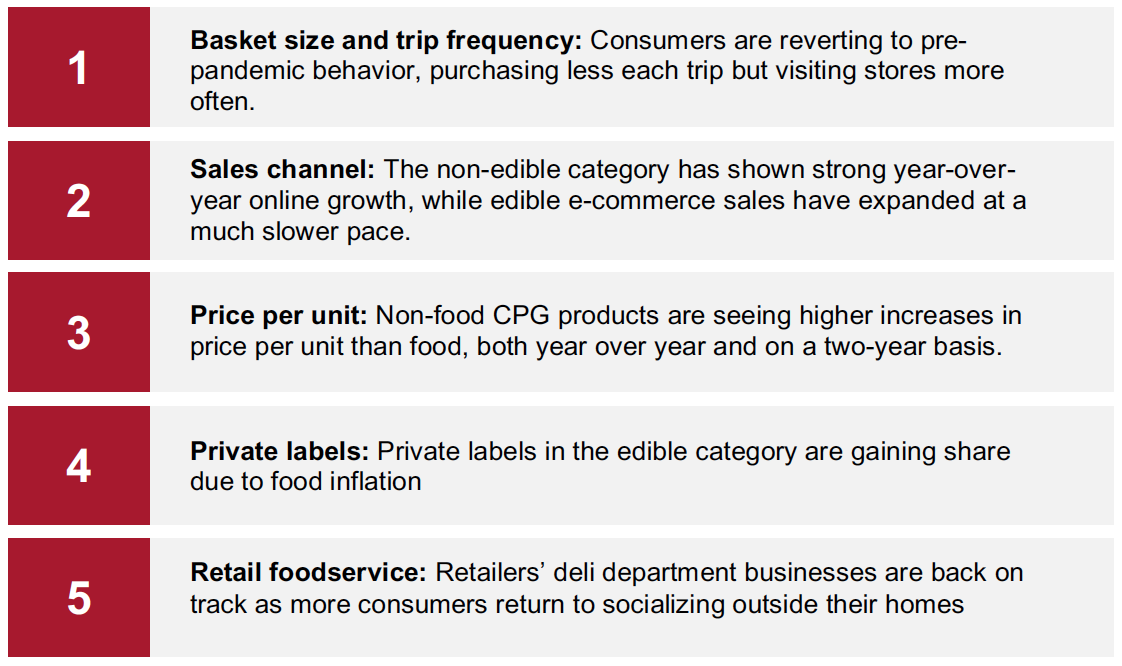 Source: Coresight Research[/caption]
1. Basket Size and Trip Frequency
Early in the pandemic, mission-driven shopping meant consumers made fewer trips to grocery stores and bought more in each basket. The trend for larger basket sizes coupled with fewer transactions continued as consumers limited their number of store visits due to health concerns.
As we approach two years of the pandemic, we are largely seeing a return to normalcy. Consumers are now shopping more frequently but purchasing less per visit. As shown in Figure 2, the number of weekly store visits for CPG shopping in January 2022 is higher than the same period last year, while the average basket size (spend per trip) was equal to or negative compared to last year.
Basket size year-over-year growth in dollar sales is skewed by inflation—which implies average basket size by units is lower than last year, meaning consumers are adding fewer items but paying more in cart totals.
Figure 2. US Stores: Growth in Number of Shopping Trips and Basket Size for CPG Purchases (YoY %) [caption id="attachment_142667" align="alignnone" width="700"]
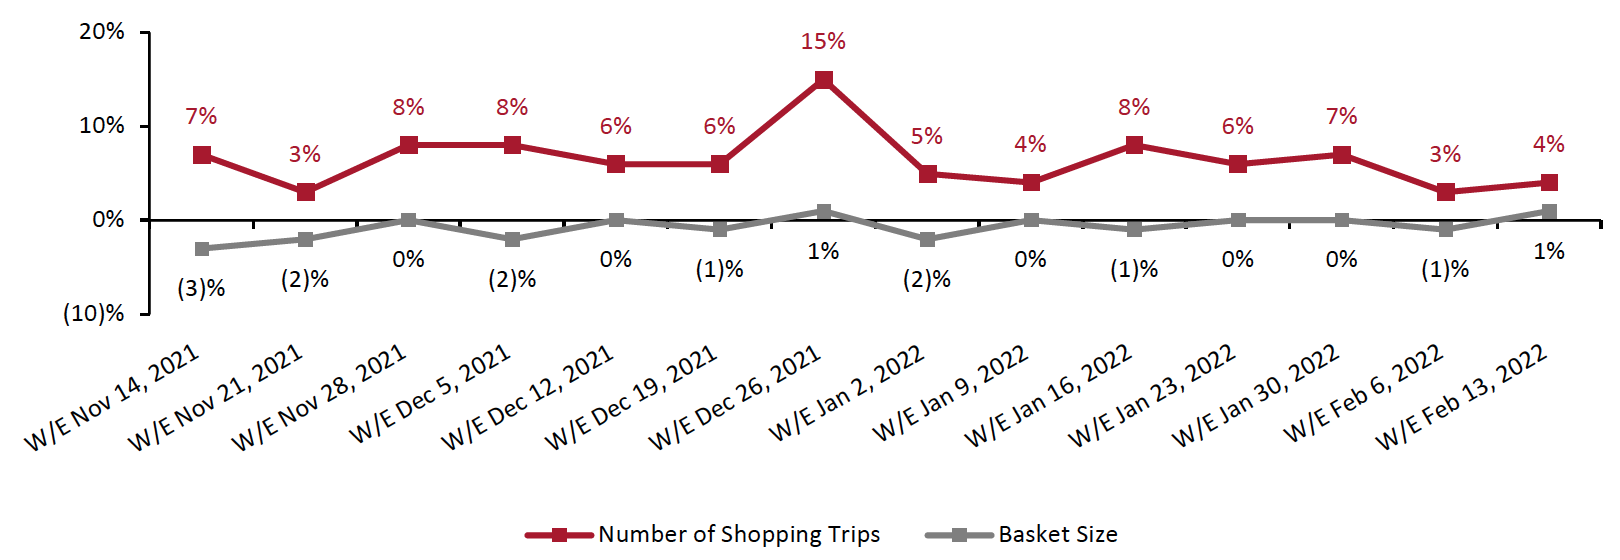 Source: IRI Consumer Network™ Panel[/caption]
By category, the average number of weekly shopping trips has increased in edibles, while basket size has primarily remained the same or decreased. However, year-over-year growth in store visits for the non-edible category has largely trailed behind its basket size growth—a notable exception being the week ended December 26, likely due to Christmas shopping. Overall, this suggests a greater retention of pandemic buying habits in the non-edible category—likely due to consumers’ increased willingness to purchase non-edibles online.
Source: IRI Consumer Network™ Panel[/caption]
By category, the average number of weekly shopping trips has increased in edibles, while basket size has primarily remained the same or decreased. However, year-over-year growth in store visits for the non-edible category has largely trailed behind its basket size growth—a notable exception being the week ended December 26, likely due to Christmas shopping. Overall, this suggests a greater retention of pandemic buying habits in the non-edible category—likely due to consumers’ increased willingness to purchase non-edibles online.
Figure 3. US Stores: Growth in Number of Shopping Trips and Basket Size for CPG Purchases (YoY %) [caption id="attachment_142668" align="alignnone" width="700"]
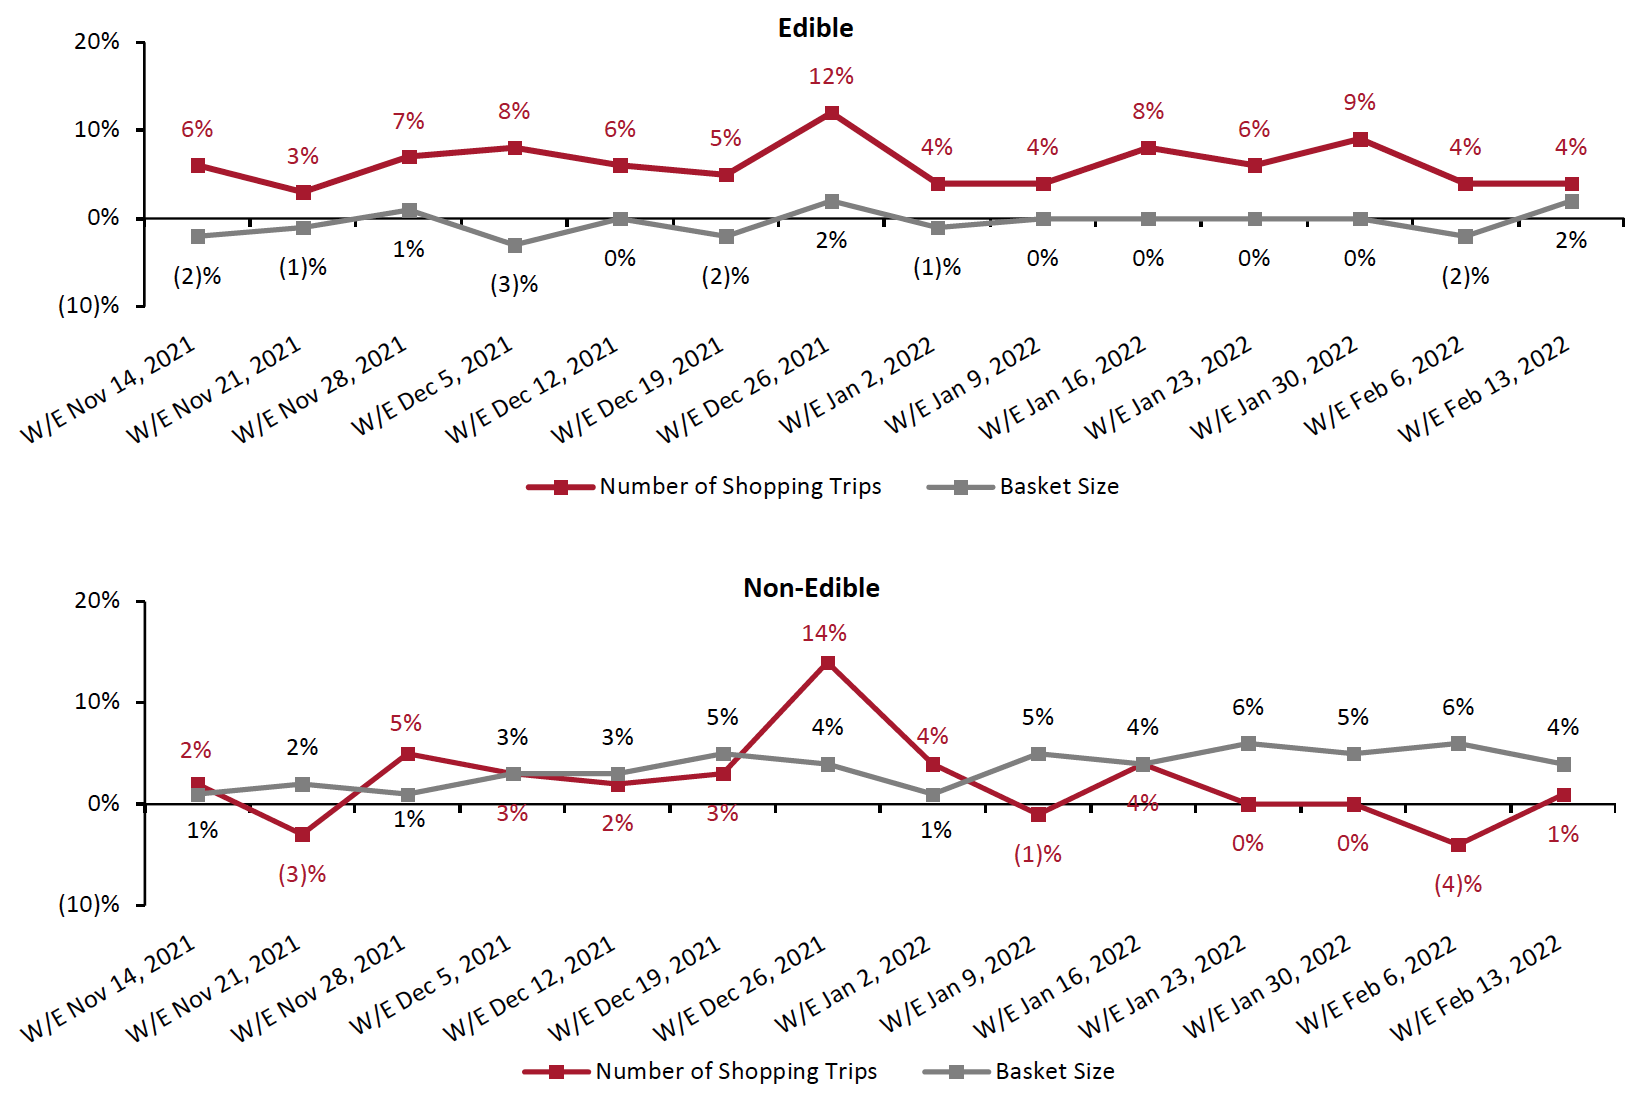 Source: IRI Consumer Network™ Panel[/caption]
2. Sales Channel
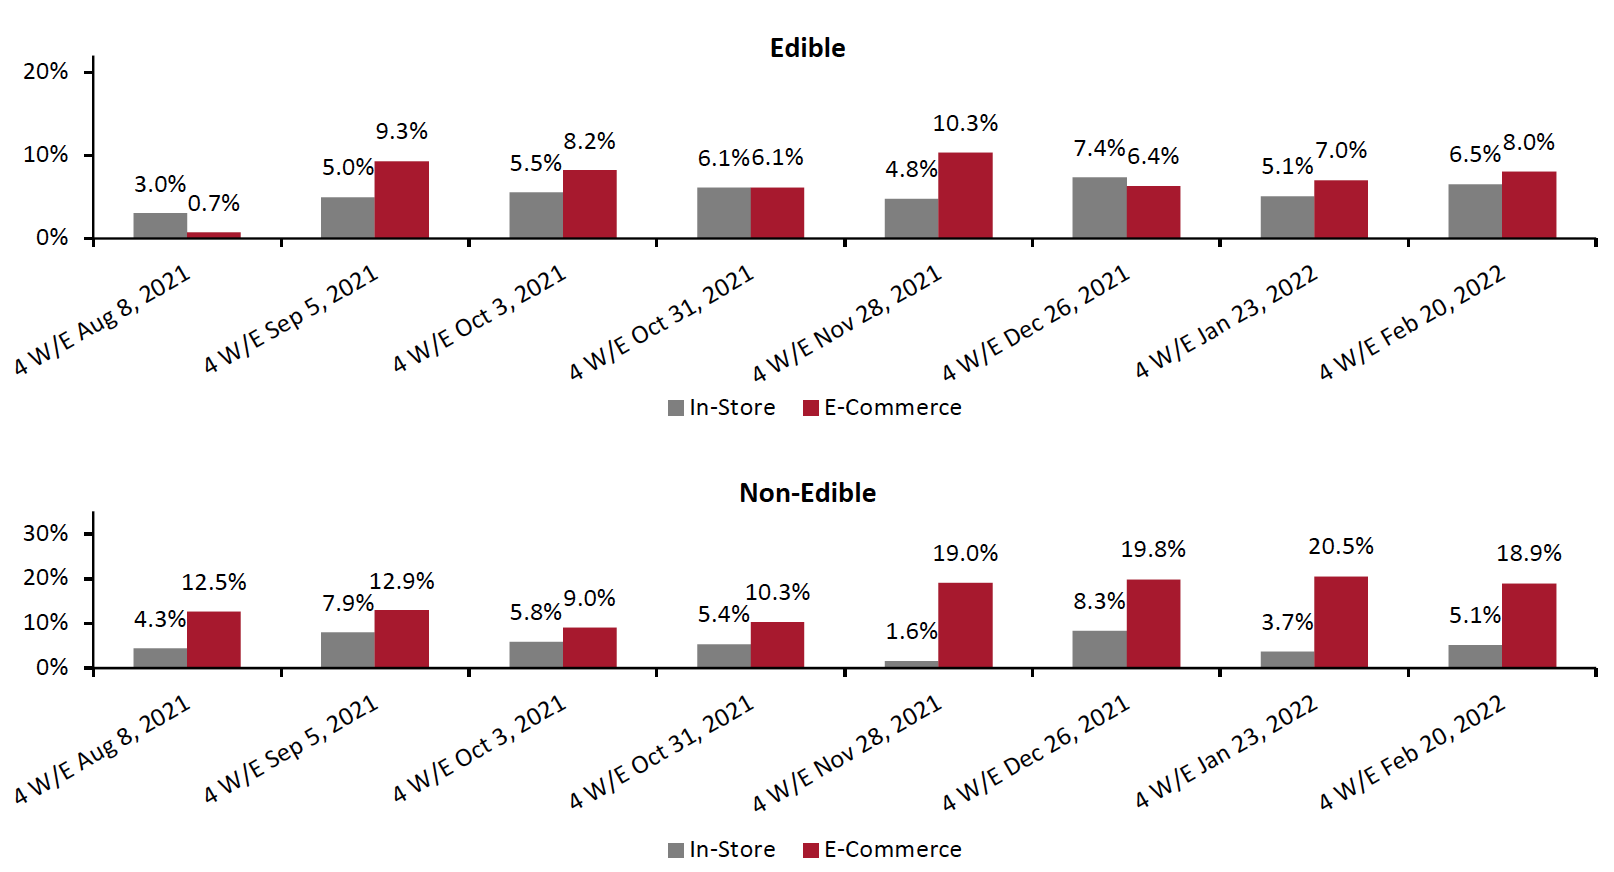
In-store edible sales growth has trended upwards over the last seven months, only dipping slightly in November. At the same time, edible e-commerce sales have expanded at a slower pace: brick-and-mortar sales reported 7% growth in December, above the 6% online growth for the same month.
The non-food online category has remained strong since June, despite experiencing record year-over-year growth during the year-ago period. Comparing categories, non-edible has shown higher online year-over-year growth, likely due to consumers returning to stores for non-edible shopping more slowly. This reinforces the above point that consumers have retained pandemic shopping habits to a greater extent in non-edibles than edibles.
On a broader level, total CPG e-commerce has largely cemented its pandemic-driven gains—online sales in 2021 were more than double levels in pre-pandemic 2019. As a consequence, retailers can no longer afford to sell via a single channel: The pandemic has underscored the importance of connecting online and physical channels to optimize consumer connections.
Figure 4. US CPG Sales: In-Store and E-Commerce (YoY % Change) [caption id="attachment_142669" align="alignnone" width="700"]
 Source: IRI E-Market Insights™[/caption]
3. Price Per Unit
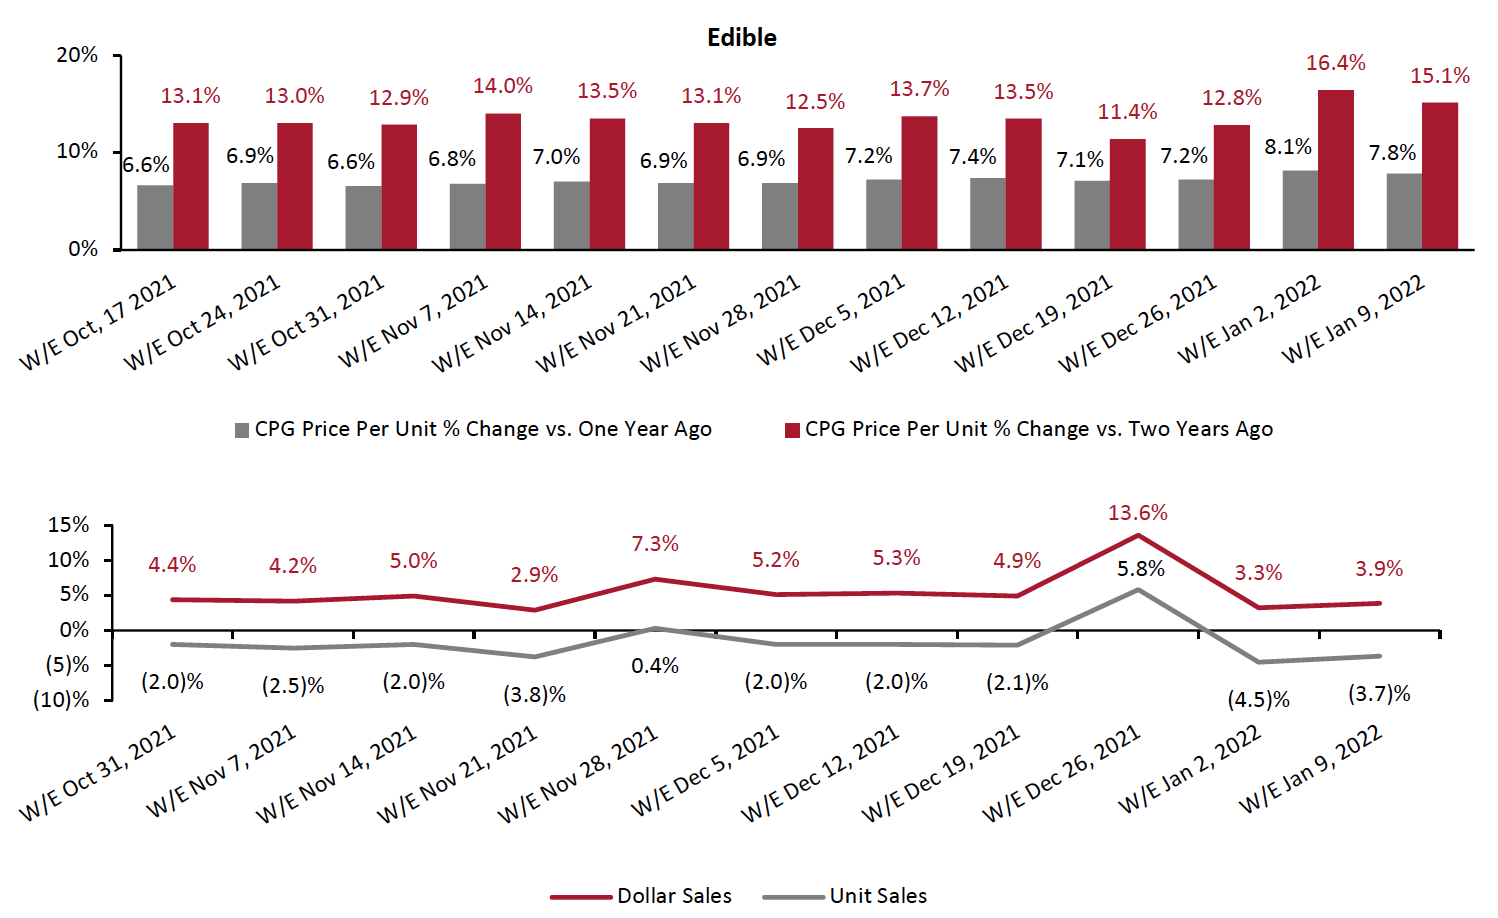
Inflation for CPG products is running hotter than it has for many years. Non-food CPG products are seeing a higher weekly increase in IRI-measured price per unit than food, both year over year and on a two-year basis. Overall, weekly dollar sales growth has stayed positive, even as CPG unit sales growth has declined—meaning shoppers are consuming less but paying more compared to a year ago, as shown in Figure 5 below.
CPG price-per-unit metric growth is occurring in tandem with broader consumer price increases, and the US’s inflationary trend—caused by supply chain disruptions, increased fuel costs, rises in wages and shortages of product materials. As a result, many grocery retailers have announced that they will strategically pass costs to the consumer. In its third-quarter earnings call on December 2, 2021, for example, Kroger stated that it would be pass higher costs to customers where it makes sense to do so.
We expect that consumers will become much more price sensitive during 2022. Since the beginning of the pandemic, consumers have generally taken price increases in their stride—they needed groceries and household essentials, as they spent more time at home. Federal stimulus programs also helped boost household finances. However, the end of pandemic-assistance programs, alongside inflation’s offsetting effect on wage increases, means that consumers will be more likely to keep their grocery spending in check. We believe many consumers will purchase less, trade down to cheaper brands and migrate to hard discounters if inflation continues to rise.
Figure 5. US Stores: Weekly Growth in In-Store CPG Price-Per-Unit and Dollar Versus Unit YoY Sales Growth (% Change)
 [caption id="attachment_142671" align="alignnone" width="700"]
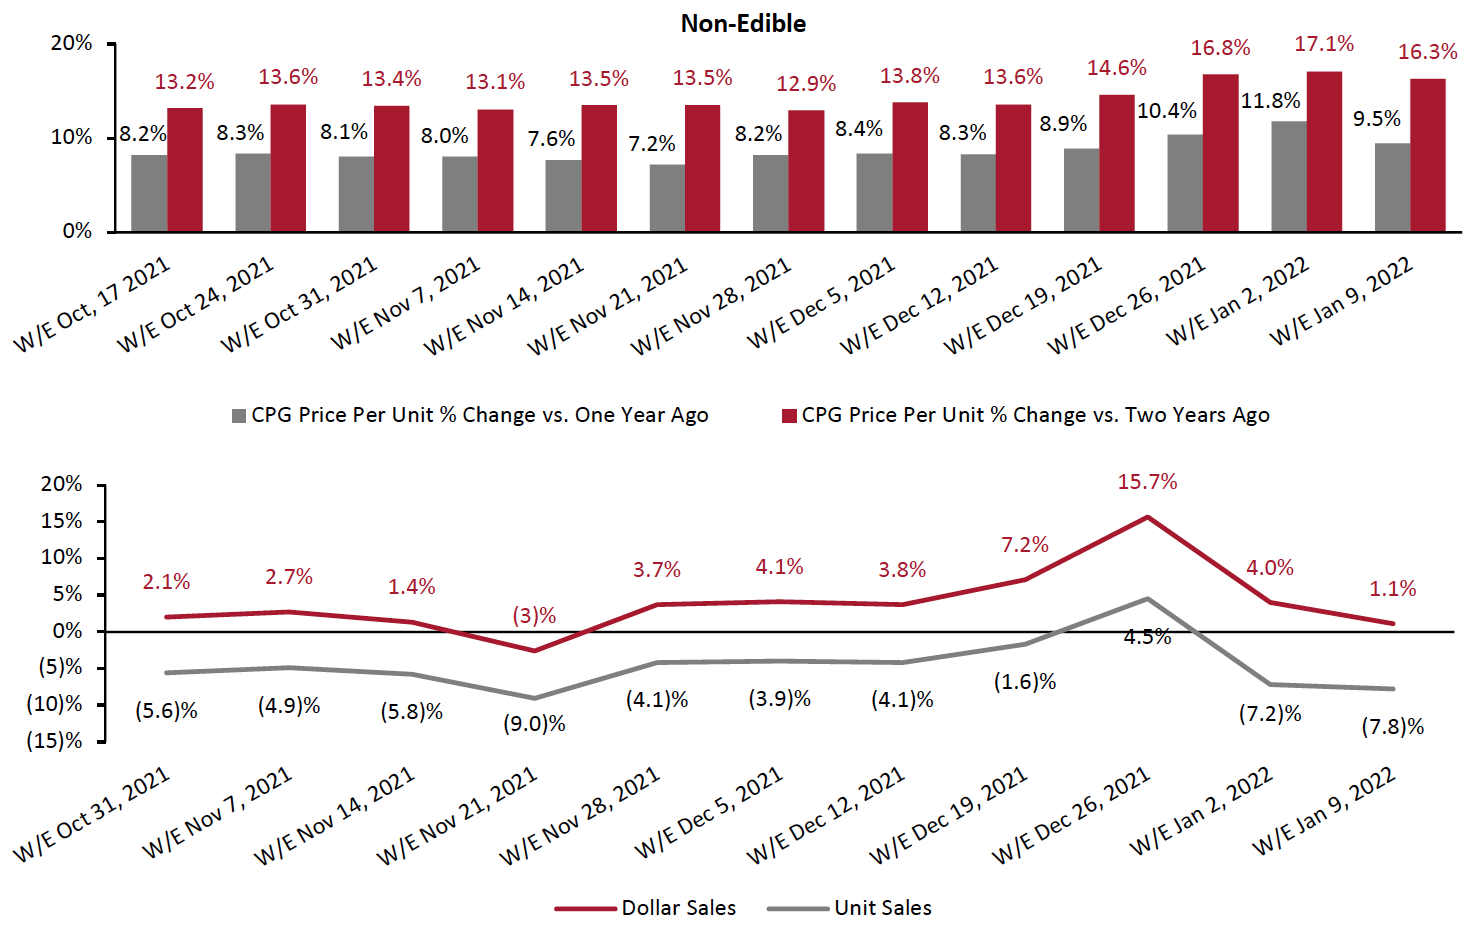 Source: IRI POS Data[/caption]
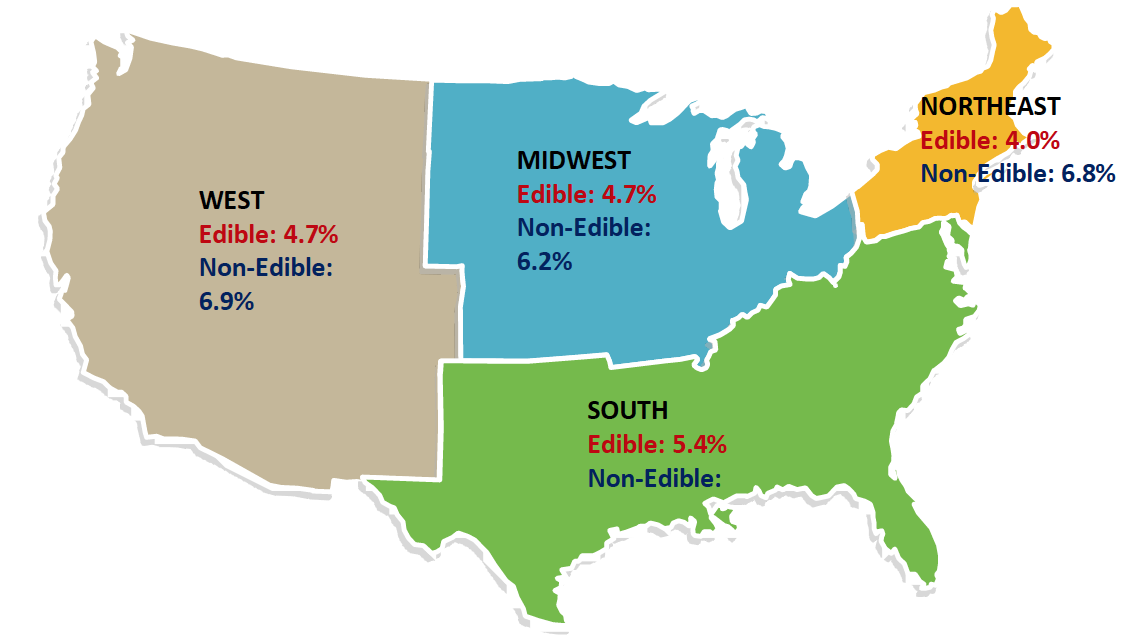
By geographical region, the South of the US saw the highest edible year-over-year growth in price per unit for the year ended December 26, 2021, while both the West and South saw the highest non-edible growth of 6.9%.
Source: IRI POS Data[/caption]
By geographical region, the South of the US saw the highest edible year-over-year growth in price per unit for the year ended December 26, 2021, while both the West and South saw the highest non-edible growth of 6.9%.
Figure 6. US CPG Sales: In-Store and E-Commerce (YoY % Change) [caption id="attachment_142672" align="alignnone" width="700"]
 Source: IRI POS Data[/caption]
4. Private Label
Private-label penetration in the edible category rose steadily for five consecutive years to 2020—but ceded share to name brands in 2021. Federal assistance programs and household budget reallocation, due to reduced spending on vacations and dining out, contributed towards the decrease.
However, this trend is beginning to turn again, with private labels gaining share for the five weeks ended January 30, 2022 (as shown in Figure 7 below). Several food suppliers such as Campbell Soup and Mondelez International, as well as consumer product companies such as Proctor & Gamble, have announced price increases on grocery items, making consumers more likely to try private labels.
Figure 7. US: Market Breakdown, by Food and Beverage Name Brand and Private-Label Sales Value (% of Total Sales) [caption id="attachment_142673" align="alignnone" width="700"]
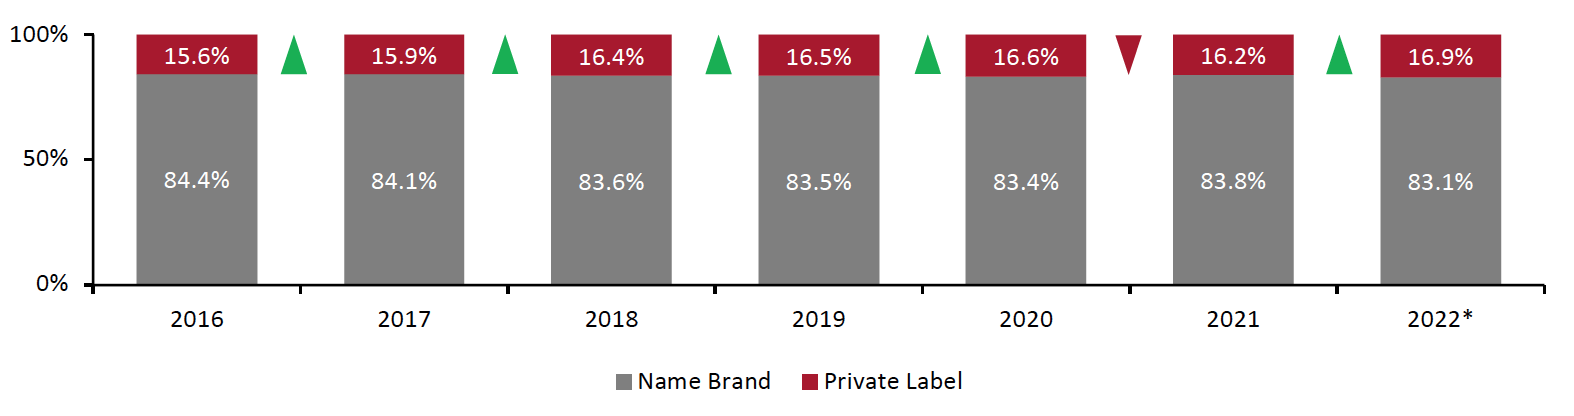 Excludes online sales
*Five weeks ended January 30, 2022
Source: IRI POS data/Coresight Research[/caption] Although private labels lost share to name brands in 2021, they increased share in high-inflation categories such as frozen foods, poultry and meat products.
Figure 8. US: Top Edible Categories That Private Label Gained Share in 2021 [wpdatatable id=1793] Excludes online sales Source: IRI POS Data/Coresight Research
In 2022, we expect inflation to test consumer loyalty to name brands—potentially giving private labels their best opportunity in years to gain market share. We expect that retailers’ recent investments in expanding their own brands will position them better than ever to attract inflation-weary customers.
5. Retail Foodservice
The pandemic reversed a decade-long trend of market share gravitating from retail to foodservice. Figure 9 below shows the share of food-at-home and foodservice spending since 2000, illustrating that the pandemic caused market share to dramatically shift to food retail in 2020. However, in 2021, the foodservice sector recovered some of its lost share, as more consumers returned to eating and socializing outside their homes.
Figure 9. Total US Food Expenditures: Food-at-Home Spending Versus Food-Away-From-Home Spending [caption id="attachment_142675" align="alignnone" width="700"]
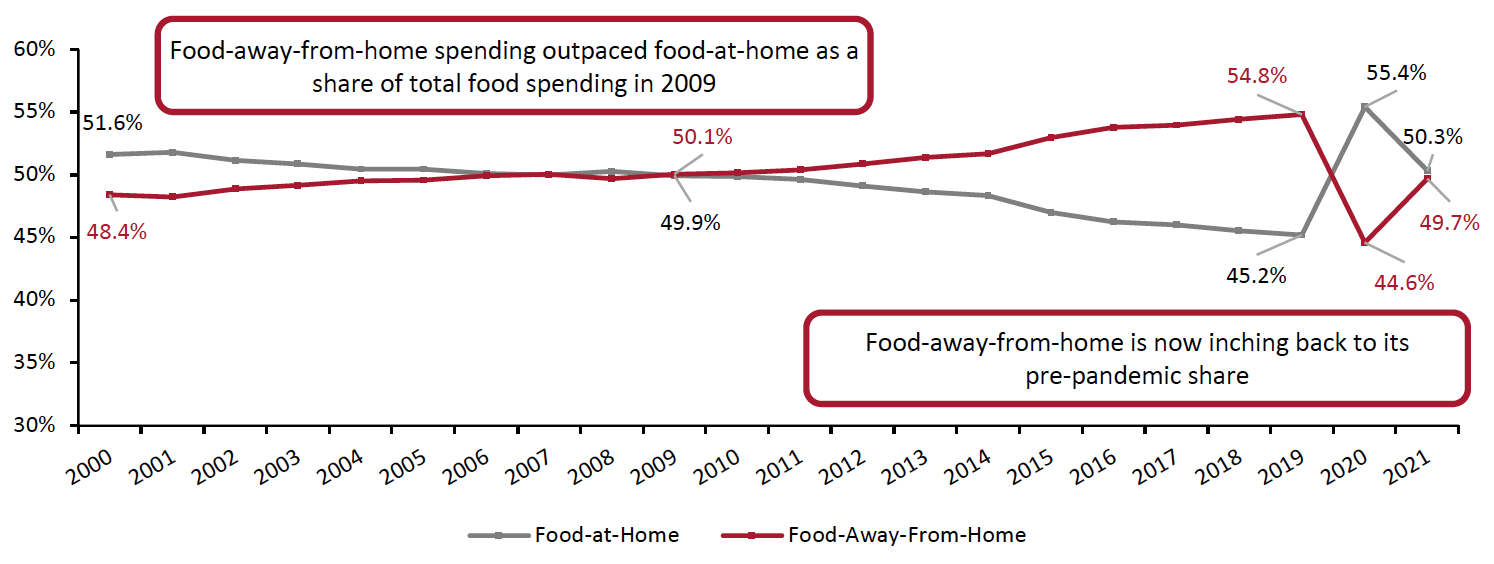 Source: USDA/Coresight Research[/caption]
Supermarket chains saw a significant reduction in deli departments in 2020—as self-serve prepared food bars and full-service counters were closed down for some or all of the year. However, they made a comeback last year, as consumers returned to stores and supermarkets reopened service departments. In 2021, deli department dollar sales increased 11.1% year over year and 13.1% compared to 2019, according to IRI.
The deli-prepared category, which suffered a 9.2% year-over-year decline in 2020, is once again becoming an area of growth for the deli department—supporting busy consumers with everyday meal needs, both as a full meal option and as meal ingredients. The deli-prepared category grew by a solid 18% year over year in 2021.
Figure 10. US: Deli-Prepared Sales YoY % Change [wpdatatable id=1794] Source: IRI, Total US, MULO, Integrated Fresh
What We Think
As the pandemic subsides, some consumer grocery shopping patterns are returning to their pre-pandemic norms, while others are persisting. We believe that e-commerce will likely remain resilient as shoppers become more comfortable with the channel and begin to merge their online and offline shopping behaviors.
Implications for Retailers
- We expect that dollar value growth of average basket size will contract further (albeit partially offset by inflation), as shoppers visit more stores to find the best deals to stretch their budgets.
- As consumers seek value in a growing inflationary environment, we are likely to see more trading down in 2022. We anticipate that dollar stores and discounters will become more sought-out channels.
- For retailers to raise prices effectively without alienating shoppers, it will be necessary to monitor product price elasticity across channels and tailor revenue management strategies accordingly, to maximize sales and margins. Retailers have a compelling opportunity to increase private-label penetration and basket share, as consumers seek to stretch their budgets.
- We expect that online shopping behaviors will remain more prominent in the non-edible category than the edible—likely due to consumers’ increased willingness to purchase non-edibles online. We believe that consumers will not make a full return to brick-and-mortar stores for the category.
- Though retail inflation is growing, the cost for eating out is rising more rapidly. Restaurant inflation will potentially result in more at-home preparation, as many consumers have realized the potential savings other benefits of cooking at home over the last two years. Grocery retailers have the opportunity to develop affordable meal solutions and shopping experiences designed to match the convenience of eating out, in order to target once-again busy shoppers
IRI Disclaimer: The information contained herein is based in part on data reported by the IRI E-Market Insights™ solution and as interpreted solely by Coresight Research. The information is believed to be reliable at the time supplied by IRI but is neither all-inclusive nor guaranteed by IRI or Coresight Research, Inc. Without limiting the generality of the foregoing, specific data points may vary considerably from other information sources. Any opinions expressed herein reflect the judgement of Coresight Research, Inc. and are subject to change. IRI disclaims liability of any kind arising from the use of this information.