DIpil Das
What’s the Story?
US grocery shoppers are gradually returning to pre-pandemic shopping behaviors. Using data from IRI resources, this report details three key ongoing trends in the US CPG market, as well as regional CPG sales growth.Why It Matters
The CPG and grocery sector showed exceptional strength and has remained one of the strongest performing retail segments throughout the pandemic. Yet, nearly halfway through 2021, it is clear that many consumers’ behavior patterns are shifting back toward pre-Covid preferences. To capitalize on last year’s surge and position themselves up for longer-term growth, CPG and grocers must identify the trends that are here to stay.Key Developing Trends in the US CPG Industry: A Deep Dive
We summarize three key trends in the US CPG industry in Figure 1 and discuss each in detail below. We also explore regional CPG growth later in the report.Figure 1. Key Ongoing Trends in the CPG Market [caption id="attachment_130352" align="aligncenter" width="725"]
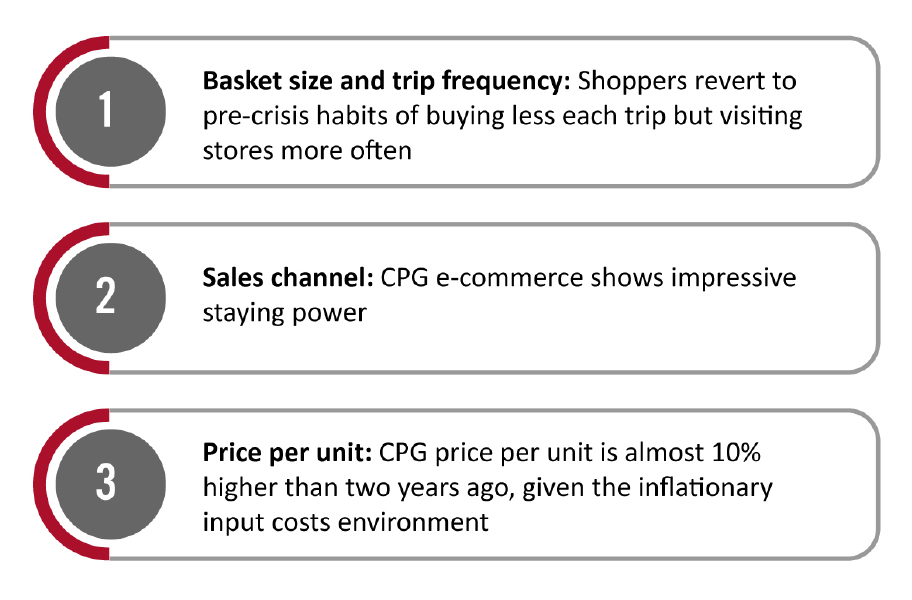 Source: Coresight Research[/caption]
1. Basket Size and Trip Frequency
Starting in late March 2020 when pandemic restrictions were first implemented, consumers began making fewer trips to grocery stores and buying more on each visit. The trend of larger basket sizes coupled with fewer transactions continued throughout the pandemic as consumers limited their number of store visits due to health concerns.
However, as vaccination rates rise and the economy recovers, consumers are now shopping more frequently, but purchasing less per visit—signifying a gradual return to normalcy. However, we still expect some e-commerce shopping habits to remain as the pandemic subsides.
As shown in Figure 2, the number of weekly store visits for CPG shopping has seen year-over-year growth since April 2021, while growth in the average basket size (spending per trip) turned negative in March this year. Consumer shopping patterns appear to be shifting back to pre-pandemic standards and the CPG retail space may need to adapt once again.
Source: Coresight Research[/caption]
1. Basket Size and Trip Frequency
Starting in late March 2020 when pandemic restrictions were first implemented, consumers began making fewer trips to grocery stores and buying more on each visit. The trend of larger basket sizes coupled with fewer transactions continued throughout the pandemic as consumers limited their number of store visits due to health concerns.
However, as vaccination rates rise and the economy recovers, consumers are now shopping more frequently, but purchasing less per visit—signifying a gradual return to normalcy. However, we still expect some e-commerce shopping habits to remain as the pandemic subsides.
As shown in Figure 2, the number of weekly store visits for CPG shopping has seen year-over-year growth since April 2021, while growth in the average basket size (spending per trip) turned negative in March this year. Consumer shopping patterns appear to be shifting back to pre-pandemic standards and the CPG retail space may need to adapt once again.
Figure 2. US Stores: Growth in Number of Shopping Trips and Basket Size for CPG Purchases (YoY %) [caption id="attachment_130367" align="aligncenter" width="724"]
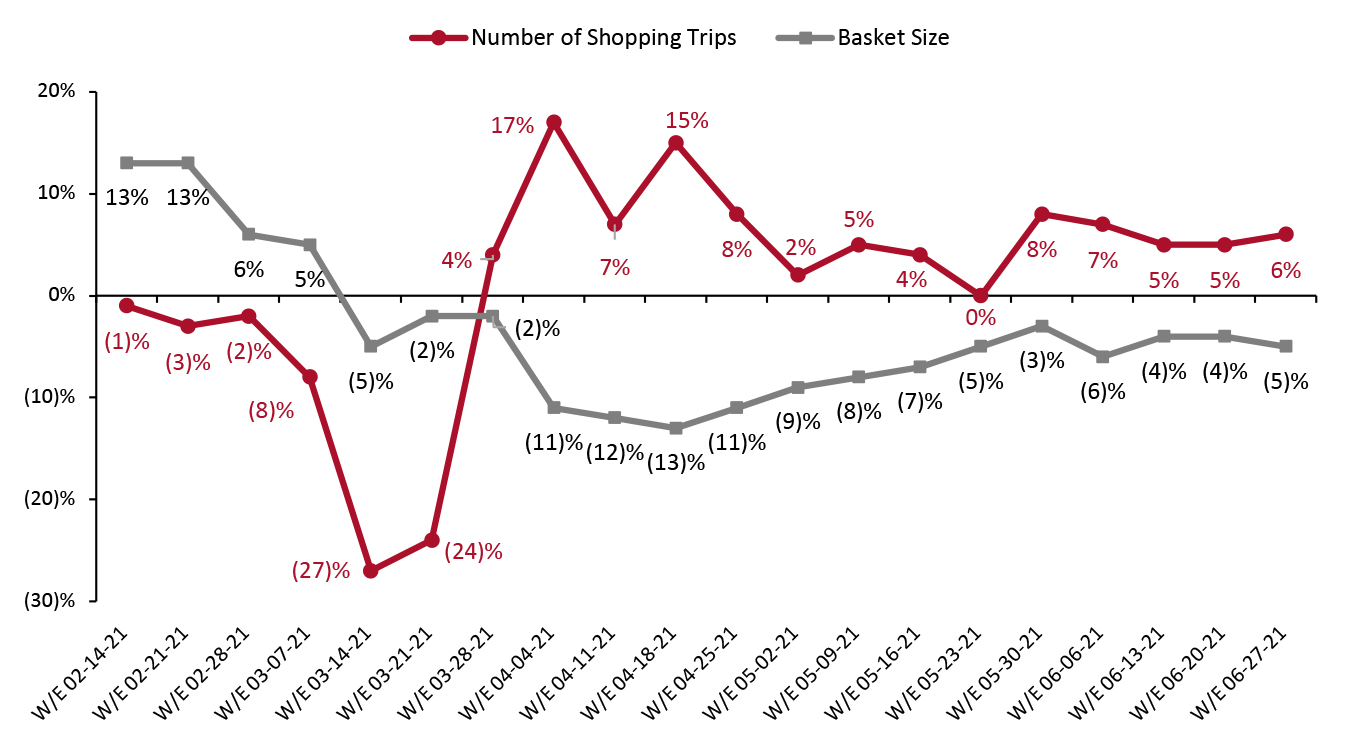 Source: IRI Consumer Network Panel[/caption]
By category, the average number of weekly shopping trips has increased in edibles, while basket size has decreased. However, store visits for non-edible shopping are flat or slightly down while basket size is slightly higher than last year. This suggests a greater retention of pandemic buying habits in the non-edible category—likely due to consumers’ increased willingness to purchase non-edibles online and consequently not make a full return to brick-and-mortar stores to purchase these items.
Source: IRI Consumer Network Panel[/caption]
By category, the average number of weekly shopping trips has increased in edibles, while basket size has decreased. However, store visits for non-edible shopping are flat or slightly down while basket size is slightly higher than last year. This suggests a greater retention of pandemic buying habits in the non-edible category—likely due to consumers’ increased willingness to purchase non-edibles online and consequently not make a full return to brick-and-mortar stores to purchase these items.
Figure 3. US Stores: Growth in Number of Shopping Trips and Basket Size for US CPG Purchases, Non-Edible vs. Edible (YoY %) [caption id="attachment_130368" align="aligncenter" width="725"]
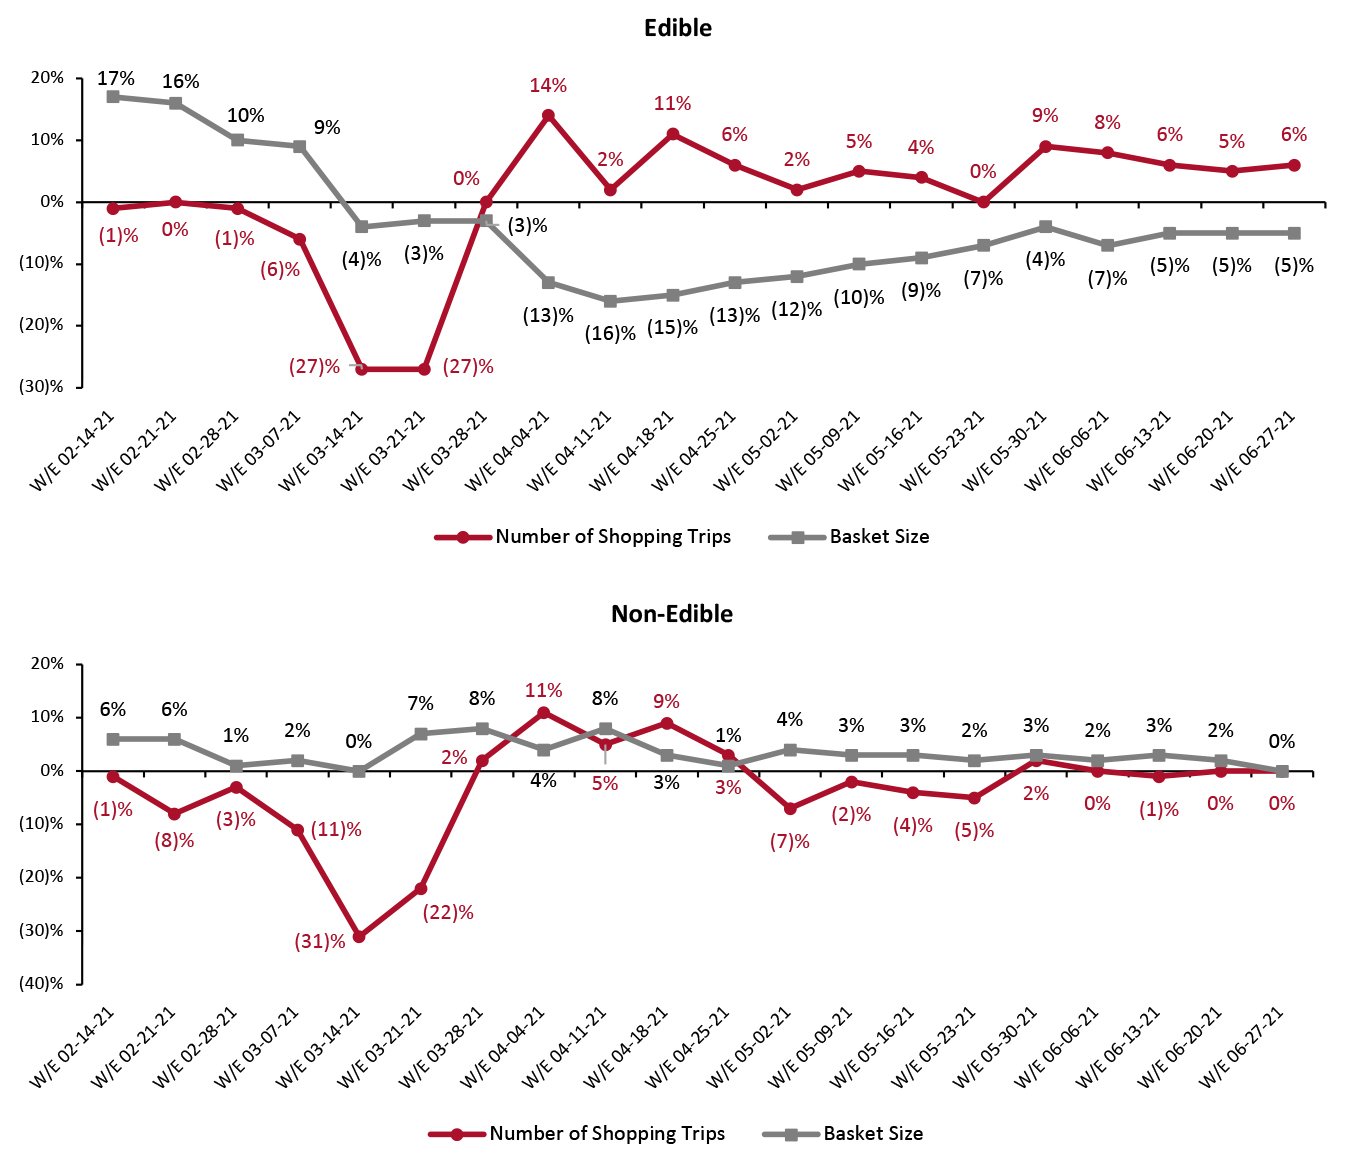 Source: IRI Consumer Network Panel[/caption]
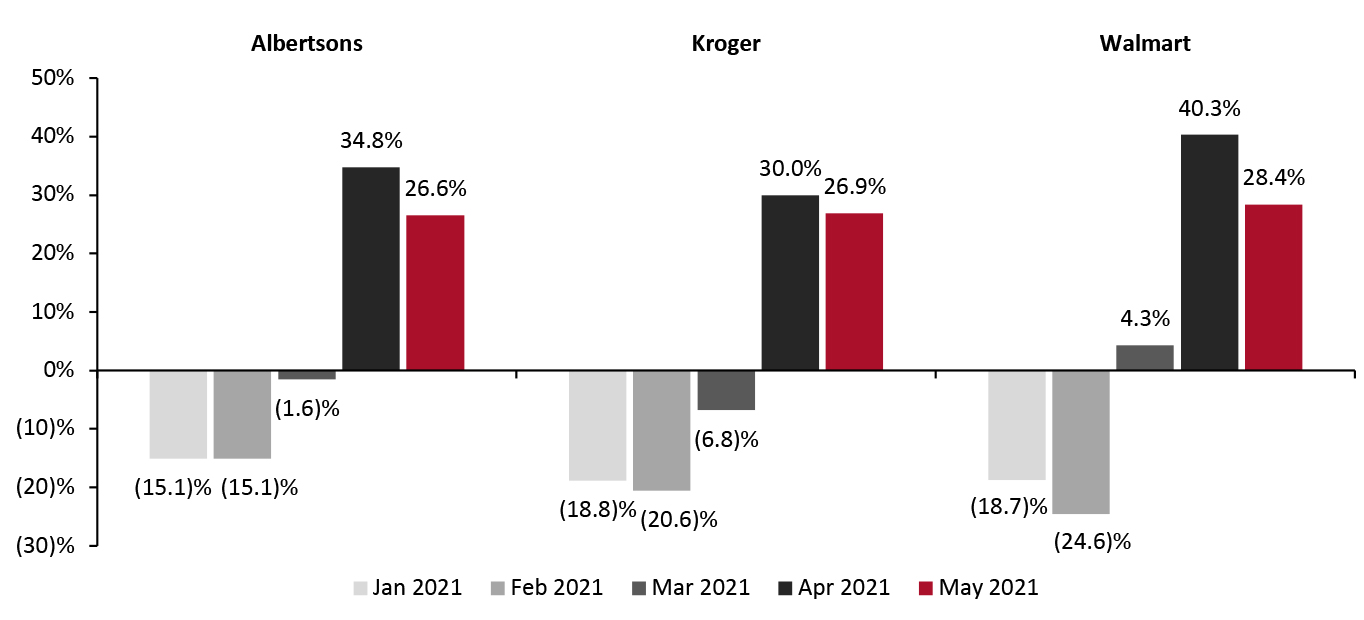
Reflecting the wider trends, Walmart and Kroger—the two largest grocery retailers in the US—saw store traffic levels increase in their latest reported quarters. In its earnings call for its quarter ended April 30, 2021, Walmart stated that it saw improving trends in its number of store transactions in the latter part of the quarter, with the numbers shifting from negative to positive year over year for the first time in one year. Similarly, for its fiscal quarter ended May 22, 2021, Kroger noted that its customers were shopping in-store more frequently after a year of consistently low store traffic.
According to data from location analytics platform Unacast, analyzed by Coresight Research, year-over-year foot traffic change at US Walmart stores turned positive for the first time in 2021 in March 2021, and in April for both Albertsons and Kroger, as shown in Figure 4. This was in part due to unusual comparatives from the same period last year, when stores experienced a sharp decline in visits due to lockdown restrictions.
Source: IRI Consumer Network Panel[/caption]
Reflecting the wider trends, Walmart and Kroger—the two largest grocery retailers in the US—saw store traffic levels increase in their latest reported quarters. In its earnings call for its quarter ended April 30, 2021, Walmart stated that it saw improving trends in its number of store transactions in the latter part of the quarter, with the numbers shifting from negative to positive year over year for the first time in one year. Similarly, for its fiscal quarter ended May 22, 2021, Kroger noted that its customers were shopping in-store more frequently after a year of consistently low store traffic.
According to data from location analytics platform Unacast, analyzed by Coresight Research, year-over-year foot traffic change at US Walmart stores turned positive for the first time in 2021 in March 2021, and in April for both Albertsons and Kroger, as shown in Figure 4. This was in part due to unusual comparatives from the same period last year, when stores experienced a sharp decline in visits due to lockdown restrictions.
Figure 4. Store Traffic at Albertsons, Kroger and Walmart (YoY % Change) [caption id="attachment_130369" align="aligncenter" width="726"]
 Source: Unacast/Coresight Research[/caption]
2. Sales Channel
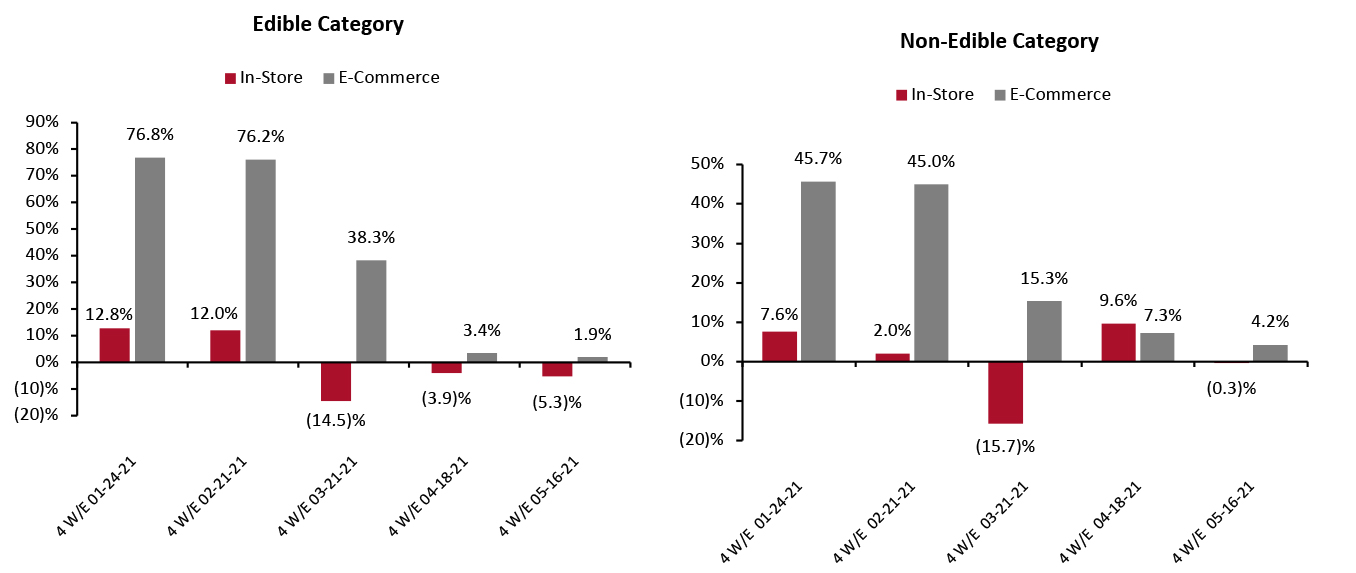
In-store CPG sales saw a significant decline for the four weeks ended March 21, 2021, partly due to the annualization of pandemic spending patterns. As Covid-19 hit the US in March 2020, the industry saw a boom in online spending—boosted by stockpiling and subsequent lockdown announcements that mandated the temporary closure of nonessential physical stores.
In-store food and beverage sales continued to shrink in the April–May 2021 period as part of a spending shift from food at home toward on-premise consumption, and as we cycle 2020’s tough comparatives. The non-food category showed an uptick for the four weeks ended April 18, 2021, although it remained almost flat for the latest reported period, the four weeks ended May 16, 2021.
CPG e-commerce is showing impressive staying power: Despite consumers’ gradual return to in-store shopping, shoppers are not abandoning online channels. Coresight Research estimates that online food and beverage sales will grow by 11% in 2021, reflecting the retention of pandemic-induced behaviors in the channel. Even against tough comparatives, year-over-year growth of CPG e-commerce has not yet turned negative, reflecting a retention of online shopping behaviors. Online food and beverage sales growth decelerated to 1.9% for the four weeks ended May 16, 2021—in comparison to record growth of 119% year over year during the same period last year. The category expanded by a solid 123.6% on a two-year basis (not shown in Figure 5).
The non-food online category also remained strong in the April–May period, despite experiencing record year-over-year growth during the year-ago period. Compared to the edible category, the non-edible category has shown higher year-over-year growth in the April–May period, echoing the slower return to stores we discussed above. This further suggests that consumers have retained pandemic shopping habits more in non-edibles than edibles.
Source: Unacast/Coresight Research[/caption]
2. Sales Channel
In-store CPG sales saw a significant decline for the four weeks ended March 21, 2021, partly due to the annualization of pandemic spending patterns. As Covid-19 hit the US in March 2020, the industry saw a boom in online spending—boosted by stockpiling and subsequent lockdown announcements that mandated the temporary closure of nonessential physical stores.
In-store food and beverage sales continued to shrink in the April–May 2021 period as part of a spending shift from food at home toward on-premise consumption, and as we cycle 2020’s tough comparatives. The non-food category showed an uptick for the four weeks ended April 18, 2021, although it remained almost flat for the latest reported period, the four weeks ended May 16, 2021.
CPG e-commerce is showing impressive staying power: Despite consumers’ gradual return to in-store shopping, shoppers are not abandoning online channels. Coresight Research estimates that online food and beverage sales will grow by 11% in 2021, reflecting the retention of pandemic-induced behaviors in the channel. Even against tough comparatives, year-over-year growth of CPG e-commerce has not yet turned negative, reflecting a retention of online shopping behaviors. Online food and beverage sales growth decelerated to 1.9% for the four weeks ended May 16, 2021—in comparison to record growth of 119% year over year during the same period last year. The category expanded by a solid 123.6% on a two-year basis (not shown in Figure 5).
The non-food online category also remained strong in the April–May period, despite experiencing record year-over-year growth during the year-ago period. Compared to the edible category, the non-edible category has shown higher year-over-year growth in the April–May period, echoing the slower return to stores we discussed above. This further suggests that consumers have retained pandemic shopping habits more in non-edibles than edibles.
Figure 5. US CPG Sales: In-Store and E-Commerce (YoY % Change) [caption id="attachment_130370" align="aligncenter" width="724"]
 Source: IRI E-Market Insights™[/caption]
3. CPG Price per Unit
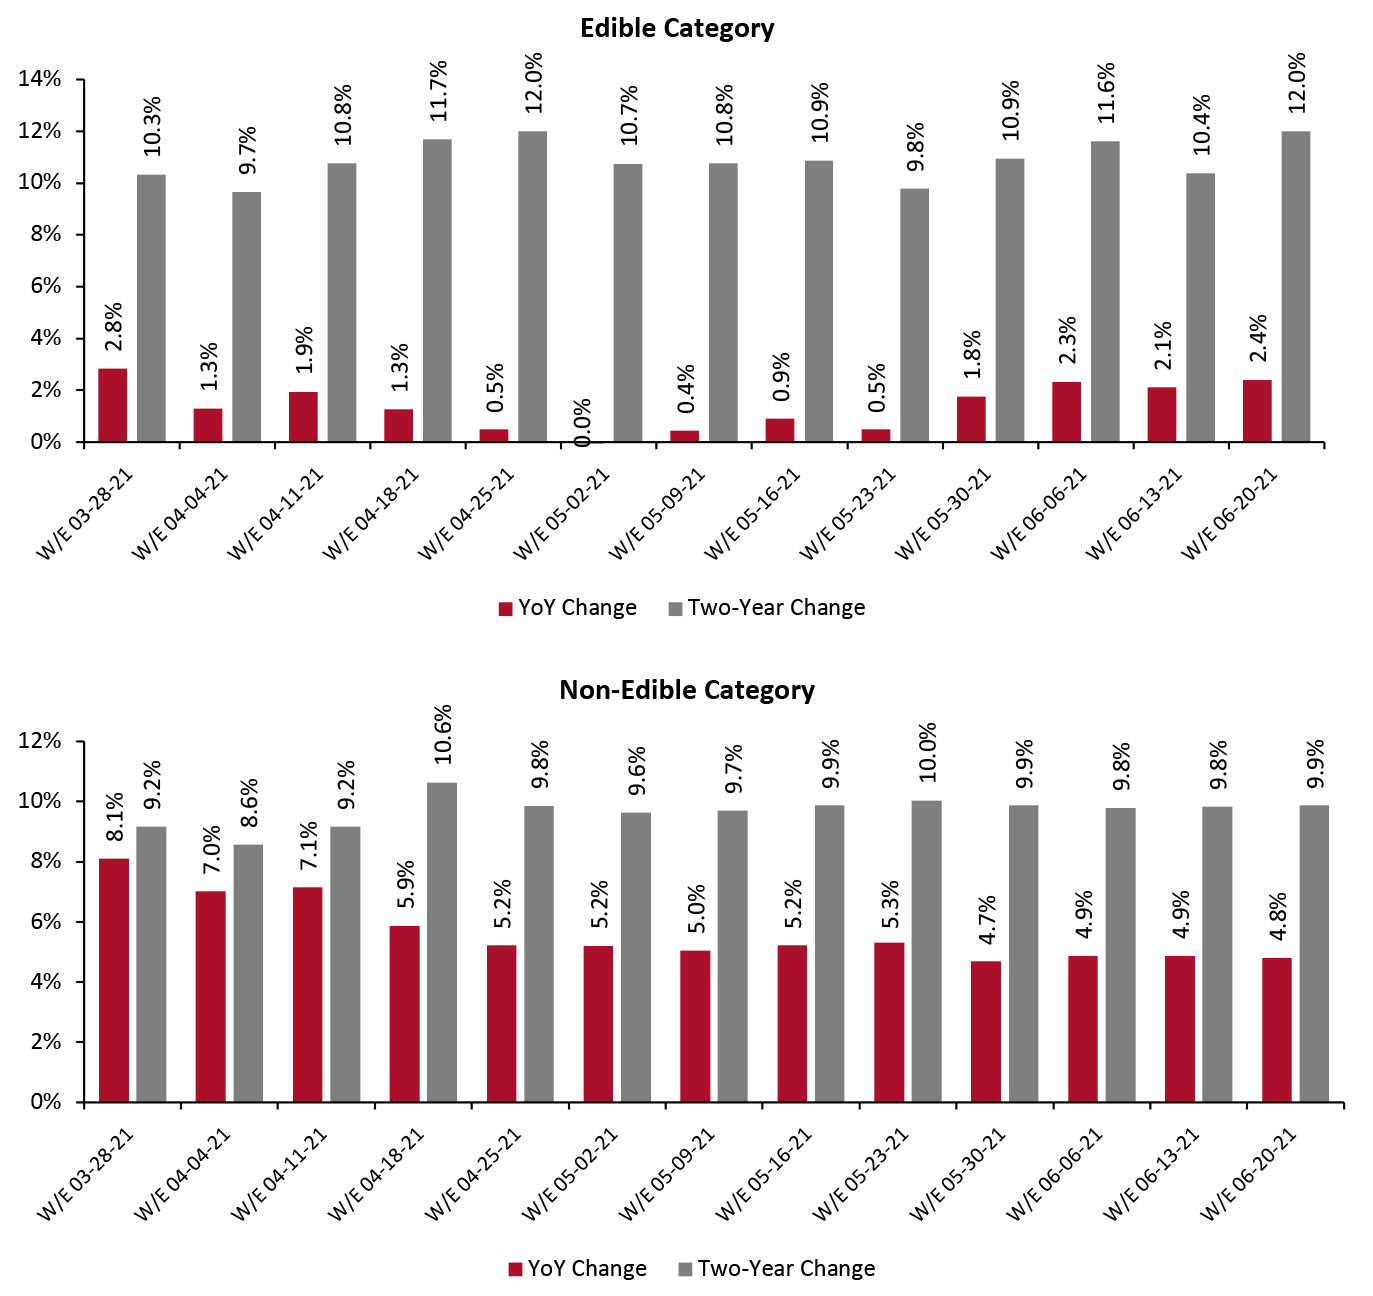
Since March, non-food CPG products have seen a higher weekly year-over-year increase in price per unit than food—hovering at around 5%, as shown in Figure 6. However, the price-per-unit percentage increase in the food and beverage category is higher on a two-year basis, likely caused, in part, by consumers shifting to larger pack sizes during last year’s stockpiling and lockdown phase.
Price per unit is not a “pure” measure of inflation as it is impacted by what shoppers purchase—it is partly self-selected inflation. Price changes can also be affected by list price changes, changes in price promotion, trading up or down to higher or lower priced products, and purchasing smaller or larger pack sizes.
CPG price-per-unit metric growth is occurring in tandem with the broader Consumer Price Index-based inflationary trend in the US, caused by supply chain issues, increased fuel costs, rises in wages and product material shortages.
Grocery chains including Kroger and Albertsons have stated that they expect to benefit from rising prices. In its first-quarter earnings call, Kroger CEO Rodney McMullen stated that the company performs best when inflation is 3–4%. He added that Kroger can pass costs on to consumers when inflation hovers around that mark and “customers don’t overly react to that.” Albertsons CEO Vivek Sankaran also stated that the company has performed well in periods when inflation was at 3–4%.
However, there is a risk for grocery stores if inflation runs too high. Customers may stop purchasing an item if its cost becomes too high, hurting grocers’ sales. Consumers may also trade down to cheaper brands or migrate to hard discounters if inflation continues to rise. To maximize sales and margins, retailers must monitor product price elasticity across channels and tailor revenue management strategies accordingly.
Source: IRI E-Market Insights™[/caption]
3. CPG Price per Unit
Since March, non-food CPG products have seen a higher weekly year-over-year increase in price per unit than food—hovering at around 5%, as shown in Figure 6. However, the price-per-unit percentage increase in the food and beverage category is higher on a two-year basis, likely caused, in part, by consumers shifting to larger pack sizes during last year’s stockpiling and lockdown phase.
Price per unit is not a “pure” measure of inflation as it is impacted by what shoppers purchase—it is partly self-selected inflation. Price changes can also be affected by list price changes, changes in price promotion, trading up or down to higher or lower priced products, and purchasing smaller or larger pack sizes.
CPG price-per-unit metric growth is occurring in tandem with the broader Consumer Price Index-based inflationary trend in the US, caused by supply chain issues, increased fuel costs, rises in wages and product material shortages.
Grocery chains including Kroger and Albertsons have stated that they expect to benefit from rising prices. In its first-quarter earnings call, Kroger CEO Rodney McMullen stated that the company performs best when inflation is 3–4%. He added that Kroger can pass costs on to consumers when inflation hovers around that mark and “customers don’t overly react to that.” Albertsons CEO Vivek Sankaran also stated that the company has performed well in periods when inflation was at 3–4%.
However, there is a risk for grocery stores if inflation runs too high. Customers may stop purchasing an item if its cost becomes too high, hurting grocers’ sales. Consumers may also trade down to cheaper brands or migrate to hard discounters if inflation continues to rise. To maximize sales and margins, retailers must monitor product price elasticity across channels and tailor revenue management strategies accordingly.
Figure 6. US Stores: Weekly Growth in CPG Price-Per-Unit (%) [caption id="attachment_130371" align="aligncenter" width="725"]
 Source: IRI POS Data[/caption]
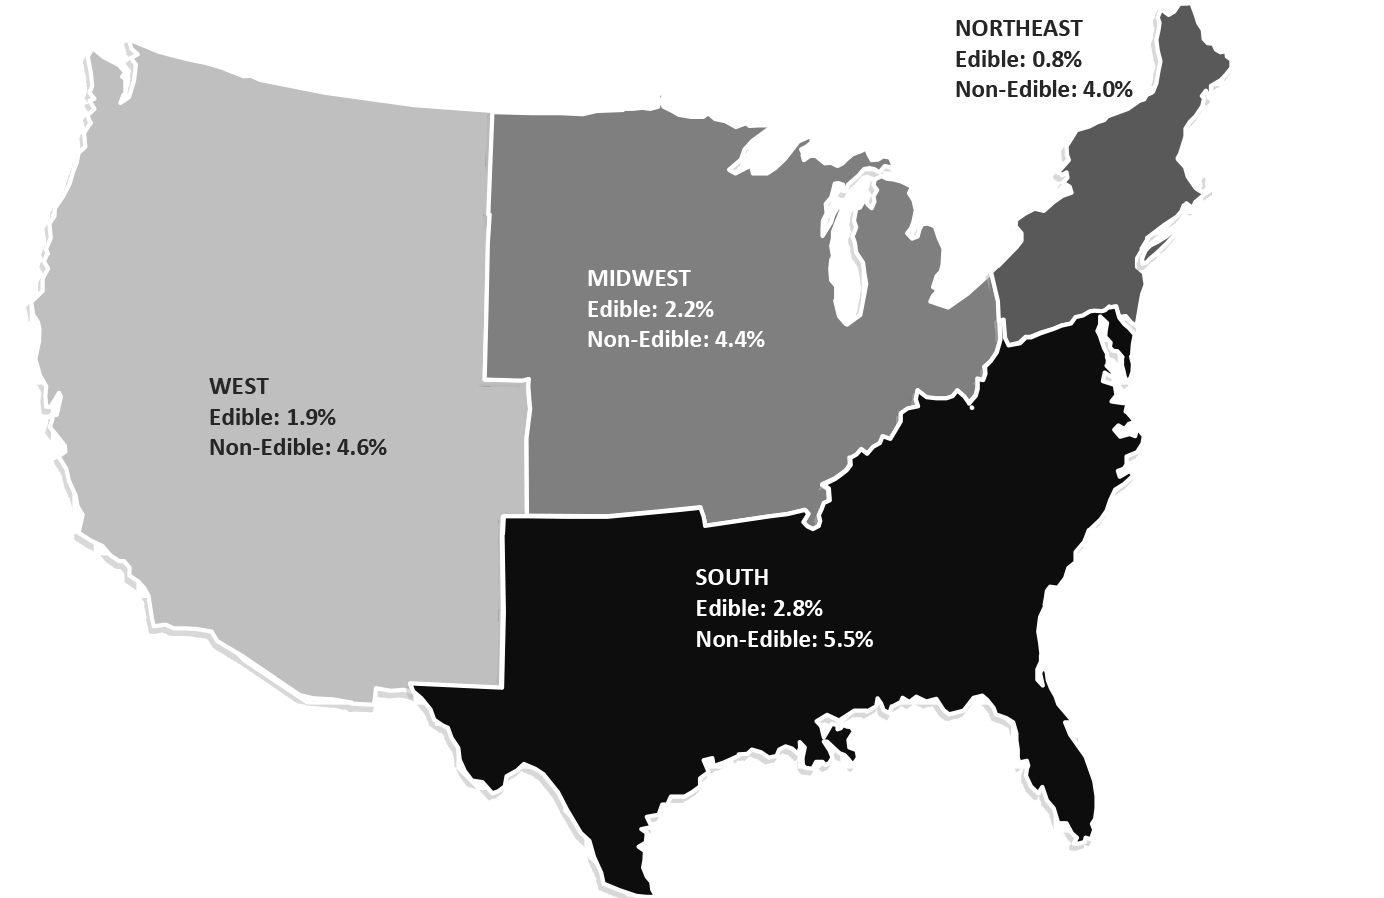
The South region of the US saw the highest CPG year-over-year growth in price per unit for the four weeks ended June 20, 2021, as shown in Figure 7.
Source: IRI POS Data[/caption]
The South region of the US saw the highest CPG year-over-year growth in price per unit for the four weeks ended June 20, 2021, as shown in Figure 7.
Figure 7. CPG Price per Unit, Four Weeks Ended June 20, 2021 (YoY % Change) [caption id="attachment_130358" align="aligncenter" width="724"]
 Source: IRI POS Data[/caption]
Regional CPG Growth
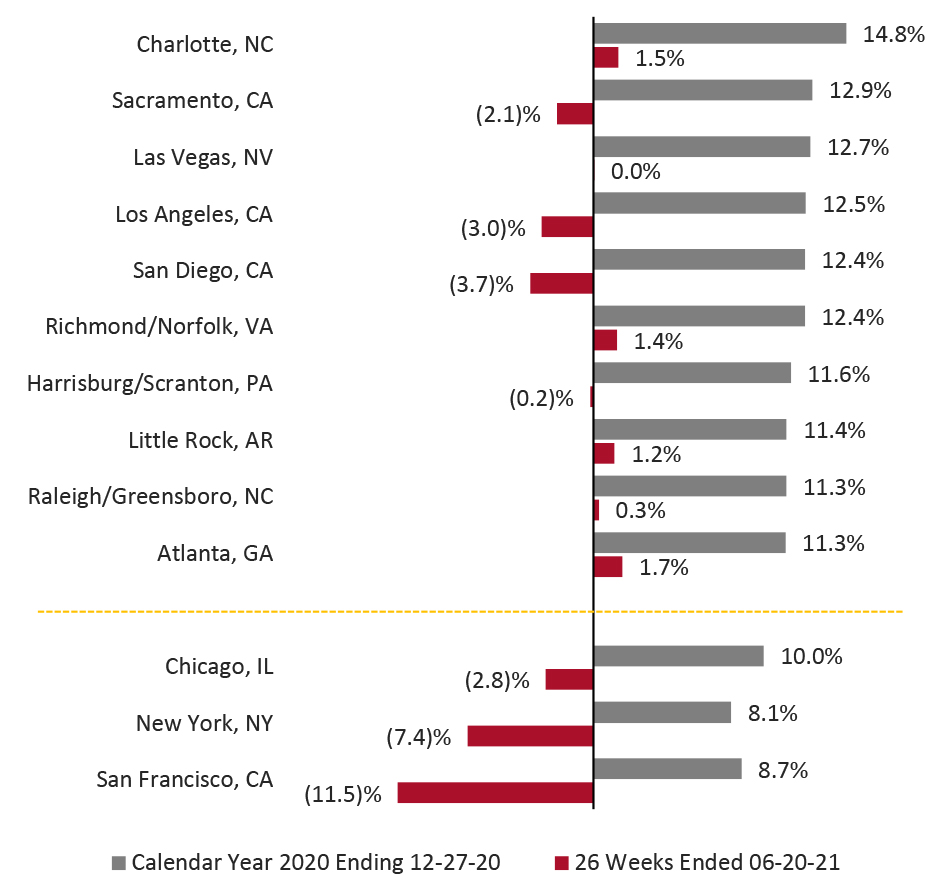
Figure 8 shows the top 10 markets by year-over-year growth in CPG store sales in 2020 along with growth in the first half of 2021 (the 26 weeks ended June 20, 2021).
In 2020, metropolitan markets and populous cities such as Chicago, New York and San Francisco saw growth below the average for all of 10.3% year over year, as consumers in these areas have more access to pure-play e-commerce options and also faced greater mobility restrictions. Additionally, many families left large metropolitan areas and migrated toward less dense and more affordable suburbs or small metropolitan areasduring the pandemic.
Source: IRI POS Data[/caption]
Regional CPG Growth
Figure 8 shows the top 10 markets by year-over-year growth in CPG store sales in 2020 along with growth in the first half of 2021 (the 26 weeks ended June 20, 2021).
In 2020, metropolitan markets and populous cities such as Chicago, New York and San Francisco saw growth below the average for all of 10.3% year over year, as consumers in these areas have more access to pure-play e-commerce options and also faced greater mobility restrictions. Additionally, many families left large metropolitan areas and migrated toward less dense and more affordable suburbs or small metropolitan areasduring the pandemic.
Figure 8. Top 10 Markets by Growth in CPG Sales in 2020 (YoY %) [caption id="attachment_130372" align="aligncenter" width="725"]
 Source: IRI POS Data[/caption]
What We Think
As the pandemic subsides, some consumer shopping patterns are returning to their pre-pandemic norms while others are persisting. It is not yet clear which changes will remain after the pandemic—however, we expect that the pandemic-induced basket size increase will fade away as shoppers venture out more often. Furthermore, e-commerce will likely stay resilient as shoppers become more comfortable with newly available purchase options and begin to merge online and offline shopping behaviors. Implications for Brands/Retailers- In light of the pandemic-induced rise in online shopping, we believe that the e-commerce channel will retain some permanent gain and that it will continue to grow even after the pandemic subsides. For the same reason, we expect that traffic and average ticket size for physical stores will likely never match their pre-pandemic levels.
- Shoppers reverting to their pre-pandemic pattern of visiting stores more frequently will benefit retailers. Impulse buys—which account for a large chunk of consumer spending—suffered significantlyduring the crisis. As consumers shop more frequently and stay longer inside stores, retailers can create impulse-buying opportunities, by increasing product visibility in stores, offering personalized recommendations at the point of sale, and promoting new and exclusive products at the impulse-buy price point.
- The online CPG channel has demonstrated continued strength and impressive staying power. Retailers should continue to invest in e-commerce infrastructure to improve online shopping experiences, including making apps and websites easier to use, improving e-commerce supply chain efficiency and providing friction-free last-mile services.
- Due to the inflationary environment, retailers should fine-tune their assortment by strengthening both premium and value offerings. To cater to low-income shoppers, retailers must ensure adequate opening price points and value products—while also driving sales of premium products to shoppers who are able to spend more on CPG products. Retailers would benefit from using promotions strategically to drive growth where there is greater price elasticity and return on investments.
IRI Disclaimer: The information contained herein is based in part on data reported by IRI POS Data and E-Market Insights solution and as interpreted solely by Coresight Research, Inc. The information is believed to be reliable at the time supplied by IRI but is neither all-inclusive nor guaranteed by IRI or Coresight Research, Inc. Without limiting the generality of the foregoing, specific data points may vary considerably from other information sources. Any opinions expressed herein reflect the judgment of Coresight Research, Inc. and are subject to change. IRI disclaims liability of any kind arising from the use of this information.