
DIpil Das
Introduction
What’s the Story? The final calendar quarter, encompassing multiple holidays and shopping occasions, reveals the strength of the consumer as we head into a new year. In 2021 US shoppers shopped, to say the least, beating high sales estimates for the holiday quarter despite another Covid-19 variant that reduced foot traffic in December. We discuss December and fourth quarter retail sales in the US and the key trends that impacted holiday shopping this year. Why It Matters The holiday season is a crucial time of the year for the retail industry: Retailers look to the fourth quarter to be driven by holiday demand. In 2021, US holiday-season retail sales (calendar fourth quarter) totaled $1.25 trillion, according to our analysis of US Census Bureau data, up 12.9% year over year—up significantly from the 9.2% increase in 2020 and comprising 28% of total US retail sales. On a two-year stack basis, calendar fourth-quarter sales rose 23.3%. In 2020, the online channel accounted for 23% of holiday sales, with e-commerce sales having increased by 32.5% year over year, according to the US Census Bureau. We expect a more muted growth rate for the final quarter of 2021 in the e-commerce channel (scheduled to be released February 18).US Holiday 2021 Retail Wrap-Up: Coresight Research Analysis
1. Consumers: What They Said and What They Did, In Their Own Words We surveyed consumers in late-September 2021 in our Holiday 2021 US Shopper Survey about their holiday spending expectations versus 2020. We again surveyed consumers in January 2022 to compare actual behavior versus expectations. Fewer people spent slightly more than originally planned and more people spent slightly less or a lot less than originally planned, yet this survey data isn’t supported by the season’s 12.9% total retail sales gain (more on that later in this report).Figure 1. Consumer Spending Expectations versus Actions [wpdatatable id=1668 table_view=regular]
Base: US respondents aged 18+ Source: Coresight Research. We asked consumers if they planned to do the activities listed in Figure 2: We can see the significant impact of Covid-19 on store visits and travel.
Figure 2. Consumer Activities, Expectations versus Actions [wpdatatable id=1669 table_view=regular]
Consumers could select more than one option Base: US respondents aged 18+ Source: Coresight Research In terms of what they intended to buy and what they did buy, we can see that a number of product categories saw five percentage points or more differences in actual versus purchasing intentions. Despite media warnings of out-of-stock merchandise, more consumers were able to purchase clothing, toys and games, home goods, food and drink and beauty than expected to do so.
Figure 3. Consumer Purchases, Expectations versus Actions [wpdatatable id=1670 table_view=regular]
Consumers could select more than one option Base: US respondents aged 18+ Source: Coresight Research
- See later in this report for more Coresight Research consumer survey data, on the subject of post-holiday returns.
Figure 4. US Retail Sales December 2021 (YoY % Change) [caption id="attachment_140531" align="aligncenter" width="700"]
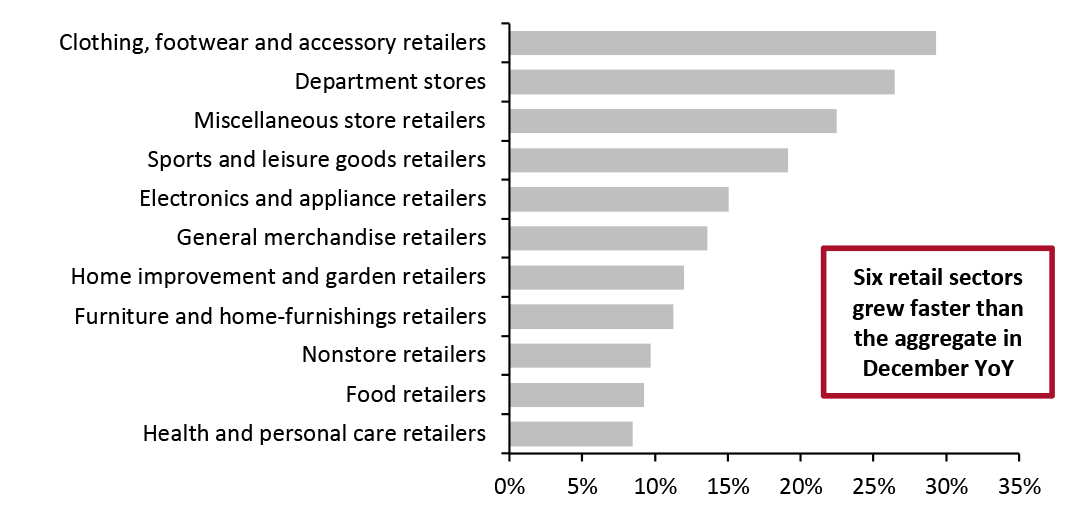 Source: US Census Bureau/Coresight Research [/caption]
Specialty retailers (apparel and sporting goods) and department stores are traditionally popular channels for gift shopping. Analyzing the final quarter sales data, we can see the traditional popular gifting channels recorded the strongest performance in the holiday shopping season led by clothing, footwear and accessory retailers which grew 30.8%, department stores which grew 24.7% and miscellaneous store retailers which grew 24.6%. Figure 2 shows that six retail sectors outperformed the aggregate sales gains, and ‘staple retailers’ selling food, health and personal care products, came in last, reflecting the discretionary nature of gifting and the holiday retail season. Interestingly, nonstore retailers have underperformed the overall 12.9% year-over-year gain in holiday sales, a testament to the US consumers engagement with physical retail and the social aspect of shopping.
Given the early fashion cycle we are in, consumers will spend months buying for a new silhouette of wider bottoms, clunky shoes, and broad shoulder jackets. For both men and women, a new hybrid work arrangement will require additional thought to apparel as well, benefitting specialty apparel retailers and department stores.
Source: US Census Bureau/Coresight Research [/caption]
Specialty retailers (apparel and sporting goods) and department stores are traditionally popular channels for gift shopping. Analyzing the final quarter sales data, we can see the traditional popular gifting channels recorded the strongest performance in the holiday shopping season led by clothing, footwear and accessory retailers which grew 30.8%, department stores which grew 24.7% and miscellaneous store retailers which grew 24.6%. Figure 2 shows that six retail sectors outperformed the aggregate sales gains, and ‘staple retailers’ selling food, health and personal care products, came in last, reflecting the discretionary nature of gifting and the holiday retail season. Interestingly, nonstore retailers have underperformed the overall 12.9% year-over-year gain in holiday sales, a testament to the US consumers engagement with physical retail and the social aspect of shopping.
Given the early fashion cycle we are in, consumers will spend months buying for a new silhouette of wider bottoms, clunky shoes, and broad shoulder jackets. For both men and women, a new hybrid work arrangement will require additional thought to apparel as well, benefitting specialty apparel retailers and department stores.
Figure 5. US Holiday Retail Sales: October–December (YoY % Change) [caption id="attachment_140532" align="aligncenter" width="700"]
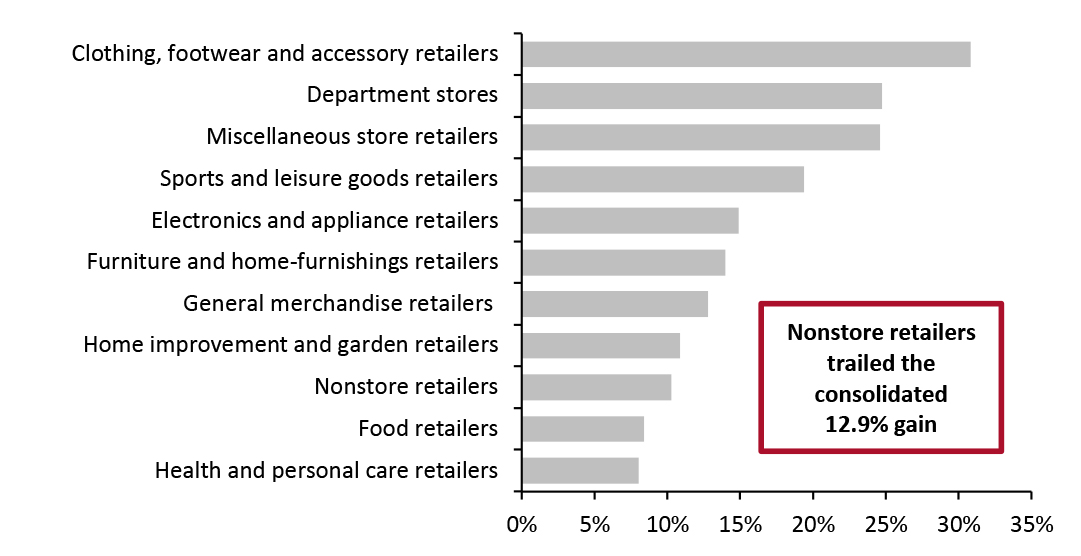 Source: US Census Bureau/Coresight Research [/caption]
On a two-year basis, holiday retail sales increased 23.3%, driven by sports and leisure goods retailers which are up 39% and nonstore retailers which are up 35.4%, while department stores moved to the back of the line and came in second to last with a 5.5% two-year sales increase followed by electronic and appliance stores up 4%.
The pandemic has provided the department store channel the opportunity to test and trial new strategies, including in the digital channel. New fashion trends, pent-up demand and vaccination rollouts have also prompted store visits by Covid-19-fatigued consumers, benefitting both department stores and clothing stores. Clothing, footwear and accessories trailed the aggregate gain at 17.8% as did general merchandise retailers, posting a two-year 20.2% gain. The 30.0% gain enjoyed by home improvement and garden centers reflect Covid-19-induced behaviors as consumers practiced social distancing and spent more time at home, upgrading their accommodations for a work-from-home environment.
This year will be pivotal to see if department stores can continue their turnaround and recreate relevancy beyond profit-eroding promotions. However, there will be numerous challenges, including the end of government stimulus, inflationary pressures across multiple discretionary and nondiscretionary categories and the gradual shift to more experiential/service-related purchases such as travel, sporting and cultural events as well as to dining out as pandemic-related health concerns hopefully diminish.
Source: US Census Bureau/Coresight Research [/caption]
On a two-year basis, holiday retail sales increased 23.3%, driven by sports and leisure goods retailers which are up 39% and nonstore retailers which are up 35.4%, while department stores moved to the back of the line and came in second to last with a 5.5% two-year sales increase followed by electronic and appliance stores up 4%.
The pandemic has provided the department store channel the opportunity to test and trial new strategies, including in the digital channel. New fashion trends, pent-up demand and vaccination rollouts have also prompted store visits by Covid-19-fatigued consumers, benefitting both department stores and clothing stores. Clothing, footwear and accessories trailed the aggregate gain at 17.8% as did general merchandise retailers, posting a two-year 20.2% gain. The 30.0% gain enjoyed by home improvement and garden centers reflect Covid-19-induced behaviors as consumers practiced social distancing and spent more time at home, upgrading their accommodations for a work-from-home environment.
This year will be pivotal to see if department stores can continue their turnaround and recreate relevancy beyond profit-eroding promotions. However, there will be numerous challenges, including the end of government stimulus, inflationary pressures across multiple discretionary and nondiscretionary categories and the gradual shift to more experiential/service-related purchases such as travel, sporting and cultural events as well as to dining out as pandemic-related health concerns hopefully diminish.
Figure 6. US Holiday Retail Sales: October–December (Yo2Y % Change) [caption id="attachment_140520" align="aligncenter" width="700"]
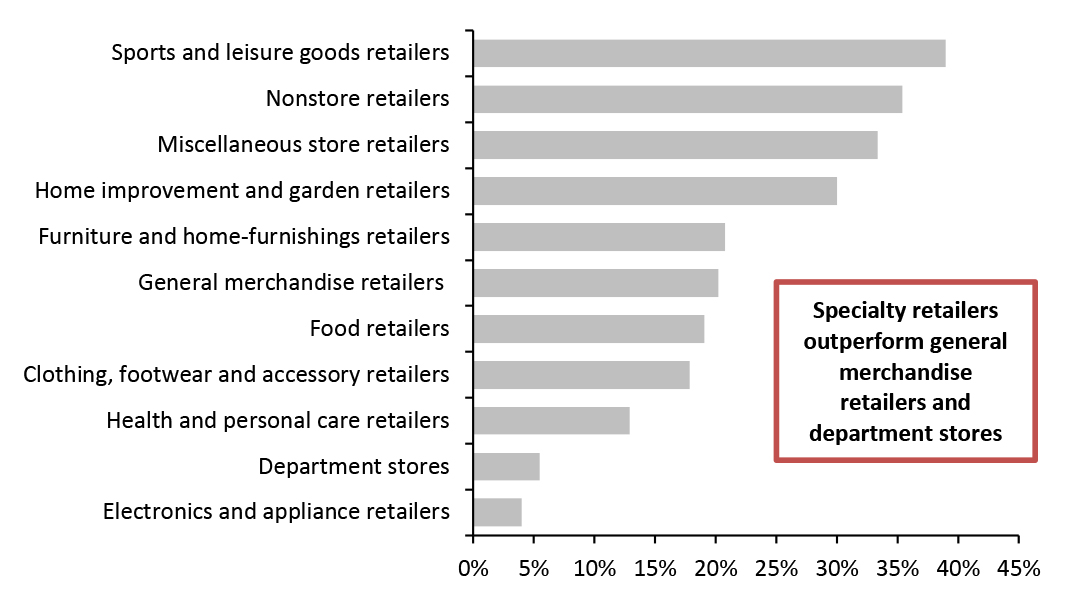 October, November and December combined
 Source: US Census Bureau/Coresight Research [/caption] 3. Traffic Traffic remained meaningfully down vs. 2019 with the two-year decline deepening between November and December, reflecting consolidation of shopping trips amid the spread of the Omicron variant. In the final quarter of 2021, shoppers avoiding shopping centers ended was at its second-highest level, while avoiding shops generally peaked in the last week of the quarter at 26.5%.
Figure 7. US Discretionary Retail Traffic, Shoppers Avoiding Shopping Centers [caption id="attachment_140533" align="aligncenter" width="700"]
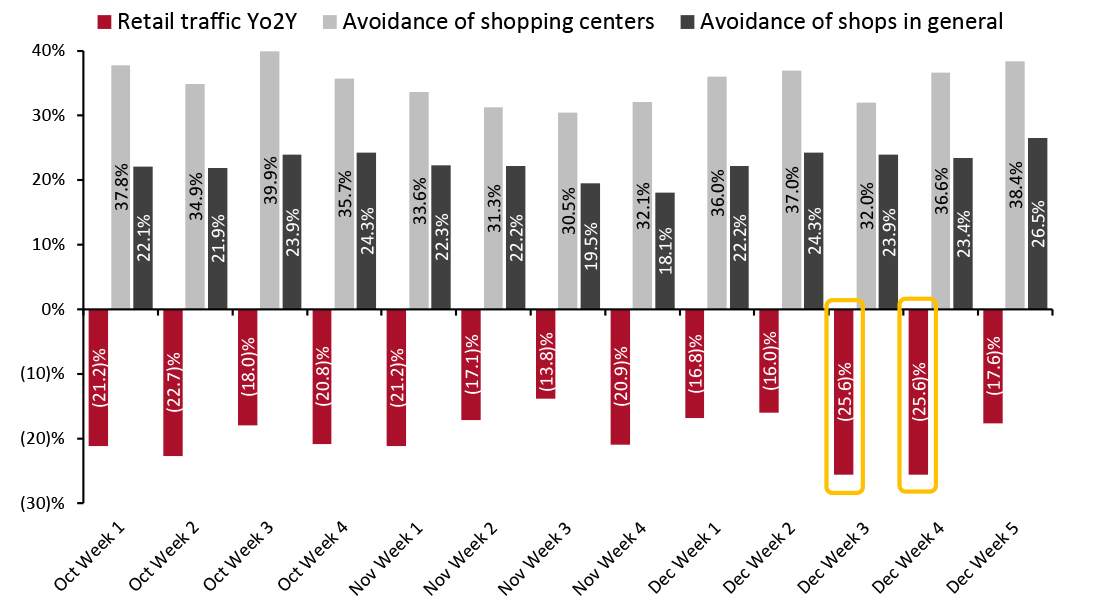 Traffic data represent discretionary/nonfood retail avoidance survey data as of Monday of each week, with charted data between October 4 (“Oct Week 1”) and December 27 (“Dec Week 5”)
 Source: RetailNext/Coresight Research [/caption] As traffic’s recovery weakened between November and December, average transaction value growth strengthened, reflecting a partial consolidation of shopping amid Omicron as represented in the ratio of store sales growth to traffic growth increasing. Traffic growth peaked in November, and, in tandem with total retail sales, year-over-year growth in store-based nonfood sales was strongest in November as Figure 5 below exhibits.
Figure 8. US Discretionary Retail Traffic, Average Transaction Value, Store-Based Sales Metrics [caption id="attachment_140522" align="aligncenter" width="700"]
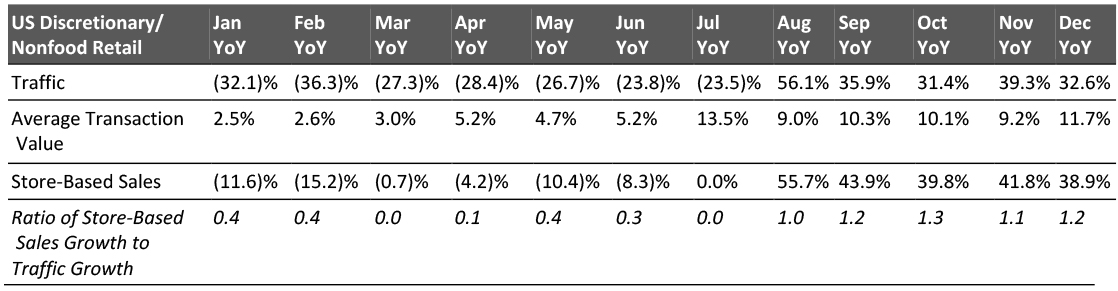 Data represent discretionary/nonfood retail. March, April, May, June and July 2021 numbers are compared to 2019 as stores began closing in March 2020 and most stores were closed in April, May, June and July 2020; March 2020 comps are for first two weeks only.
 Source: RetailNext/Coresight Research [/caption] 4. E-Commerce We estimate December was the weakest month of 2021 for online-only retailers, with an estimated ~18-PPT sequential deceleration vs. November on a two-year basis, suggesting that total e-commerce growth softened in December. This is despite signs of reduced traffic in physical stores and strong total retail sales growth in December. Shoppers likely continued to buy in stores, but consolidated their trips resulting in larger baskets along with slightly fewer visits. As with total retail sales and store-based retail sales, holiday-quarter online-only sales growth peaked in November.
Figure 9. US E-Commerce (Yo2Y % Change) [caption id="attachment_140523" align="aligncenter" width="700"]
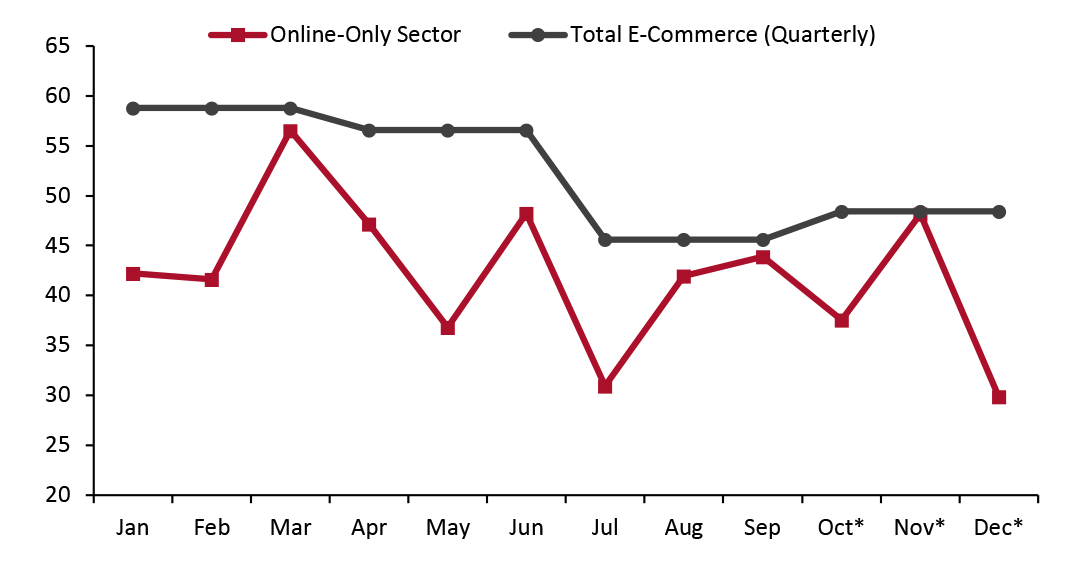 Oct-Dec total e-commerce is estimated; December is estimated for online-only
 Source: US Census Bureau/Coresight Research [/caption] 5. Selected Retailers Holiday Sales Comparisons Few retailers reported holiday sales; all reports are for double-digit comparisons. Chico’s, Citi Trends, Destination XL and Urban Outfitters reported two-year comparisons and the rest of the retailers reports comparisons on a single year-over-year basis.
Figure 10. Holiday Sales Comparisons by Retailer [wpdatatable id=1671 table_view=regular]
*Two-year comp, versus same period 2019 Source: Company reports 6. Holiday Returns According to a January 24, 2022, Coresight Research survey of US consumers, 33% of respondents intended to or already did return gifts, for the reasons cited in Figure 11. Product returns are a significant cost to retail, spanning lost sales, reduced profits, negative customer experience, potential loss of brand equity and a cause of increased carbon footprint. In our Sustainability Insights: The Hidden Costs of Retail Returns report, we discuss the top causes of retail returns, 73% of which could be avoided by retailer action. According to our January survey, 22.9% of returns this holiday were due to faulty damaged items, controllable by the retailer via quality, packaging, and delivery improvements, which in turn would improve sales, profits and customer experience. Not surprisingly, the top reason for returns is the wrong size, perhaps difficult for the gift giver to gauge.
Figure 11. Reasons for Holiday Returns [caption id="attachment_140524" align="aligncenter" width="700"]
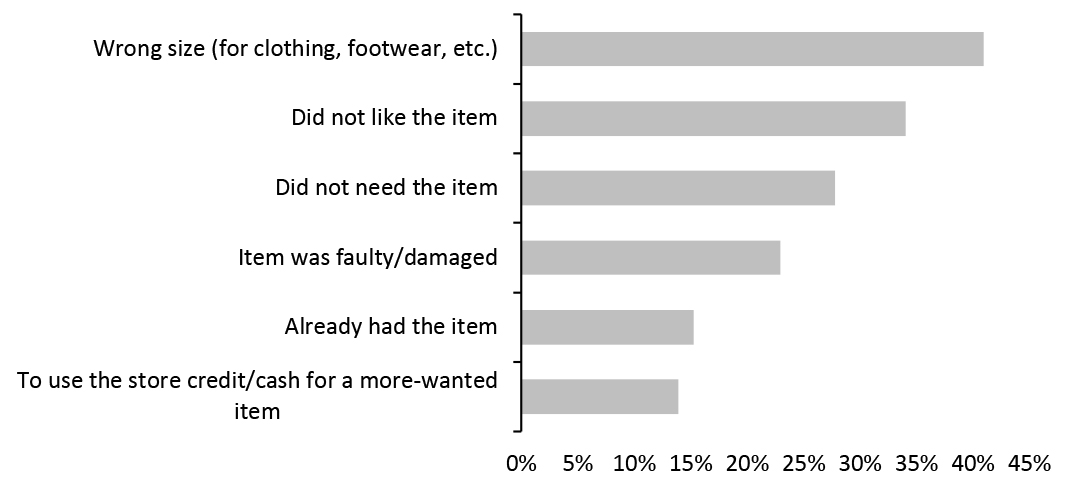 Consumers could select more than one option
 Base: US respondents aged 18+ who returned, or planned to return, items
Source: Coresight Research [/caption] We asked shoppers who intended to or already did return how many items they intended to or had returned; 70% of consumers expected to return three or fewer items, while 20% had five products or more to return.
Figure 12. Number of Holiday Gifts for Return [caption id="attachment_140525" align="aligncenter" width="700"]
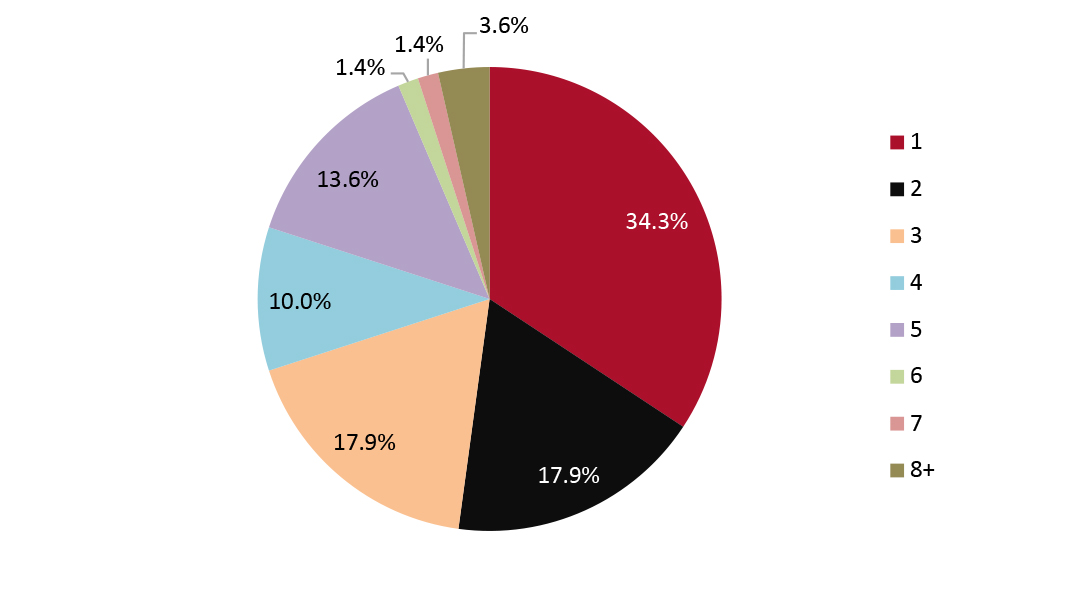 Base: US respondents aged 18+ who returned, or planned to return, items
 Source: Coresight Research [/caption] Not surprisingly, clothing, footwear and accessories were the most returned gifts this holiday, in part reflecting the category’s outsize growth relative to the season as well as the frequency of wrong sizes. Return intentions for this category were more than double any other category, with 48.6% ofsurvey respondents intending to return or having already returned apparel, accessories and footwear versus 23.6% of respondents that planned to/already had returned electronics, the second most returned category.
Figure 13. Types of Products, Holiday Gift Returns [caption id="attachment_140526" align="aligncenter" width="700"]
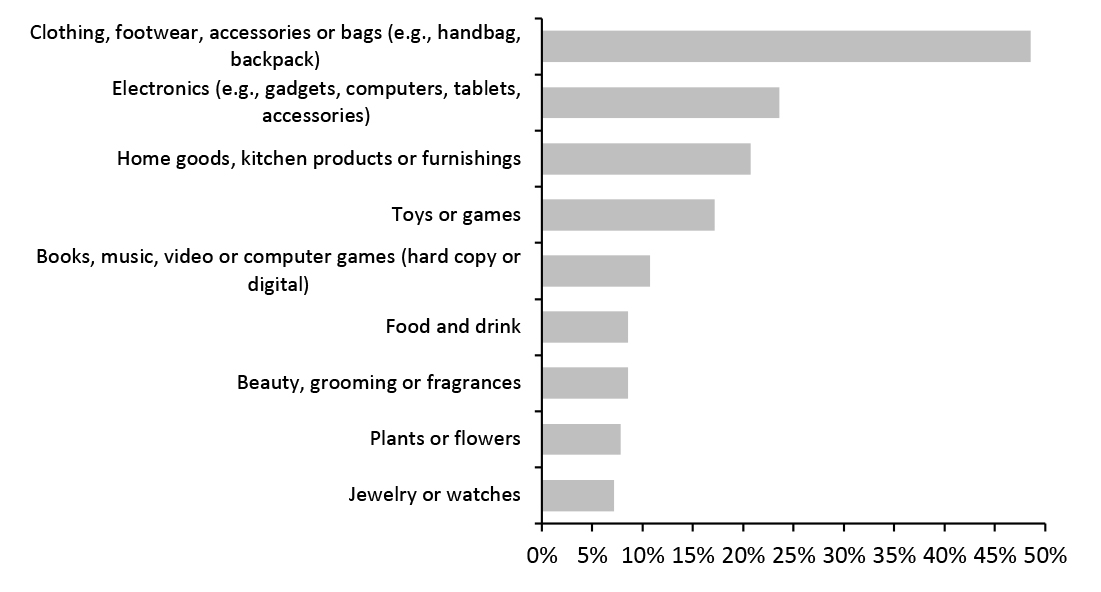 Base: US respondents aged 18+ who returned, or planned to return, items
 Source: Coresight Research [/caption] 7. The Impact of Covid-19 Nearly two years have passed since the pandemic arrived in the US, locked us down, closed our businesses, houses of worship, schools and towns, upended the global supply chain, canceled events, product launches and store openings, and brought about new behaviors, including the rapid adoption of ecommerce, buy online, pick up in-store (BOPIS), curbside pickup and Zooming into weddings, funerals, businesses and cocktail parties. In sum, Covid changed how we live, shop, socialize and shop, and this holiday most retailers made out well as high demand along with tight inventory diminished the need for promotional pricing to drive sales. Higher prices were a significant driver of the season’s double-digit sales gain. 8. Revitalization of Physical Retail The Covid-19 pandemic has prompted a reconsideration of the value of the physical store by consumers and retailers alike.
- For retailers, stores became important in the fulfillment of online orders as local distribution centers, including through BOPIS and ship-from-store services.
- For brands, stores are the backdrop for the full expression of a brand from scent to merchandising to services and products.
- With consumers gradually feeling more comfortable returning to stores through 2021, the brick-and-mortar channel has become a social destination as the place to discover, see and test products, as well as a means to makes purchase and returns.