
albert Chan
Holiday 2019 Outlook
This holiday season presents mixed prospects for US retail: Trade concerns and hints of a recession, coupled with sporadic weakness in retail sales so far this year, are headwinds as we head toward retail’s peak period. At the same time, retail demand appears to have strengthened in the most recent months, and a number of consumer economy metrics look set to support shopper demand.
In this report, we provide our estimates for US retail growth and review the context for holiday trading.
Given retail’s recent solid performance, we estimate a 4.0% year-over-year increase in total US retail sales (ex autos and gasoline) for November and December. This updates our expectations outlined in our earlier Holiday 2019 Retail Outlook Preview, which included our provisional estimate of a 3.5-4.0% rise. We believe a relatively strong macro environment with a positive impact from lower gas prices will support stronger sales than previously estimated.
Last year, November and December retail sales reached $686 billion, reflecting a 10-year CAGR of 3.4%. 2018 saw soft sales growth of 2.1% during the November-December holiday season, and we expect accelerated growth this year against those undemanding comparatives.
From January to August 2019, retail sales expanded 3.6% year over year. We saw total retail sales increase 4.7% in August, after a strong 5.6% increase in July.
[caption id="attachment_97261" align="aligncenter" width="700"]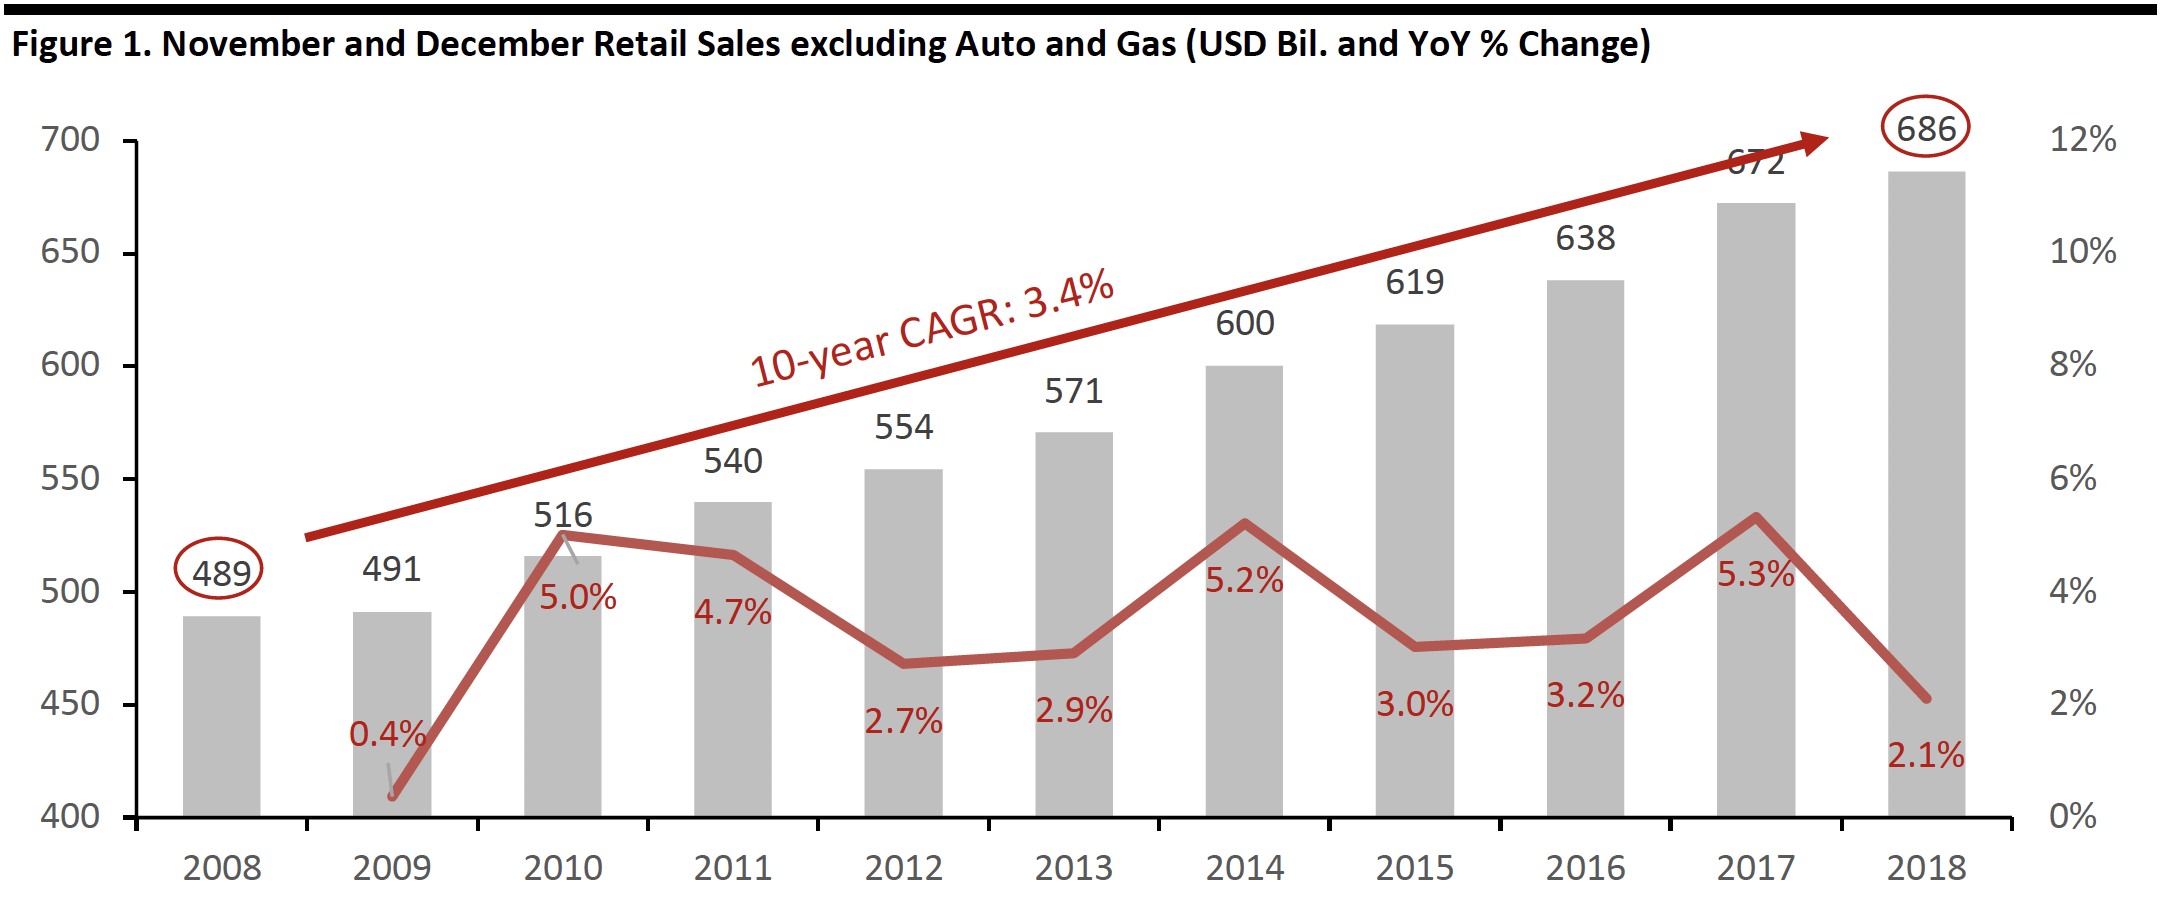 Source: US Census Bureau/Coresight Research[/caption]
[caption id="attachment_97262" align="aligncenter" width="700"]
Source: US Census Bureau/Coresight Research[/caption]
[caption id="attachment_97262" align="aligncenter" width="700"]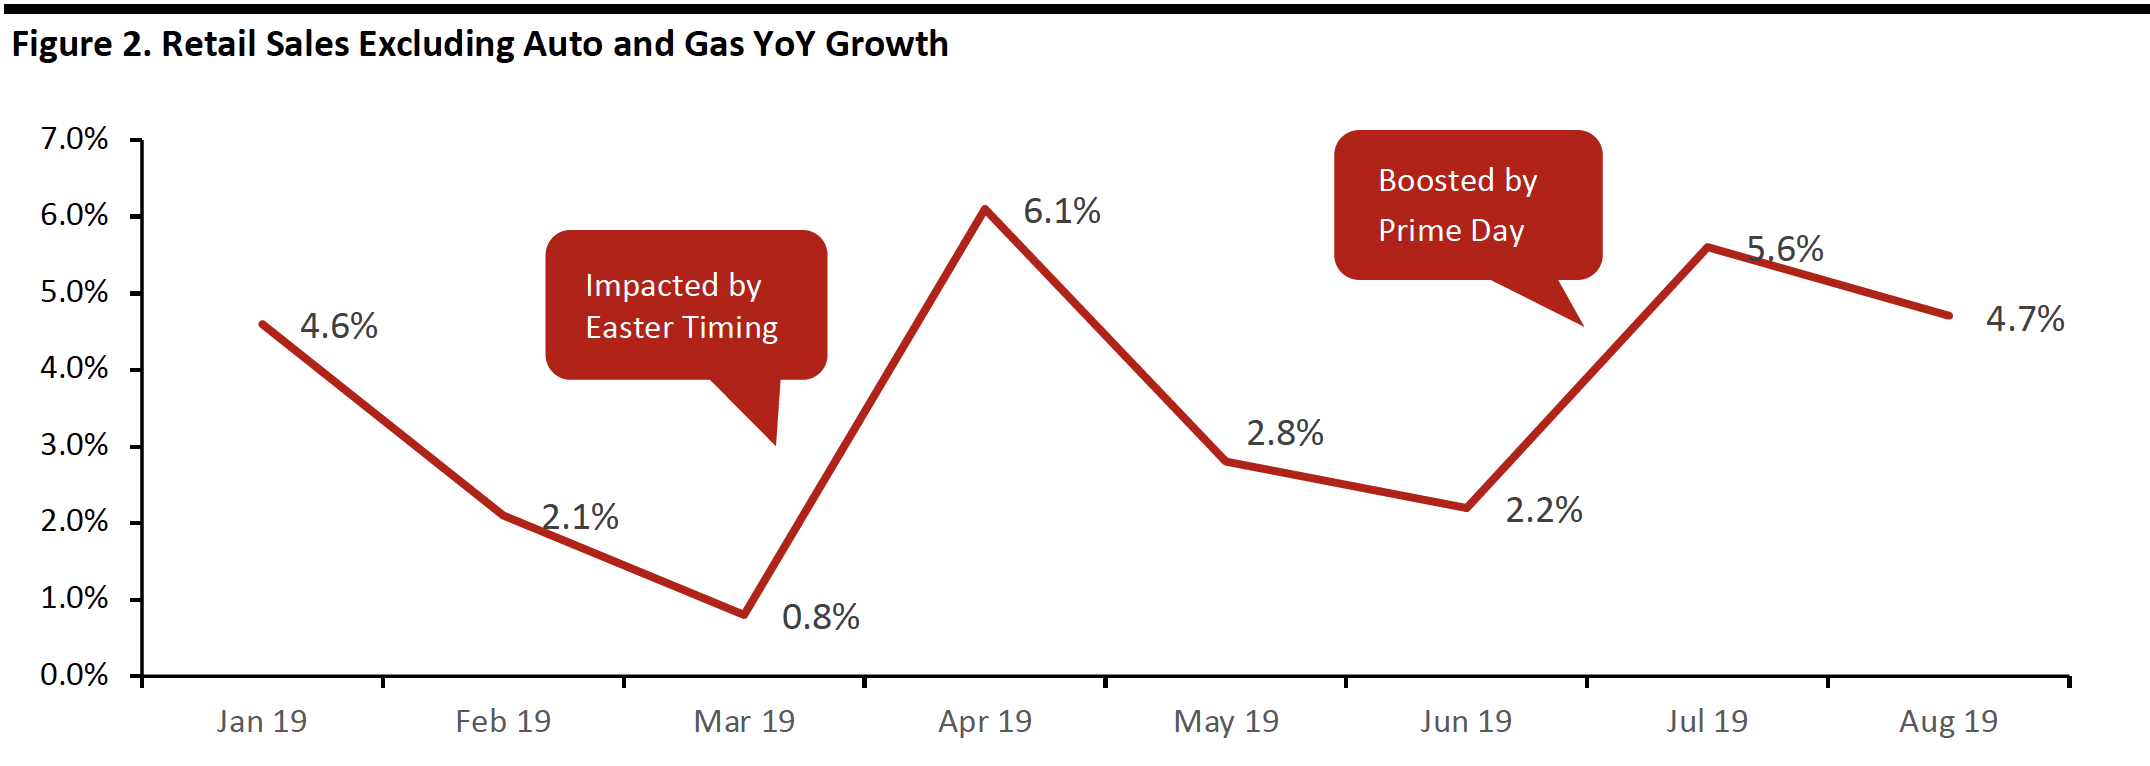 Source: US Census Bureau/Coresight Research[/caption]
Retail sales for the three months through August were up 4.1% year over year. For the prior rolling three-month period (May, June, July), sales expanded 3.4%. The growth was slower than the same period in 2018, but has been accelerating since February. We expect the momentum to continue for the holiday period.
[caption id="attachment_97263" align="aligncenter" width="700"]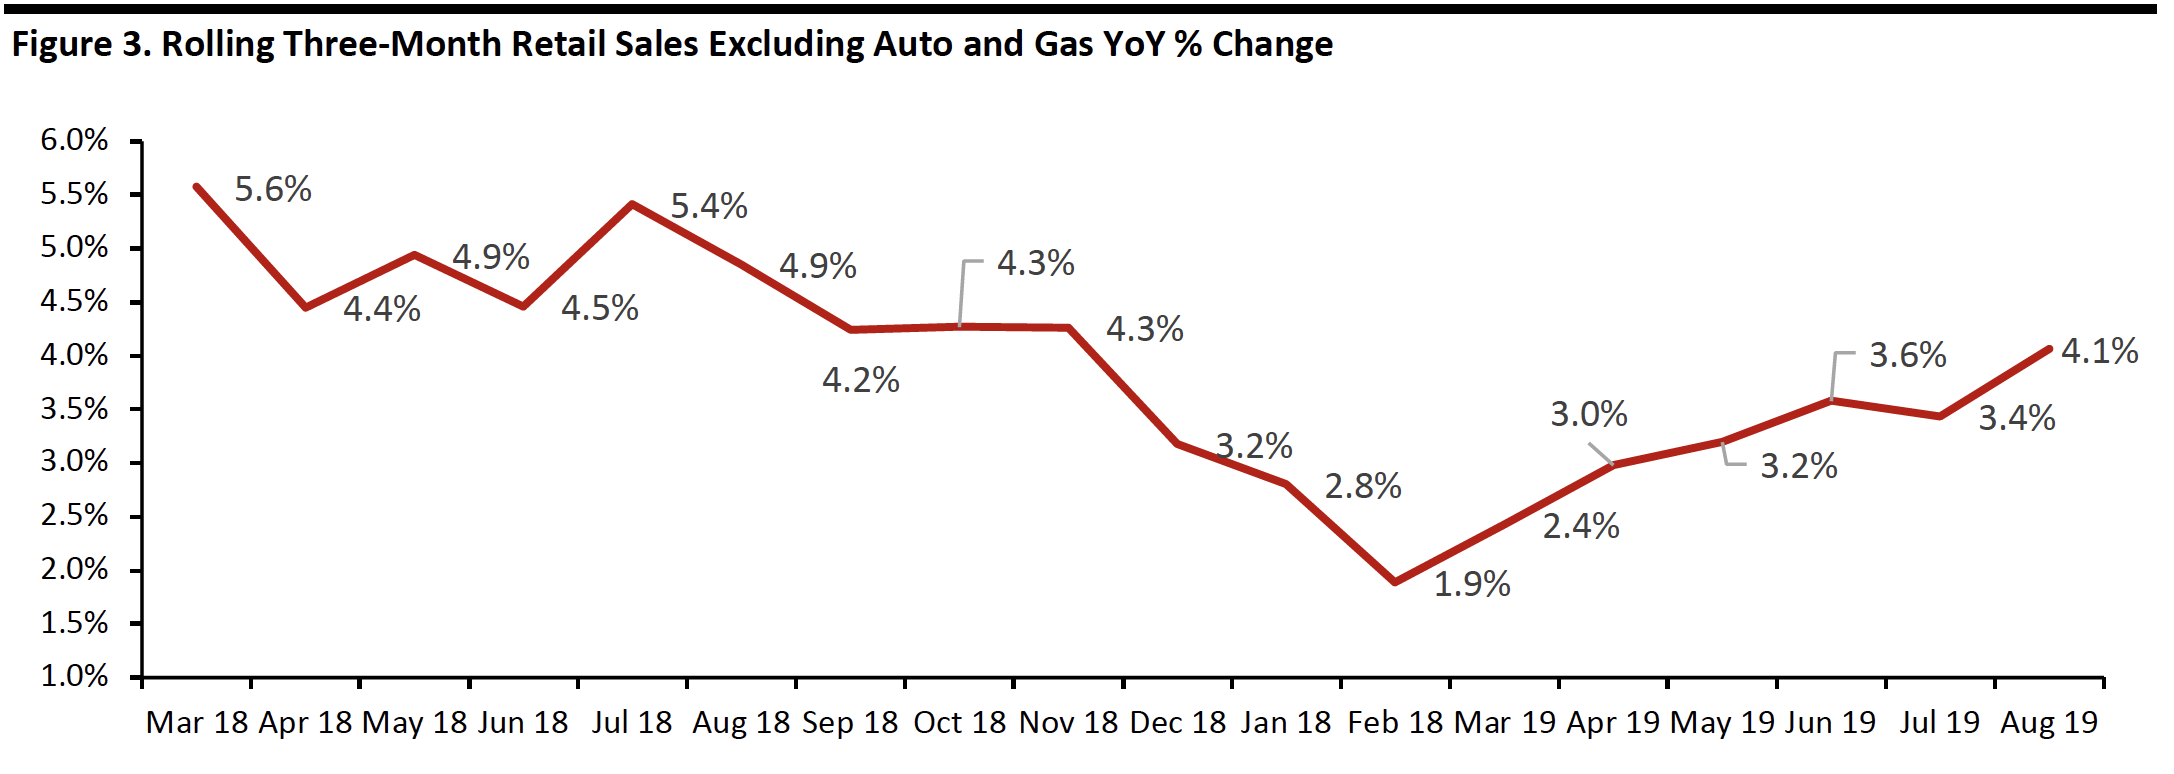 Source: US Census Bureau/Coresight Research[/caption]
Online Estimated to Capture 23% of Nonfood Sales
We estimate e-commerce will account for 17.6% of all retail sales in the holiday quarter, up 160 basis points year over year. A low e-commerce penetration rate for food pulls down this total: We expect to see slightly more than 23% of all nonfood retail sales go online this holiday season, up around 200 basis points from last year’s estimated share of 21.2%.
[caption id="attachment_97264" align="aligncenter" width="704"]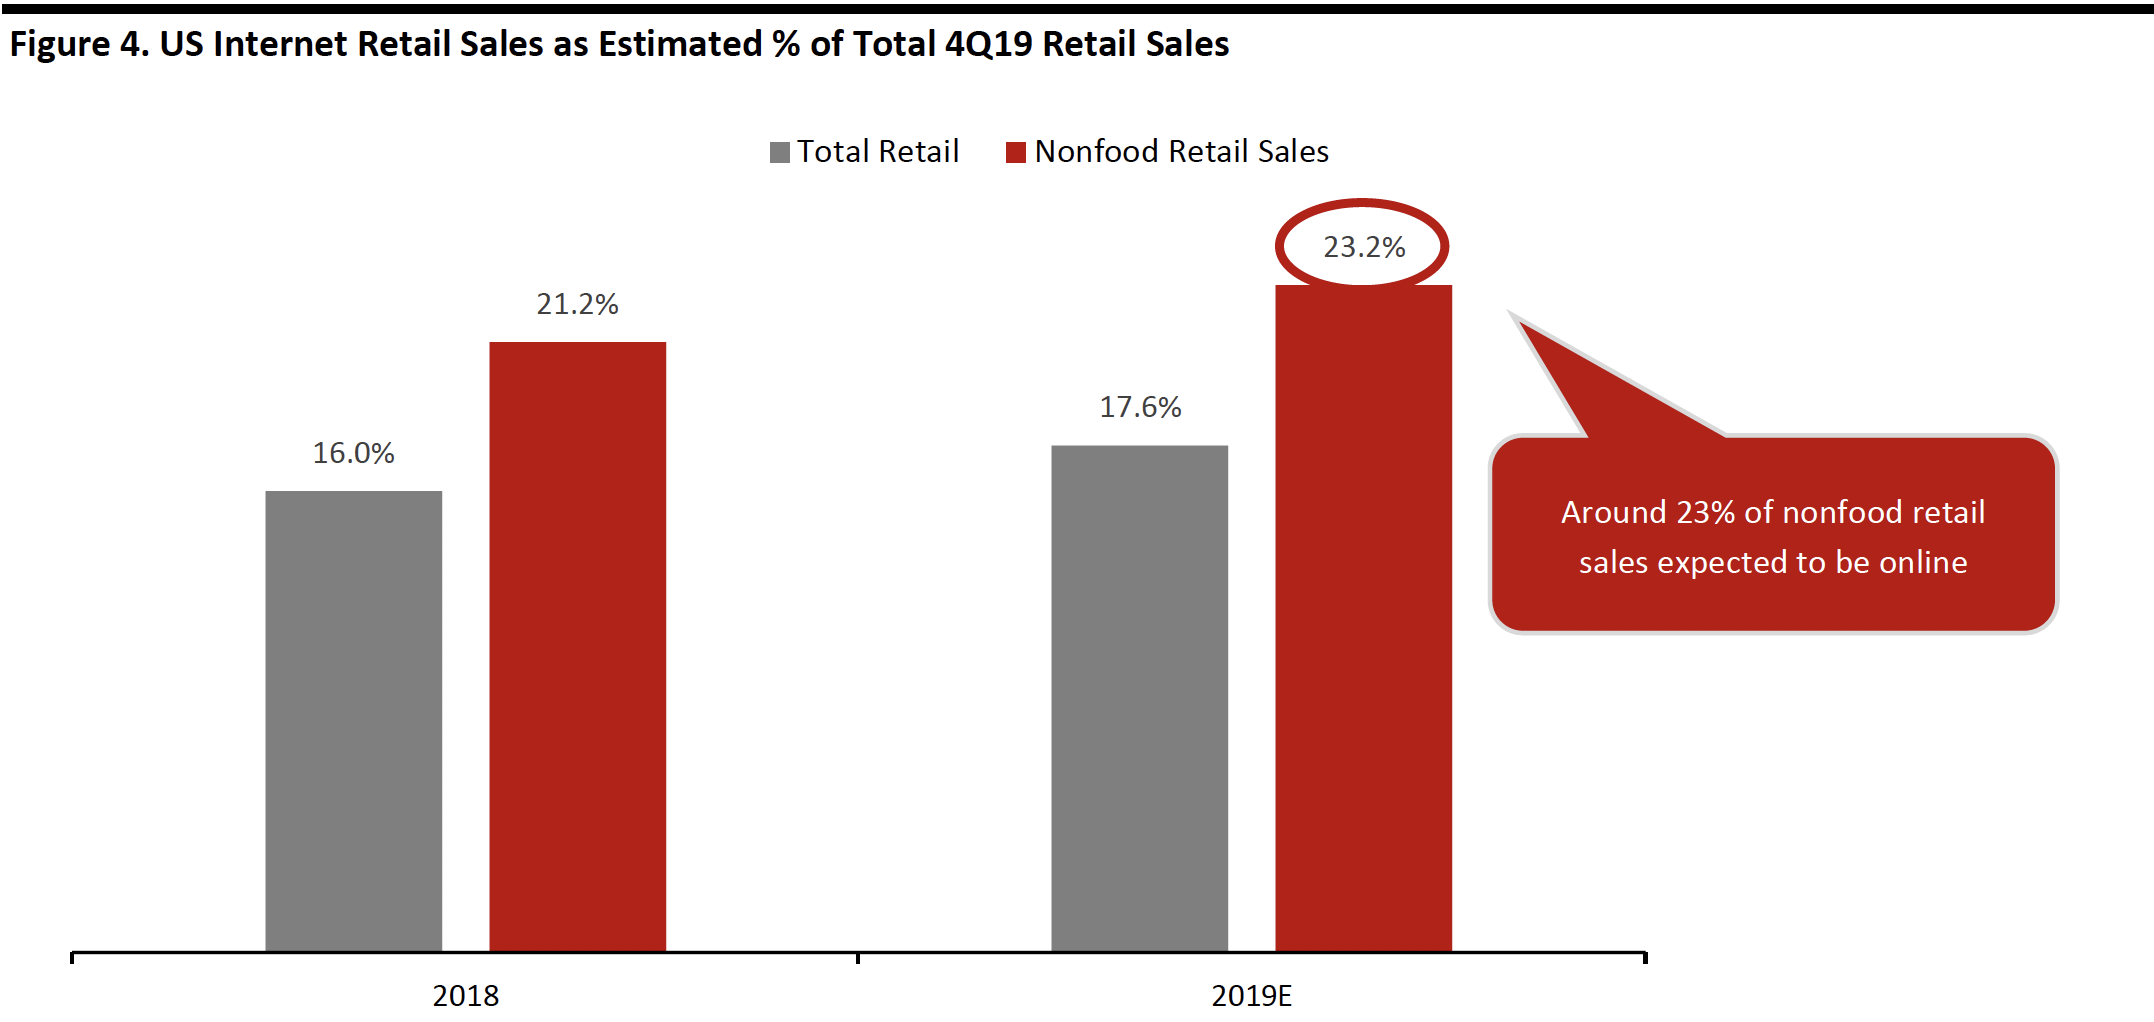 Source: US Census Bureau/Coresight Research[/caption]
Infinite Availability Impacts Holiday Retail Sales in Selected Categories
New business models and distribution channels have re-shaped consumers’ shopping behavior. We see the ongoing trend of holiday shopping becoming less important to key retailers: The season accounted for almost 24% of all sales in the late 1990s, but has slowly but steadily slipped to 21% and we expect that trend to continue.
To gauge the impact of 24/7 shopping and purchasing online on the holiday retail selling calendar, we reviewed retail sales from the holiday period (November and December) as a percentage of annual retail sales. We focused our analysis on selected major nonfood sectors: Electronics, clothing and accessories, sporting goods, hobby, musical instruments and books, and general merchandise stores are traditional retail destinations for holiday purchases.
We found that the percentage accounted for by the holiday season dropped 270 bps to 21.0% in 2018. The ease and convenience of Internet shopping has consumers taking advantage of shopping holidays throughout the year and spreading out holiday shopping.
[caption id="attachment_97265" align="aligncenter" width="703"]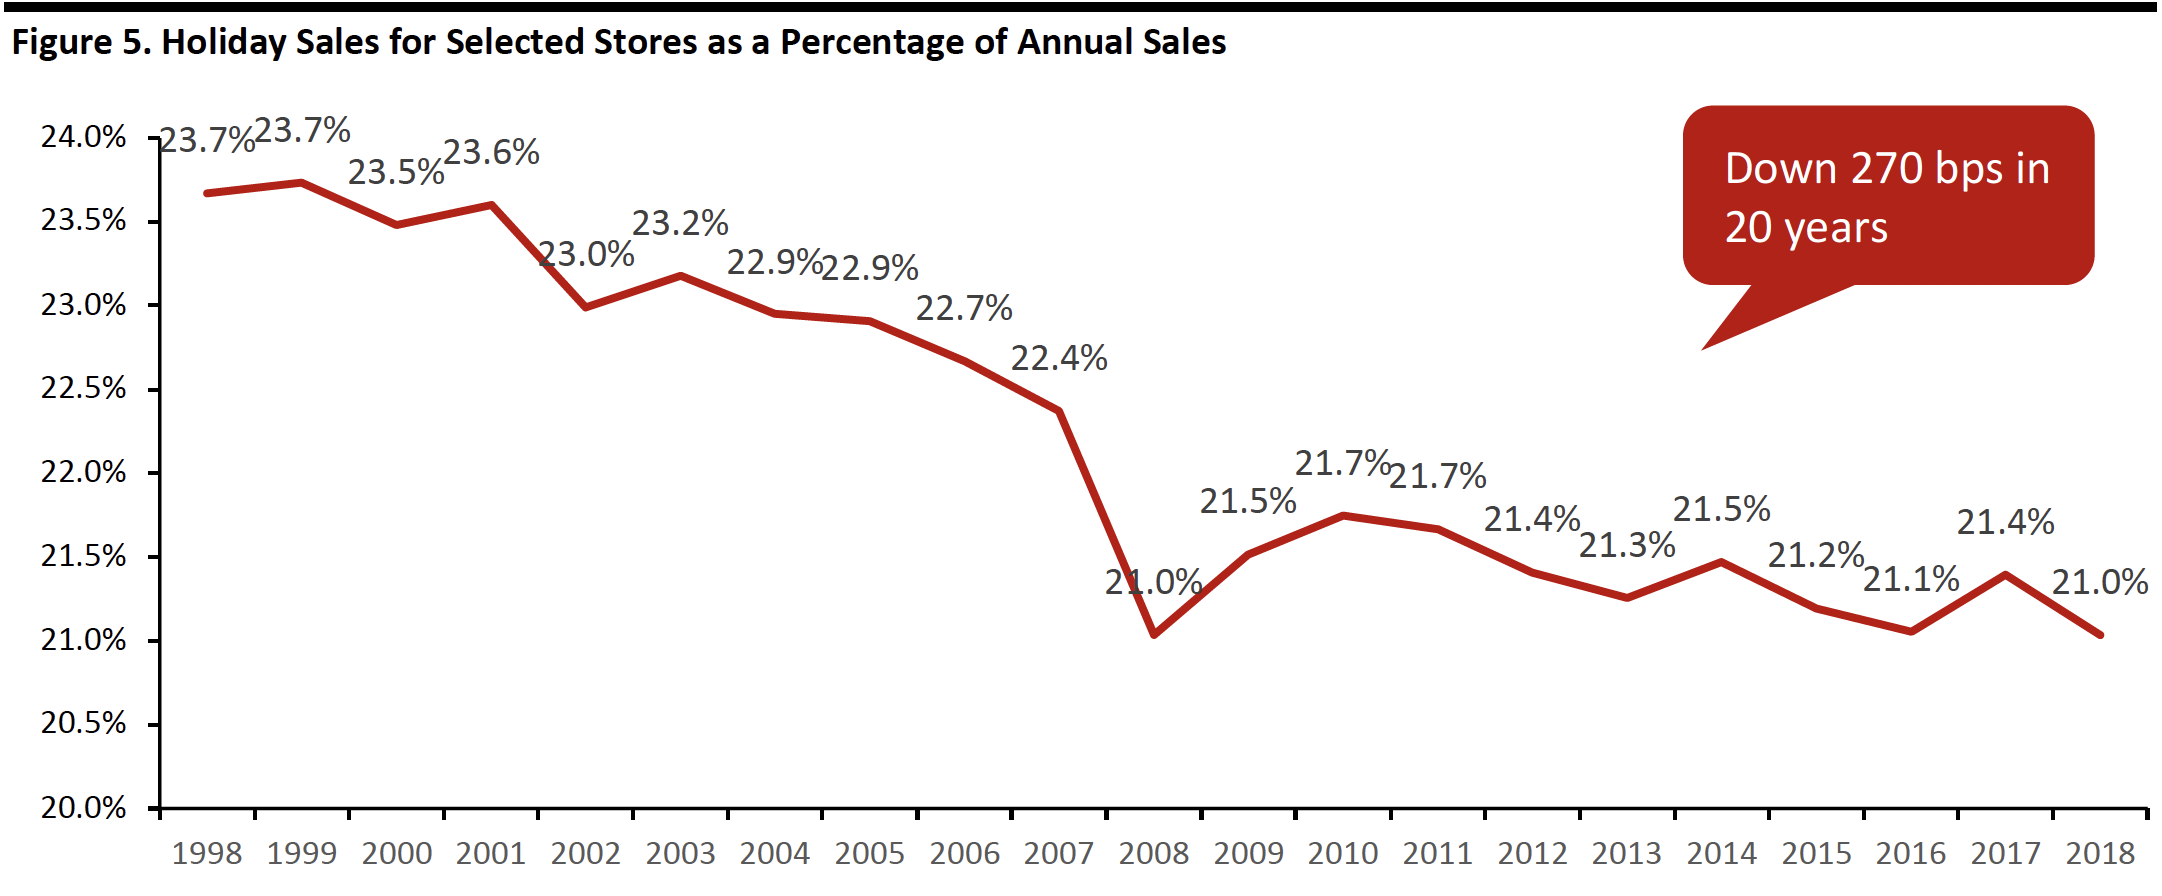 Holiday retail sales for Electronics, Clothing and accessories, Sporting goods, hobby, musical instrument and book, and General merchandise stores.
Source: US Census Bureau/Coresight Research[/caption]
Holiday sales for jewelry stores have dropped the most as a share of annual sales, falling 670 bps to 26.7%. Department store holiday sales as a share of annual sales dropped by only 80 bps to 23.8%, while the share for electronics and appliance store declined the least, by 50 bps to 22.1%.
[caption id="attachment_97266" align="aligncenter" width="701"]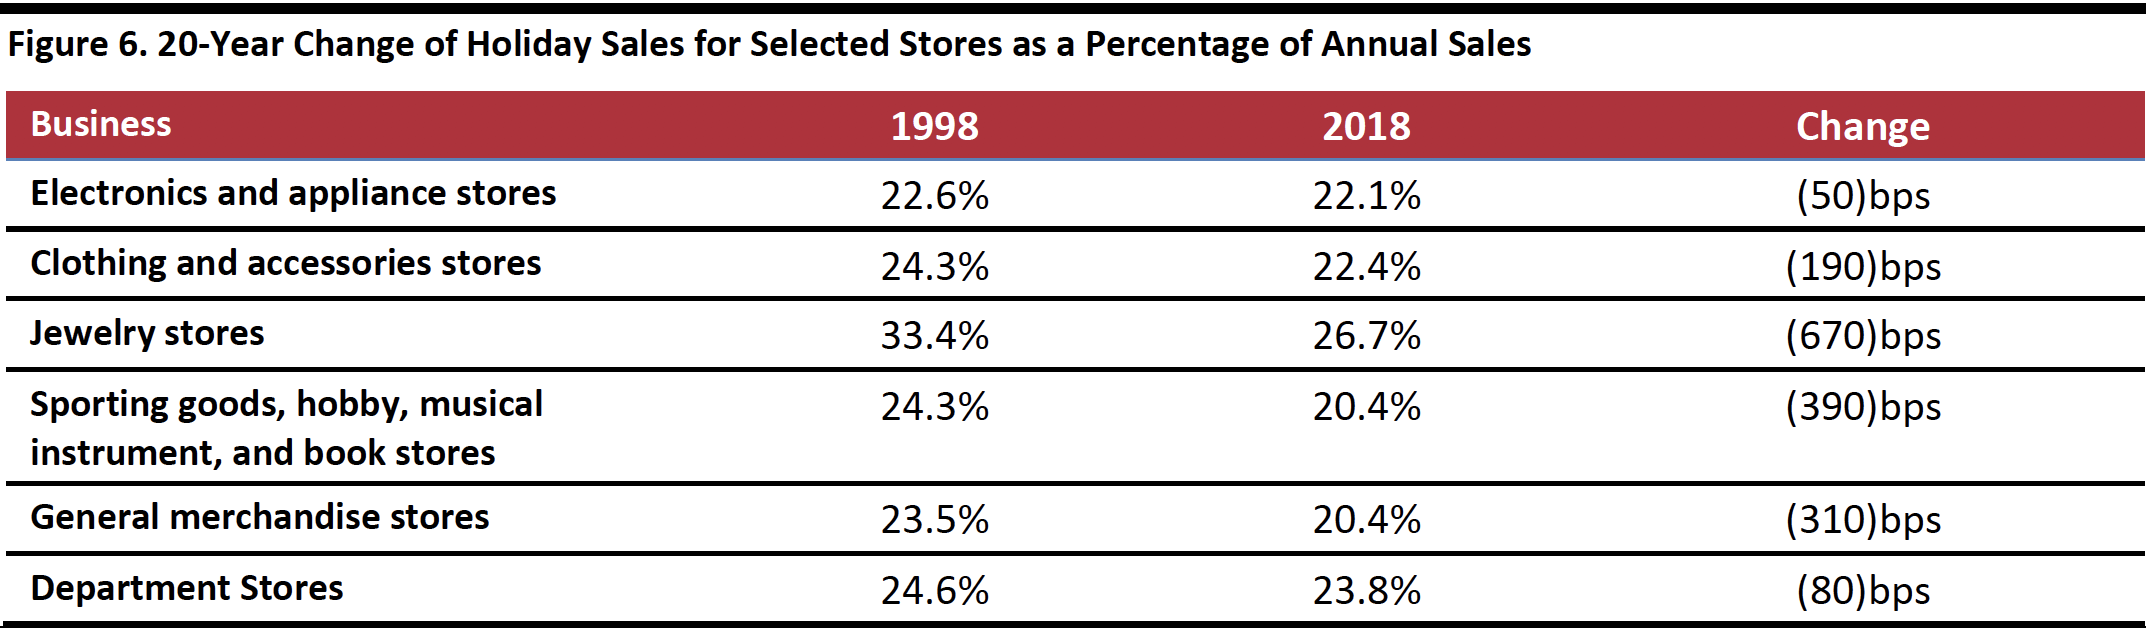 Source: US Census Bureau/Coresight Research[/caption]
Economic Backdrop
A steady economic backdrop frames this year’s holiday shopping season. Higher wage growth and lower gas prices point to the potential for higher sales.
On September 14, Saudi Arabian oil producer Aramco’s crude processing plants were attacked, driving a record spike in oil prices. But the company reported faster than expected recovery, stabilizing oil prices. Although average gas price per gallon of $2.66 is slightly higher than the $2.57 we witnessed in early September, it is still down 6.7% year over year, putting more discretionary dollars in consumers’ wallets.
Personal consumption expenditures (PCE) on gasoline and other energy goods was $79.7 billion, seasonally adjusted, in 4Q18, according to the US Bureau of Economic Analysis. The average gas price in 4Q18 was $2.70 per gallon and the American Automobile Association forecasts the national average will drop to $2.40 or lower this fall, 11.1% cheaper than the $2.70 average in 2018.
Assuming an 11.1% decrease in gas prices and an 8.1% saving rate for 4Q19, consumers should have an additional $8.1 billion discretionary funds available to drive increased holiday spending. We estimate lower gas prices alone could account for 50 basis points of incremental growth this holiday season.
[caption id="attachment_97267" align="aligncenter" width="700"]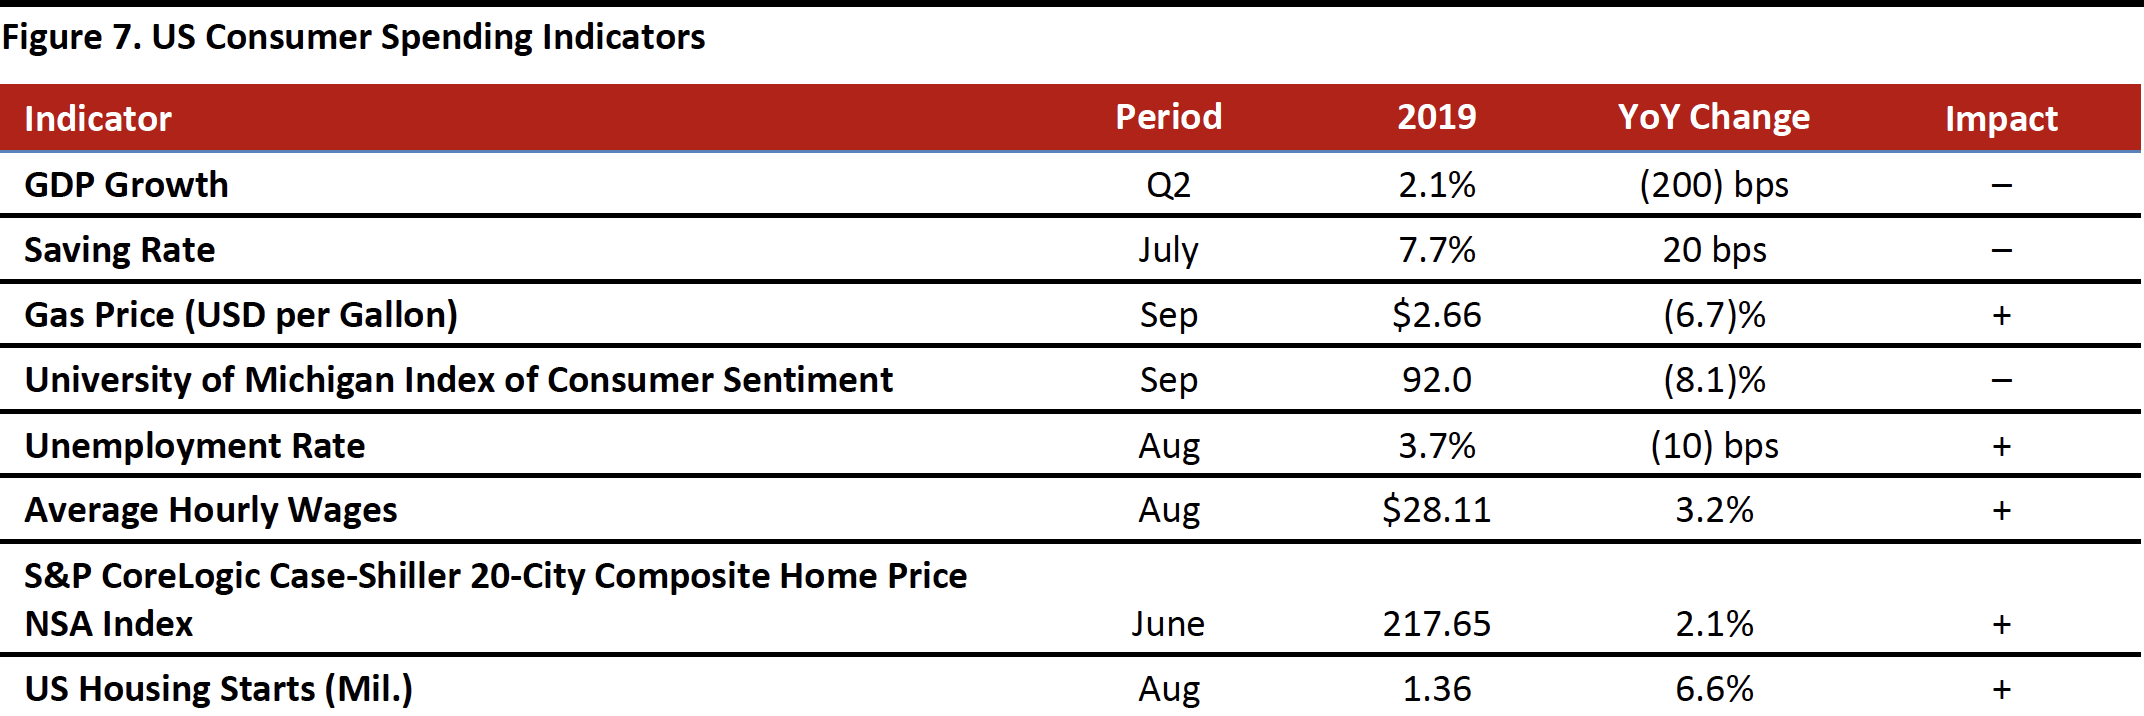 Source: US Bureau of Economic Analysis/US Department of Labor Statistics/S&P Global/University of Michigan/Federation of Tax Administrators/Coresight Research[/caption]
Consumer confidence has shown greater volatility since the escalation of the US-China trade conflict.
- On July 13, President Trump postponed tariffs on some consumer goods imported from China, including cell phones, toys and video game consoles, until December 15. Meanwhile, China retaliated with tariffs on $75 billion of US goods in two batches effective September 1 and December 15.
- In August, the Consumer Sentiment Index declined to 92.1 from July’s 98.4, reflecting rising concern of a recession. In September, the index continued to drop to 92.0.
- With Congress announcing a formal impeachment inquiry of President Trump on September 24, we expect more uncertainty in politics and headwinds for consumer sentiment. Moreover, this type of poticial news could direct consumers’ attention toward the ongoing political diague and away from purchase considerations despite of the upcoming shopping holiday.
However, at 92.0 in September, the Consumer Sentiment Index reading compares with a 10-year average of 84.5.
[caption id="attachment_97268" align="aligncenter" width="700"]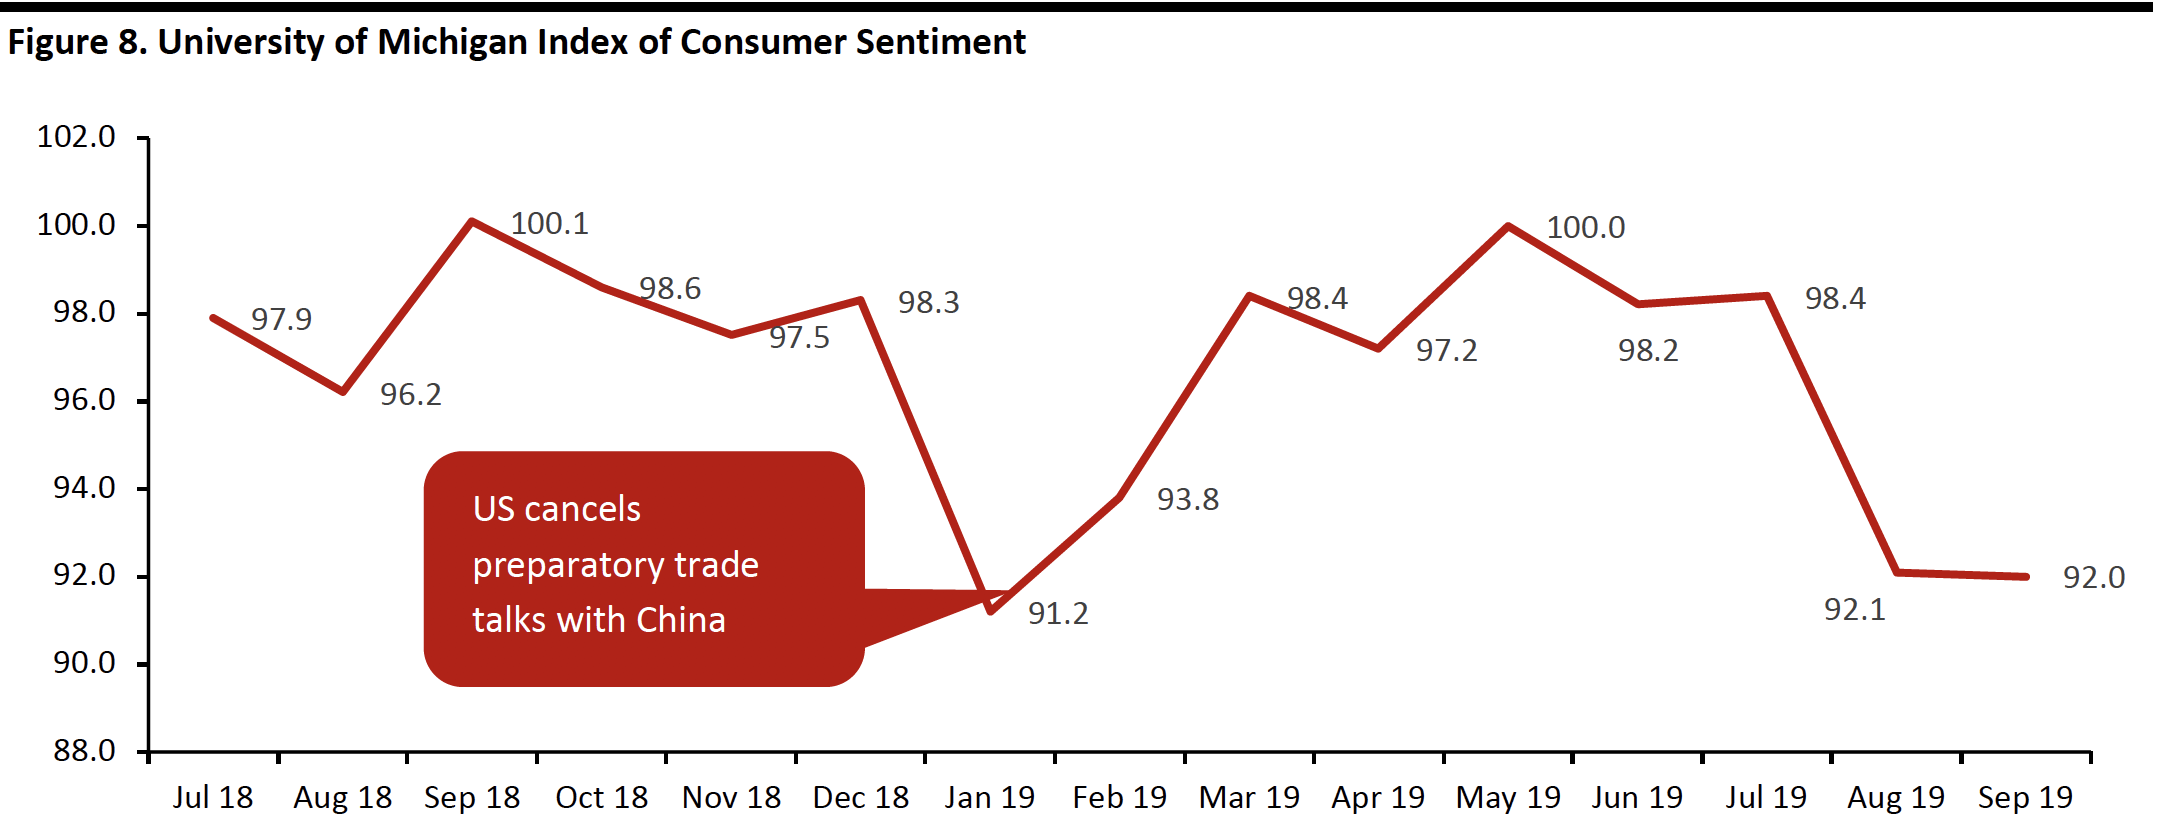 Source: University of Michigan/Coresight Research[/caption]
Spending Plans
According to a Prosper Insights & Analytics survey of spending intentions for the December holiday season, 8.1% of those surveyed plan to spend more, down 160 bps year over year. But the survey also recorded an increase in the percentage of those planning to spend the same (38.4% up from 37.7%), and fewer intending to spend less (19.9% from 21.2%, down 130 bps). In total, the combined intent is a positive. The increase in the percentage not celebrating the holiday, up 190 bps to 8.7%, is a trend we will be watching in future years.
[caption id="attachment_97269" align="aligncenter" width="700"]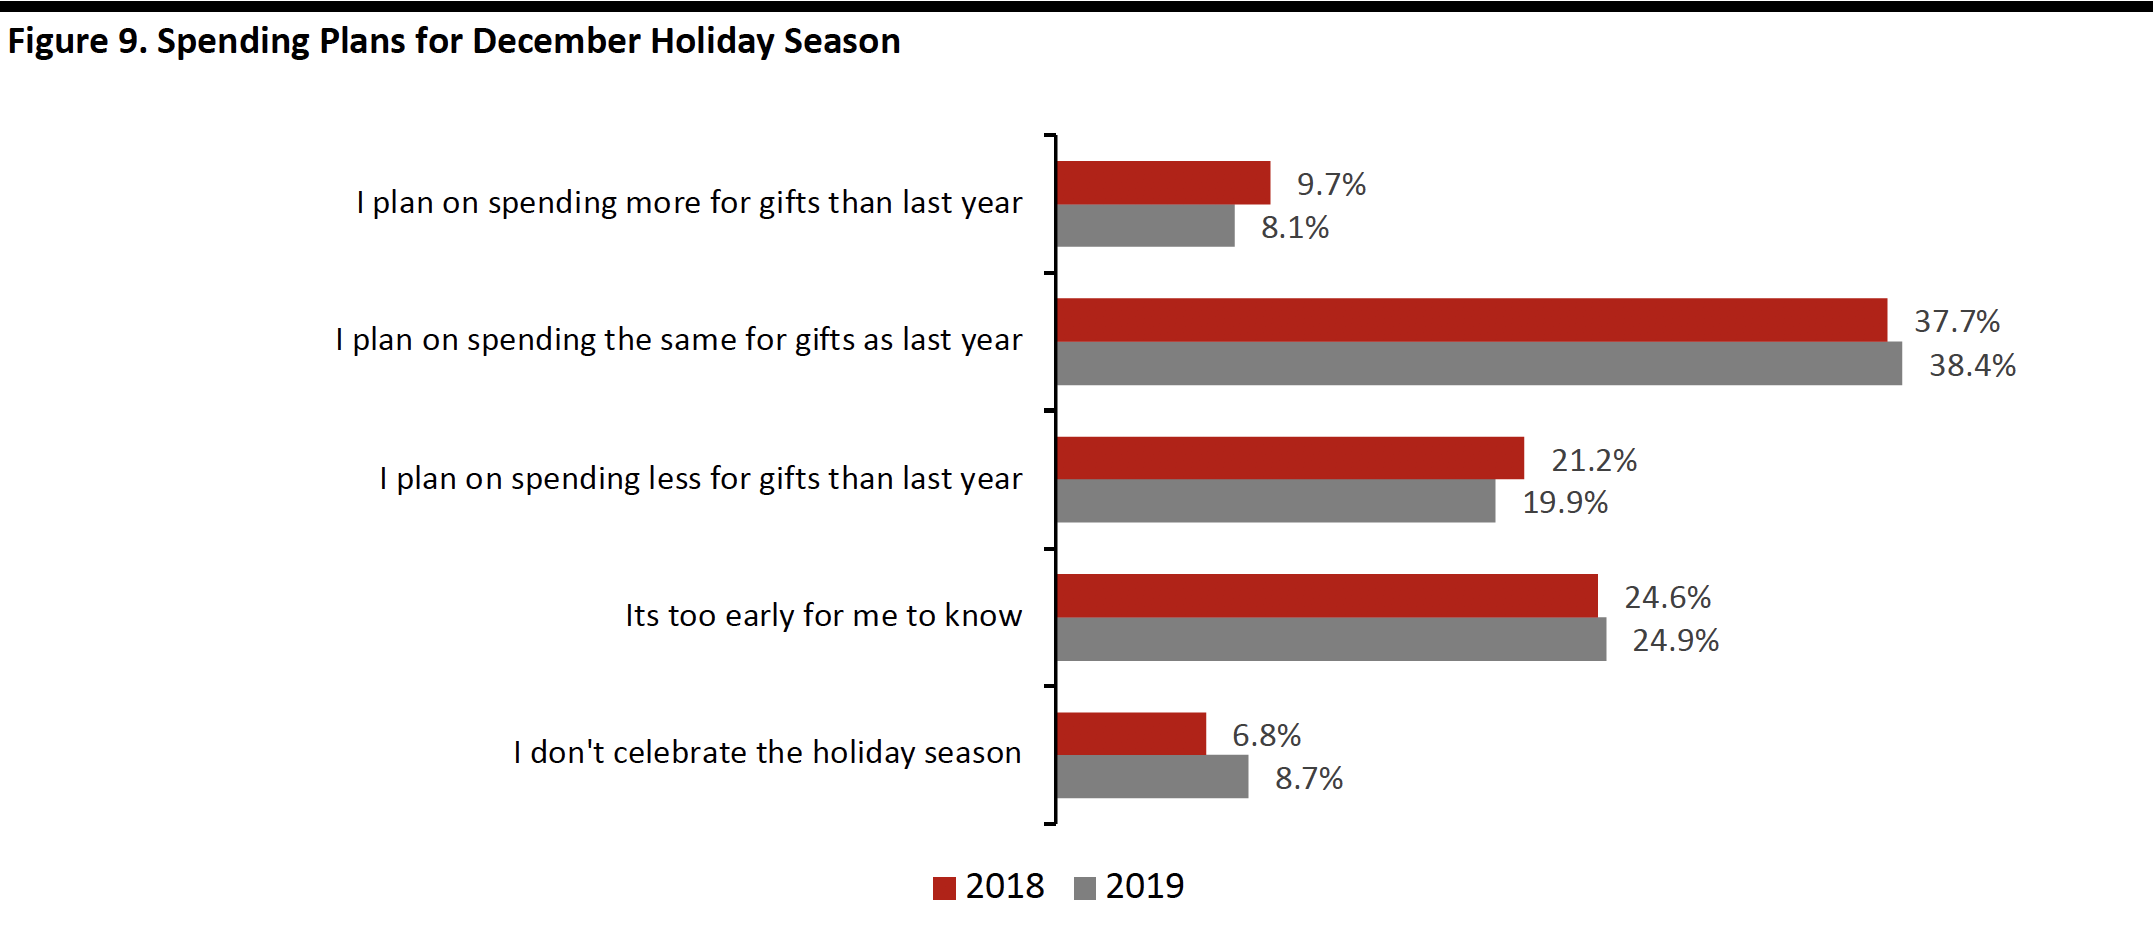 Base: 7,660 US consumers aged 18+ in July 2019
Source: Prosper Insights & Analytics[/caption]
2019 Holiday Calendar
This year Thanksgiving is late, on November 28, giving six fewer days between Thanksgiving and Christmas than in 2018 – and the shortest possible holiday calendar, which is not ideal. However, a shortened calendar can be a boost to both sales and profits for some retailers as it can drive more last-minute shopping – a situation that lowers price sensitivity.
Cyber Monday and Giving Tuesday fall in early December.
A late start to Chanukah (December 22 through December 30) such that it overlaps Christmas, along with the truncated calendar, will likely have retailers nervous about daily receipts and could lead to heightened promotional offers as the season progresses.
[caption id="attachment_97270" align="aligncenter" width="700"]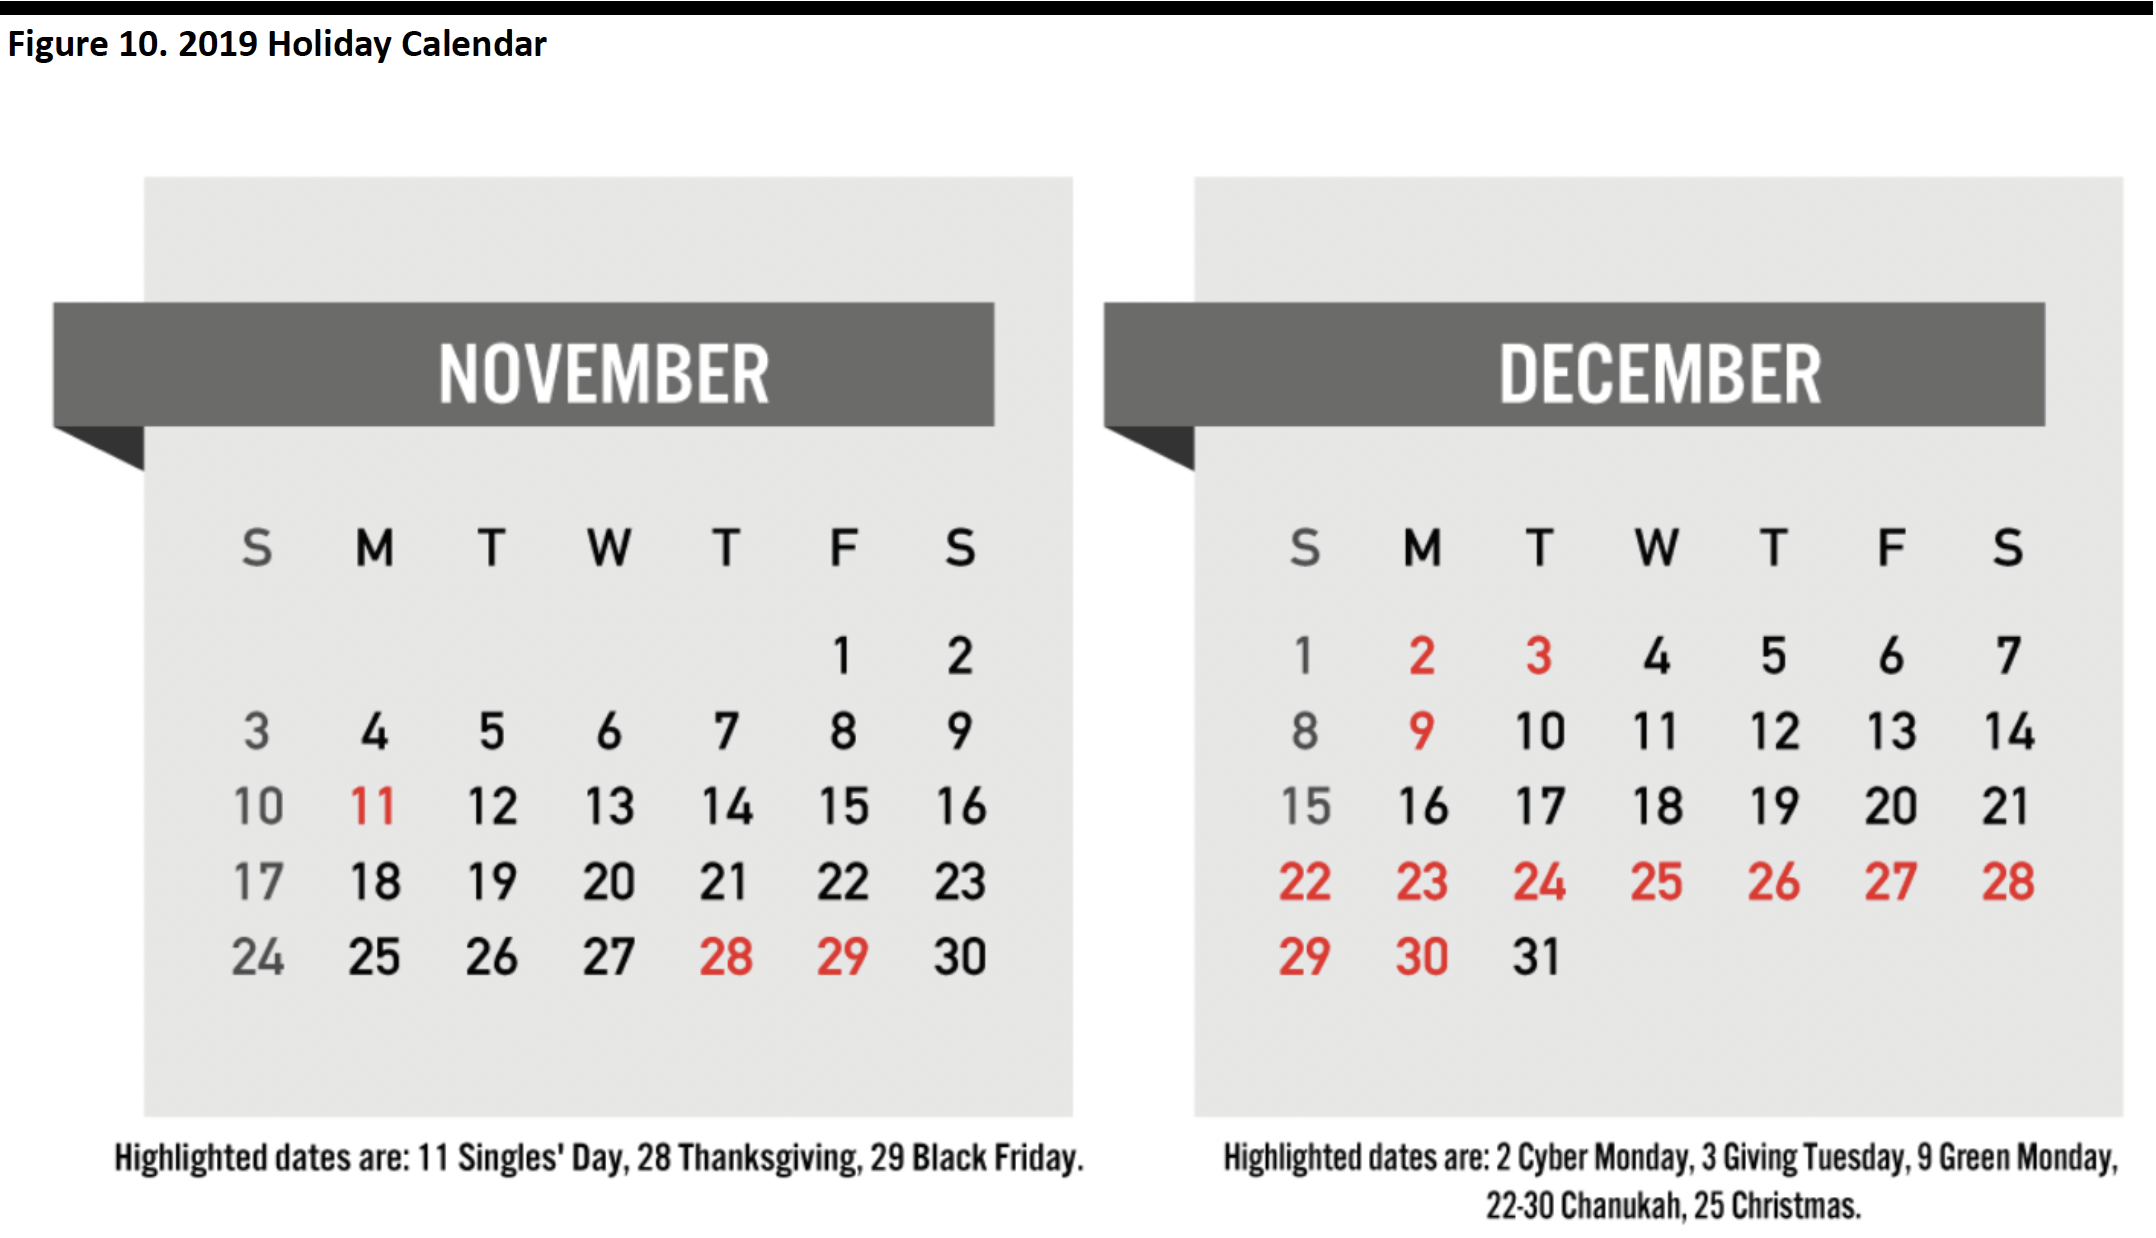 Source: Coresight Research[/caption]
Upcoming Holiday Shopping Reports
Keep an eye out for further reports on the 2019 holiday shopping series in the coming weeks.