
DIpil Das
Introduction
What’s the Story? As part of our Head-to-Head series, we provide a comparison of the two largest players in the US off-price sector: Ross Stores, comprising the Ross Dress for Less (known as Ross) and dd’s Discounts banners; and TJX Marmaxx, comprising the Marshalls, T.J. Maxx and Sierra banners. Note: For the purposes of comparison in this report, we refer to fiscal 2021 as the year ended January 30, 2022, although The TJX Companies refers to this year as fiscal 2022 in its reports. Why It Matters The off-price sector is one of the few retail sectors that had been consistently growing in both revenue and physical store fleets in the 10 years prior to the Covid-19 pandemic. The sector grew at a CAGR of 8.4% between fiscal 2010 and fiscal 2019, from $29.2 billion to $60.5 billion, with each major off-price retailer showing positive sales growth every year. The sector declined by 22.2% due to the pandemic in fiscal 2020, totaling $47.1 billion, but this reflects stronger resilience than most sectors, and off-price rebounded dramatically in fiscal 2021 to $71.5 billion (51.7% year-over-year growth). Unlike other retail sectors, off-price continues to focus on physical stores rather than e-commerce. The sector has expanded dramatically, from 3,693 stores in fiscal 2010 to 6,388 stores in fiscal 2021, we calculate—an average of 245 store openings per year.- Read more about the overall sector in our separate report, US Off-Price Retail: Strategies in the Physical and Digital Channels.
Ross Stores vs. TJX Marmaxx: Coresight Research Analysis
Business Overview Ross Stores and TJX Marmaxx offer apparel, accessories, footwear and home products. We provide a comparison of key facts and top-line figures for each company in Figure 1, which highlight three notable differences:- Pricing—Ross Stores’ merchandise is priced lower.
- E-commerce—TJX Marmaxx banners offer e-commerce, but Ross Stores does not currently operate online. TJX reported that e-commerce sales at Marmaxx in fiscal 2020 were approximately 3% of its total sales, totaling $770 million.
- Supply chain—TJX Marmaxx has far more global vendors than Ross Stores, through which it sources its products, and its own private-label brands.
Figure 1. Company Overviews: Ross Stores vs. TJX Marmaxx [caption id="attachment_144999" align="aligncenter" width="700"]
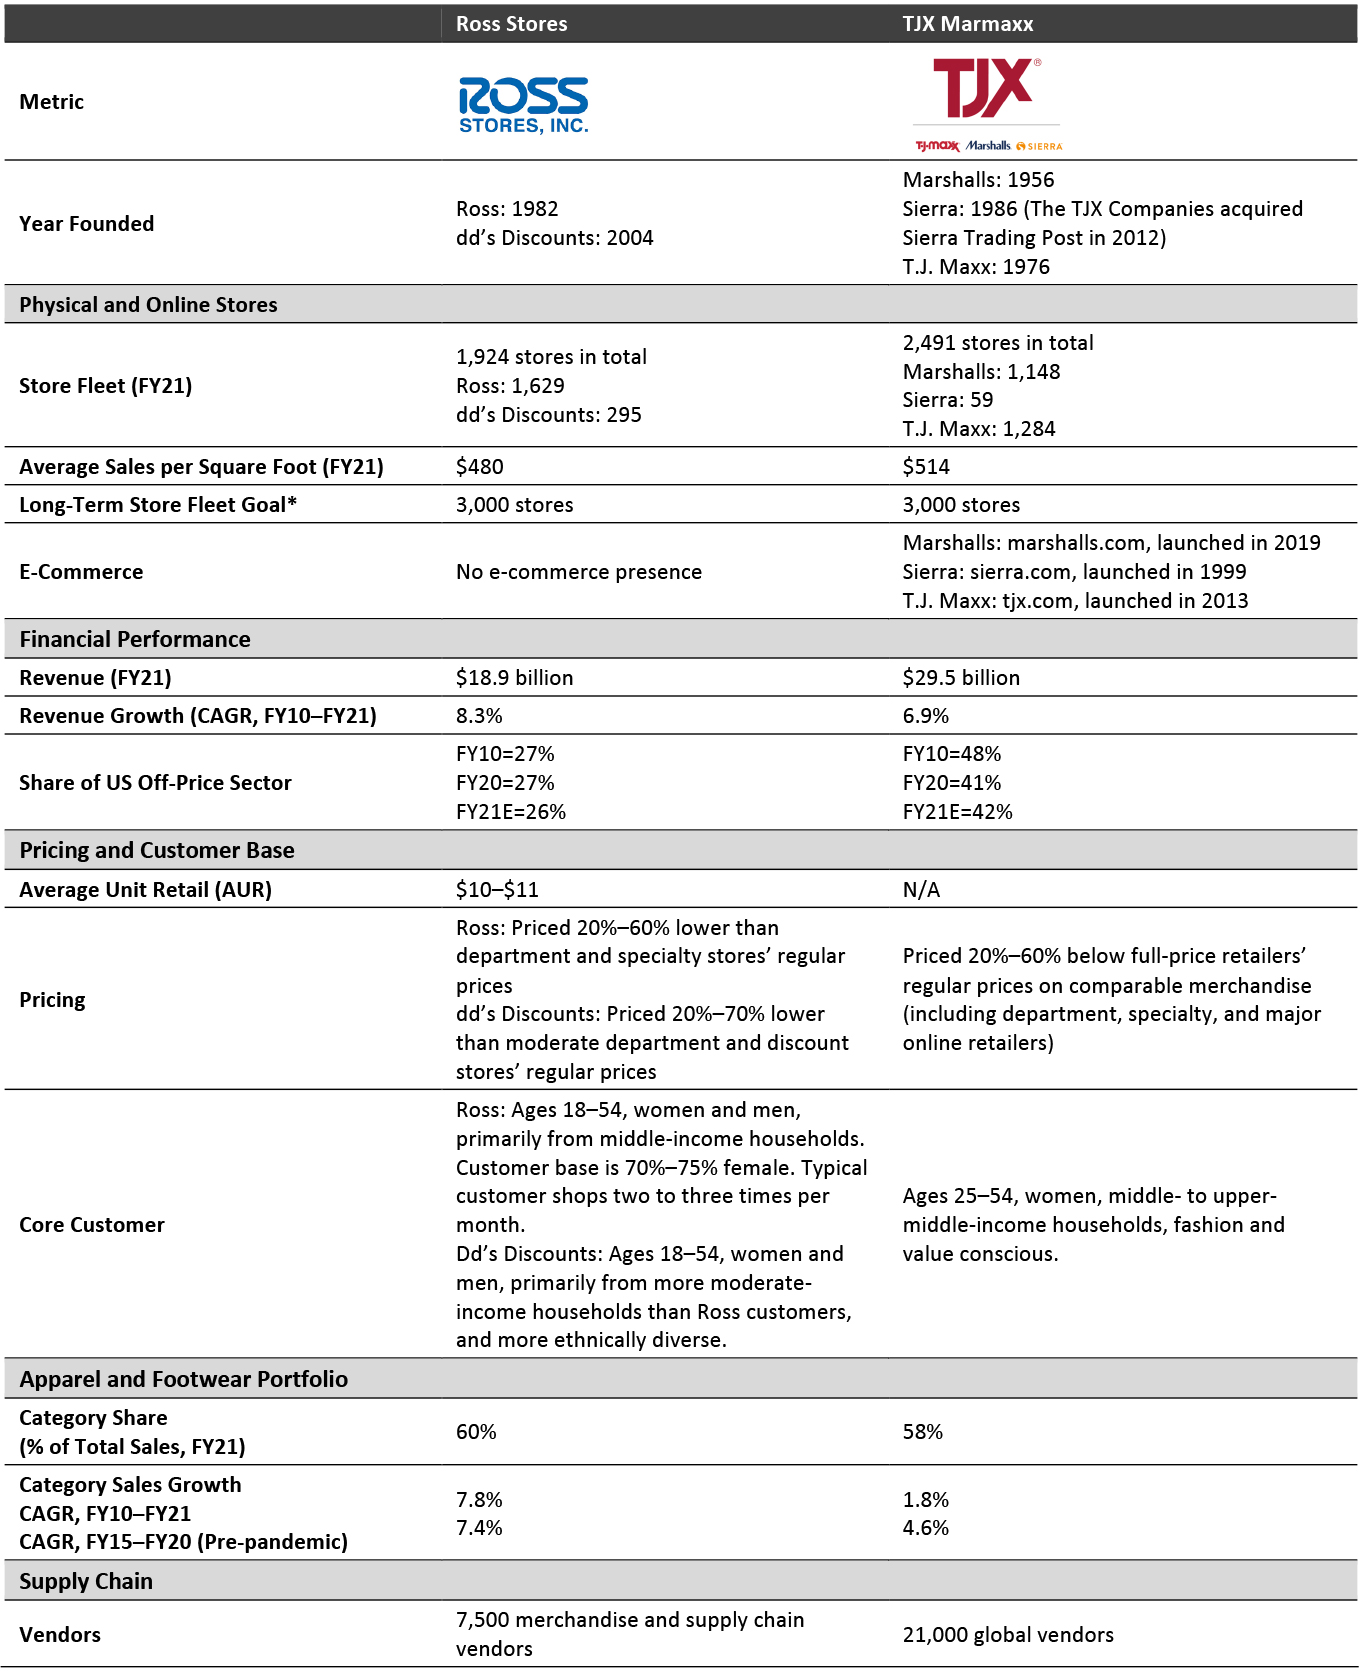 *No target date specified
 Source: Company reports [/caption] Revenue Growth Overall, we estimate that the US off-price sector totaled $71.5 billion in fiscal 2021, having increased by 51.7%, year over year. Despite declining by 22.2% in fiscal 2020, the sector grew at a CAGR of 8.4% between 2010 and 2021, we calculate; it is one of the few retail sectors that is seeing consistent growth in both revenues and physical store fleets and is currently exceeding pre-pandemic revenue levels; fiscal 2021 revenue was 18.1% above fiscal 2019. TJX Marmaxx, the largest off-price retail division, had revenues of $29.5 billion in fiscal 2021, up 52.3% from fiscal 2020. Ross Stores is the second-largest retailer in the off-price sector, with revenues totaling $18.9 billion in fiscal 2021, up 50.9%, year over year.
- With the exception of the Covid-19 pandemic in fiscal 2020, both Ross Stores and TJX Marmaxx saw positive year-over-year revenue growth between fiscal years 2010 and 2021.
- Ross Stores outperformed TJX Marmaxx with a CAGR of 8.3% from fiscal year 2010 to 2020, compared to TJX Marmaxx’s 6.9%, we calculate.
- Ross Stores saw revenue growth of 50.9% in fiscal 2021, and we estimate the retailer will see a 5.2% increase in fiscal 2022.
- TJX Marmaxx saw revenue growth of 52.3% in fiscal 2021, and we estimate the retailer will see an 8.8% increase in fiscal 2022.
Figure 2. Ross Stores vs. TJX Marmaxx: Revenue (Left Axis; USD Bil.) and YoY Growth (Right Axis; %) [caption id="attachment_144990" align="aligncenter" width="700"]
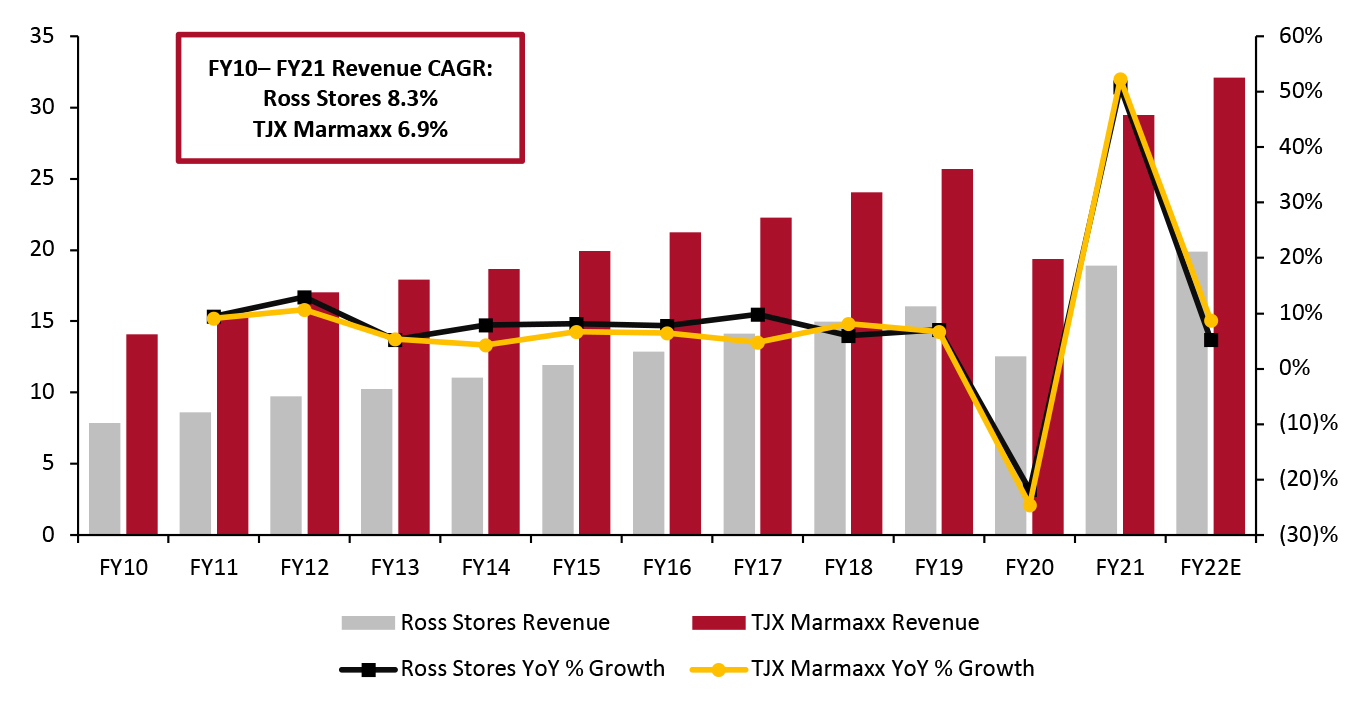 Source: Company reports[/caption]
Market Share
In fiscal 2021, TJX Marmaxx and Ross Stores held 67.7% of the off-price sector, totaling $48.4 billion in revenue—down from 75.0% in fiscal 2010 ($21.9 billion in revenues). TJX Marmaxx’s market share declined from 48.1% to 41.2% in the same period, while Ross Stores remained relatively consistent, declining slightly from 26.9% to 26.5%.
Most notably, TJX Marmaxx lost market share to its own banners, TJX HomeGoods and HomeSense, and to Nordstrom Rack. We expect in that in 2022, TJX Marmaxx will gain slightly on Ross, while Ross Stores will decline, based on the company’s revenue projections for 2022 (see Figure 4).
Source: Company reports[/caption]
Market Share
In fiscal 2021, TJX Marmaxx and Ross Stores held 67.7% of the off-price sector, totaling $48.4 billion in revenue—down from 75.0% in fiscal 2010 ($21.9 billion in revenues). TJX Marmaxx’s market share declined from 48.1% to 41.2% in the same period, while Ross Stores remained relatively consistent, declining slightly from 26.9% to 26.5%.
Most notably, TJX Marmaxx lost market share to its own banners, TJX HomeGoods and HomeSense, and to Nordstrom Rack. We expect in that in 2022, TJX Marmaxx will gain slightly on Ross, while Ross Stores will decline, based on the company’s revenue projections for 2022 (see Figure 4).
Figure 3. Off-Price Retailers: Market Share [caption id="attachment_144991" align="aligncenter" width="700"]
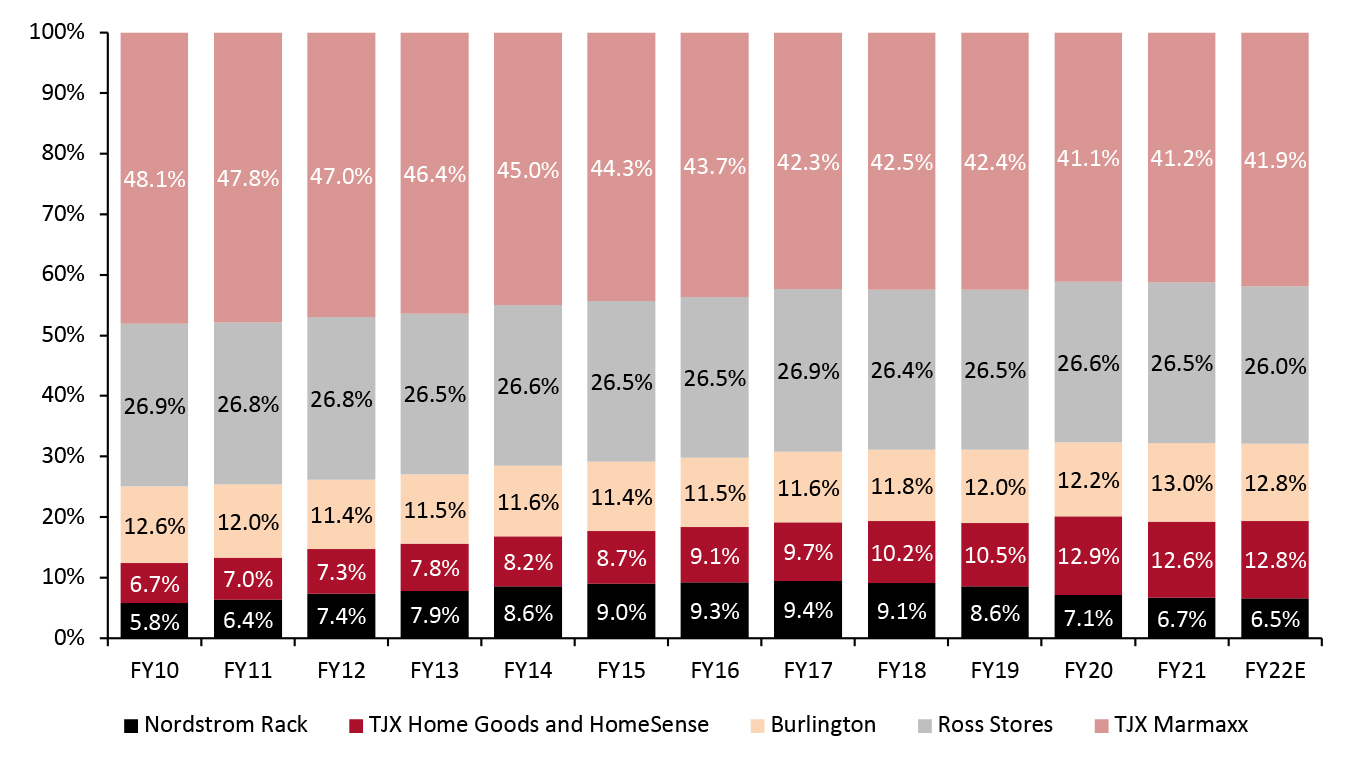 Source: Coresight Research [/caption]
Store Analysis
Source: Coresight Research [/caption]
Store Analysis
- Fleet and Store Sizes
Figure 4. Ross Stores vs. TJX Marmaxx: Store Fleets [caption id="attachment_144993" align="aligncenter" width="700"]
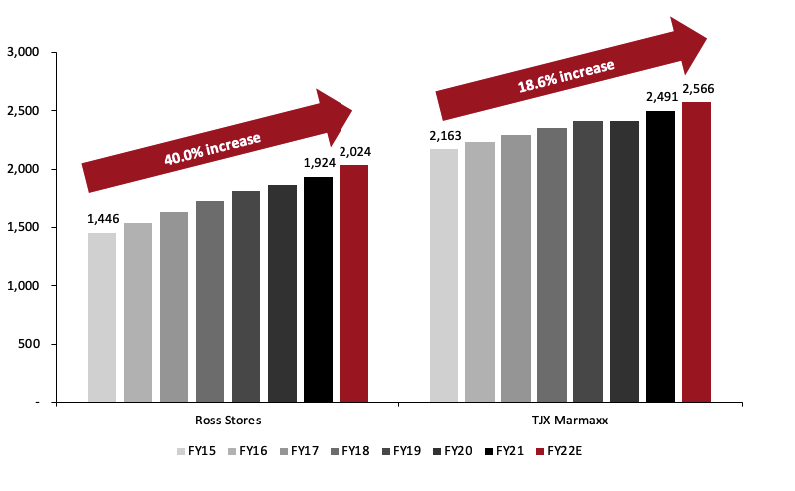 Source: Company reports/Coresight Research[/caption]
- Store Productivity
Figure 5. Ross Stores vs. TJX Marmaxx: Estimated Sales per Square Foot* (USD) [caption id="attachment_144994" align="aligncenter" width="701"]
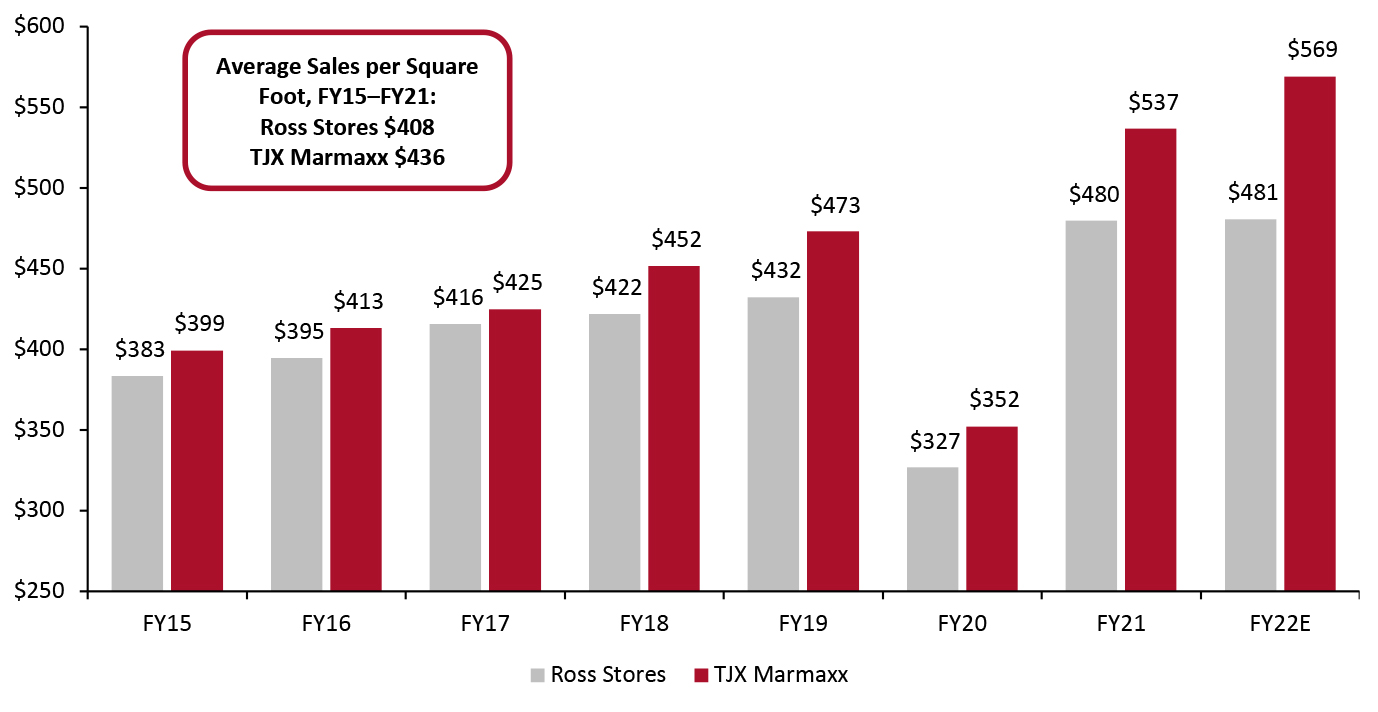 *Physical store sales only
 Source: Company reports/Coresight Research [/caption] Category Analysis Below, we summarize and compare performance by category at the two retailers, according to company reports. In this section, the CAGRs refer to revenue in the fiscal 2015–2021 period.
- TJX Marmaxx is leading in home with a CAGR of 11.2% compared to Ross Stores’ 8.7%. We expect Ross Stores to continue to bolster its home offerings, as home is TJX Marmaxx’s fastest-growing category.
- Ross Stores is leading in apparel and footwear with a CAGR of 7.4% compared to TJX Marmaxx’s 4.6%. Moving forward, Ross Stores has an opportunity to continue its differentiation and grow its apparel category, particularly in its men’s and children’s categories. TJX Marmaxx has an opportunity to further lean into its apparel category, particularly womenswear, which has been Ross Stores’ weakest apparel category in terms of growth in recent years.
- Both retailers are seeing strong growth in jewelry and accessories, with a revenue CAGR of 9.3% at Ross Stores and 9.2% at TJX Marmaxx.
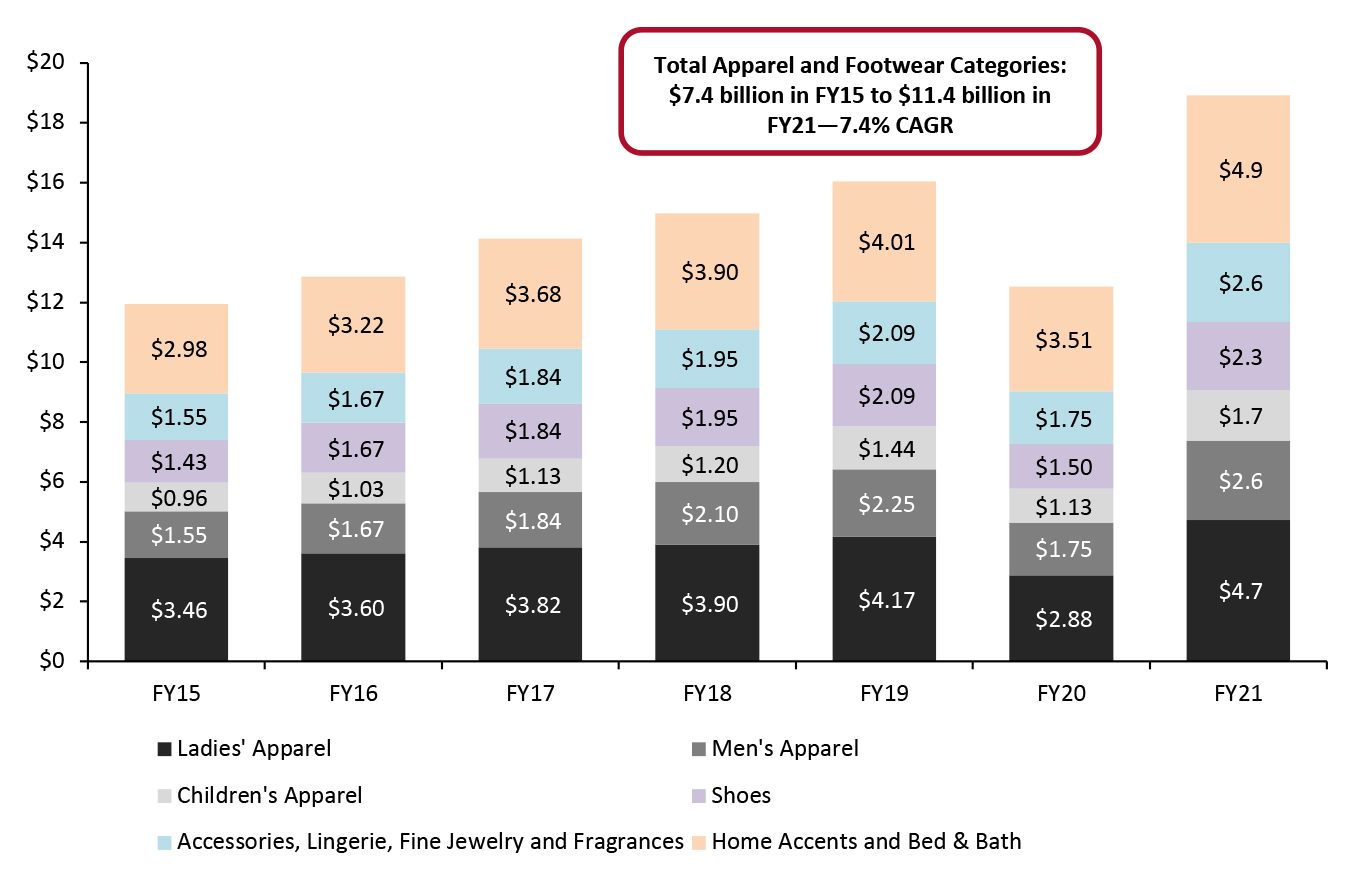
- “Home accents and bed & bath” and “ladies’ apparel” are the retailer’s two largest portfolio categories, totaling 51% of total revenues.
- Ladies’ apparel had been seeing revenue growth prior to the pandemic, but the category has seen its share of the retailer’s total revenue decline from 29% in fiscal 2015 to 23% in fiscal 2020. In fiscal 2021, ladies' apparel rebounded to 25% of the retailer’s total revenue.
- Children’s apparel is Ross Stores’ smallest but fastest-growing category, having grown at a 10.1% CAGR.
- Shoes hold a 12% share of the retailer’s total revenue as of fiscal 2021—a steady proportion from fiscal 2015—while the men’s apparel category grew from 13.0% to 14.0% of the portfolio in the same timeframe.
- The home category had been growing steadily prior to the pandemic, with a 7.7% CAGR from fiscal 2015 to 2019. Home was one of Ross Stores’ best performing categories due to the effects of the pandemic and the shift in consumer spending; although the home category saw a decline in fiscal 2020, it fell less sharply than the retailer’s other categories. Home accounted for 26.0% of the retailer’s revenues in fiscal 2021, up from 25% in fiscal 2019.
Figure 6. Ross Stores: Category Sales (USD .) [caption id="attachment_144995" align="aligncenter" width="700"]
 Source: Company reports/Coresight Research[/caption]
TJX Marmaxx
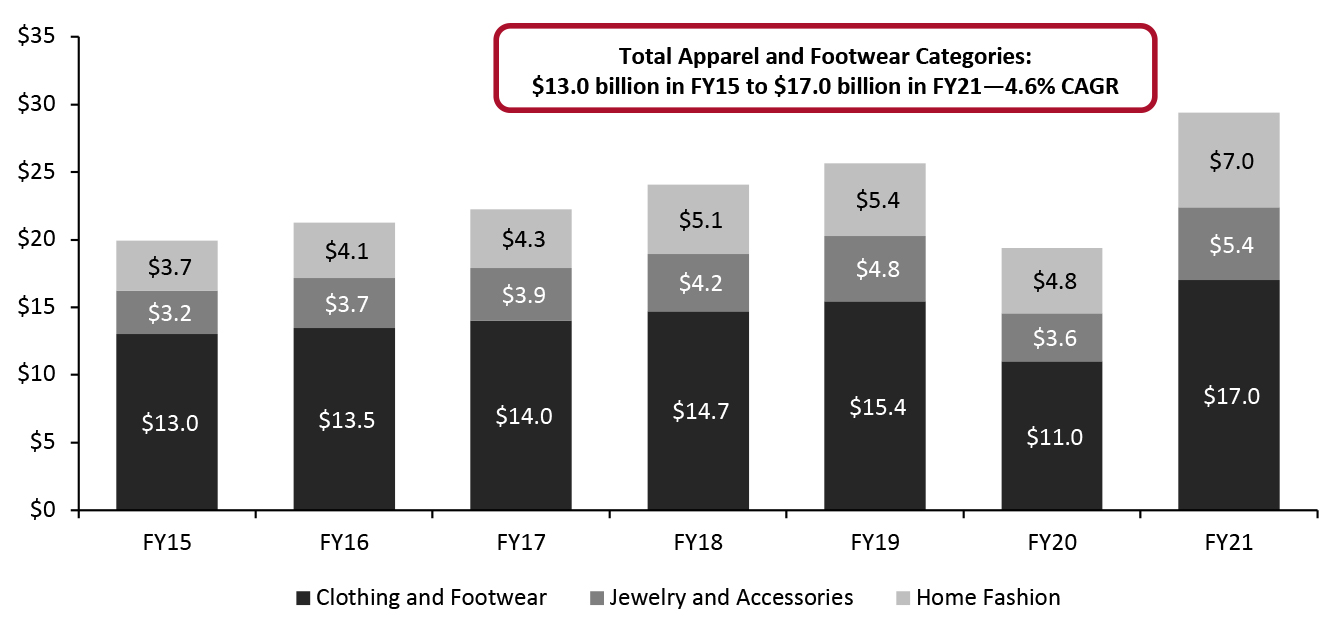
The TJX Companies summarizes its portfolio category sales across all of its banners. We disaggregated the company’s US HomeGoods and Homesense shares of portfolio revenues to estimate clothing and footwear, jewelry and accessories, and home revenues at its TJX Marmaxx stores.
Source: Company reports/Coresight Research[/caption]
TJX Marmaxx
The TJX Companies summarizes its portfolio category sales across all of its banners. We disaggregated the company’s US HomeGoods and Homesense shares of portfolio revenues to estimate clothing and footwear, jewelry and accessories, and home revenues at its TJX Marmaxx stores.
- Clothing and footwear is the largest but slowest-growing category of TJX Marmaxx’s three major categories, with a revenue CAGR of 4.6% from fiscal 2015 to fiscal 2021. Clothing and footwear comprised 57.7% of TJX Marmaxx’s overall sales in fiscal 2021, down from 65.3% in fiscal 2015, we estimate.
- Jewelry and accessories is the retailer’s second-fastest-growing category, with a 9.2% CAGR from fiscal 2015 to fiscal 2021.
- Despite The TJX Companies having a separate HomeGoods banner, the “Home Fashion” category is the strongest category at TJX Marmaxx, with an 11.2% revenue CAGR from fiscal 2015 to fiscal 2021. The home category is gaining share of TJX Marmaxx’s overall portfolio, comprising 23.9% of revenues in fiscal 2021, up from 18.7% in fiscal 2015.
Figure 7. TJX Marmaxx: Category Sales (USD Bil.) [caption id="attachment_144996" align="aligncenter" width="700"]
 Source: Company reports/Coresight Research[/caption]
Supply Chain: Buying and Distribution Capabilities
Ross Stores
Ross Stores’ buying model relies on merchandise acquired through opportunistic purchases, created by manufacturer overruns and canceled orders, both during and at the end of a season.
Its buying strategy also focuses on packaway, a strategy of purchasing some merchandise with the intention of storing it for sale in future selling seasons. Packaway accounted for 46% of total inventory in fiscal years 2019 and 2020, and averaged 47% between fiscal 2015 and 2020. Ross Stores reported that the timing and release of packaway inventory to its stores varies by merchandise category and by season but typically remains in storage for less than six months. The retailer believes that the strong discounts it offers on packaway merchandise are a key driver of its business results.
TJX Marmaxx
The TJX Marmaxx buying team is global, and the company reported that it sources products from over 21,000 vendors globally. TJX Marmaxx’s immense global vendor network is an advantage as the supply chain is becoming more congested, and the ability to source and transport products from many different vendors is becoming more critical.
A differentiator and success factor for TJX Marmaxx stores is its multi-pronged buying strategy, as the retailer has diversified options to replenish its off-price assortments, particularly as consumers are increasingly seeking unique one-of-a-kind items.
The retailer reported that it buys much of its merchandise for the current and/or upcoming selling season, with a focus on offering trending products, purchasing through closeout sales, canceled orders and overruns. The retailer supplements its portfolio assortment with direct buys and is willing to purchase less-than-full assortments of items, styles and sizes, as well as quantities ranging from small to very large across its global network. This allows the retailer to offer an eclectic mix of merchandise in its stores to offer the “one-of-a-kind” search and discovery experience.
TJX Marmaxx has a small assortment of private-label, licensed brands to supplement its merchandise mix, and it also uses a packaway strategy.
Source: Company reports/Coresight Research[/caption]
Supply Chain: Buying and Distribution Capabilities
Ross Stores
Ross Stores’ buying model relies on merchandise acquired through opportunistic purchases, created by manufacturer overruns and canceled orders, both during and at the end of a season.
Its buying strategy also focuses on packaway, a strategy of purchasing some merchandise with the intention of storing it for sale in future selling seasons. Packaway accounted for 46% of total inventory in fiscal years 2019 and 2020, and averaged 47% between fiscal 2015 and 2020. Ross Stores reported that the timing and release of packaway inventory to its stores varies by merchandise category and by season but typically remains in storage for less than six months. The retailer believes that the strong discounts it offers on packaway merchandise are a key driver of its business results.
TJX Marmaxx
The TJX Marmaxx buying team is global, and the company reported that it sources products from over 21,000 vendors globally. TJX Marmaxx’s immense global vendor network is an advantage as the supply chain is becoming more congested, and the ability to source and transport products from many different vendors is becoming more critical.
A differentiator and success factor for TJX Marmaxx stores is its multi-pronged buying strategy, as the retailer has diversified options to replenish its off-price assortments, particularly as consumers are increasingly seeking unique one-of-a-kind items.
The retailer reported that it buys much of its merchandise for the current and/or upcoming selling season, with a focus on offering trending products, purchasing through closeout sales, canceled orders and overruns. The retailer supplements its portfolio assortment with direct buys and is willing to purchase less-than-full assortments of items, styles and sizes, as well as quantities ranging from small to very large across its global network. This allows the retailer to offer an eclectic mix of merchandise in its stores to offer the “one-of-a-kind” search and discovery experience.
TJX Marmaxx has a small assortment of private-label, licensed brands to supplement its merchandise mix, and it also uses a packaway strategy.
Figure 8. Ross Stores vs. TJX Marmaxx: Buying and Distribution Capabilities [wpdatatable id=1875]
Source: Company reports Inventory Turnover In the past four reported quarters, Ross Stores has turned its inventory faster than The TJX Companies (all banners, including its HomeGoods and Homesense banners), as shown in Figure 10, and in the latest quarter, both retailers are turning their inventory at the same rate. In March 2022, Ross Stores reported on its earnings call for the fourth quarter of fiscal 2021 that at quarter-end, total consolidated inventories were up 23% compared to the fourth quarter of fiscal 2019 (pre-pandemic), mainly due to an increase in in-transit merchandise due to longer lead times in the supply chain. Average store inventories were down slightly versus 2019, while packaway merchandise represented 40% of total inventories compared to 46% of total inventory in the fourth quarter of fiscal 2019. In March 2022, TJX management reported on its fourth-quarter earnings call that inventory was up 22% on a constant-currency basis versus the fourth quarter of fiscal 2019 (pre-pandemic), primarily due to higher in-transit inventory. Management reported that it was pleased with in-store inventory levels as they improved sequentially, and the company is well positioned for spring merchandise.
Figure 9. Ross Stores vs. The TJX Companies: Inventory Turns [caption id="attachment_144997" align="aligncenter" width="700"]
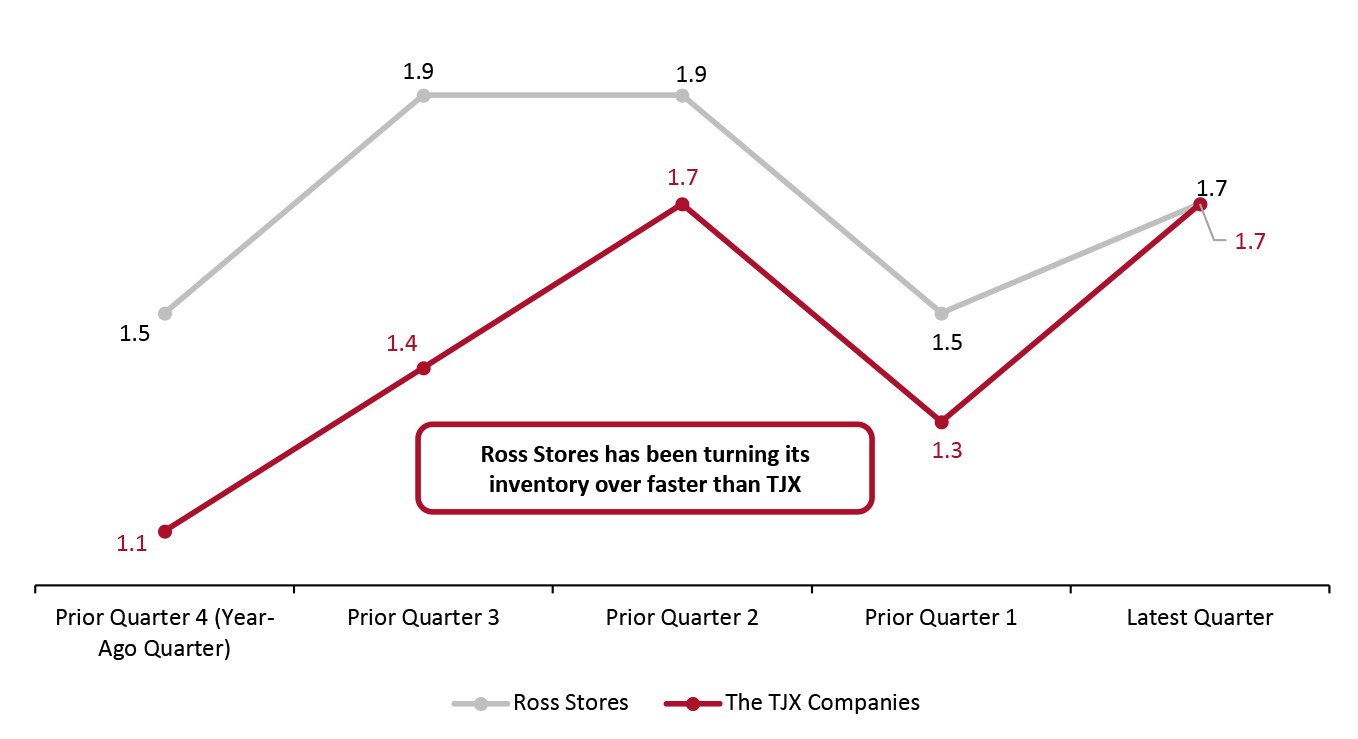 Latest quarter is 4Q21, ended January 30, 2022
 Source: Company reports/Coresight Research [/caption]