
albert Chan
What’s the Story?
Alibaba and JD.com are both innovators in retailing and technology in China; they are the country’s two largest e-commerce companies. This report, part of Coresight Research’s new Head-to-Head series, compares the evolving business models of the two companies, covering selected financial and operating metrics and investment strategies. We offer insights into the next leg of growth for Alibaba and JD.com.
Why It Matters
We expect e-commerce to continue to be a major driver of consolidation in the Chinese retail market, due to the online channel’s rapid growth, the scalability of online retail operations and the highly concentrated nature of e-commerce in China—with Alibaba and JD.com together accounting for at least a 70% share of channel sales.
As Alibaba and JD.com are the largest e-commerce companies in China, we take a detailed look at how the two companies compete against each other—including their business models and key success strategies.
Alibaba vs. JD.com: A Deep Dive
Business Models
Alibaba and JD.com compete against each other in the e-commerce industry, but they employ different business models to achieve success.
JD.com utilizes retail and marketplace models: Products are primarily offered to buyers through JD.com’s online storefront, which includes first- and third-party listings. The company earns commission on third-party sales on its marketplace, and it also offers fulfillment and warehousing services to brands and retailers for a fee.
Unlike JD.com, Alibaba does not conduct first-party e-commerce but operates only intermediary marketplaces that connect consumers and retailers. Alibaba’s core platforms are Taobao and Tmall.
Both Alibaba and JD.com are involved in upscale, physical grocery retail:
- Alibaba has the Freshippo chain (formerly called Hema), which includes smaller formats such as Freshippo Mini.
- JD.com’s SEVEN FRESH offering includes its grocery store SEVEN FRESH and community store SEVEN FRESH LIFE.
Figure 1. Company Overviews: Alibaba and JD.com
[wpdatatable id=705]*Latest full-year data available: Alibaba’s fiscal year 2020 ended March 31, 2020; JD.com’s fiscal year 2019 ended December 31, 2019 (fiscal 2020 results not yet reported) Source: Company reports
Share of China’s E-Commerce Market
Alibaba accounted for a 42.7% share of the e-commerce market in China in 2019, according to Euromonitor International. This represents a one percentage-point increase, compared to last year.
JD.com accounted for a 29.4% market share during the same period, representing a one percentage-point decrease compared to last year.
Figure 2. Alibaba and JD.com: Share of China’s E-Commerce Market, 2019
[caption id="attachment_122325" align="aligncenter" width="550"]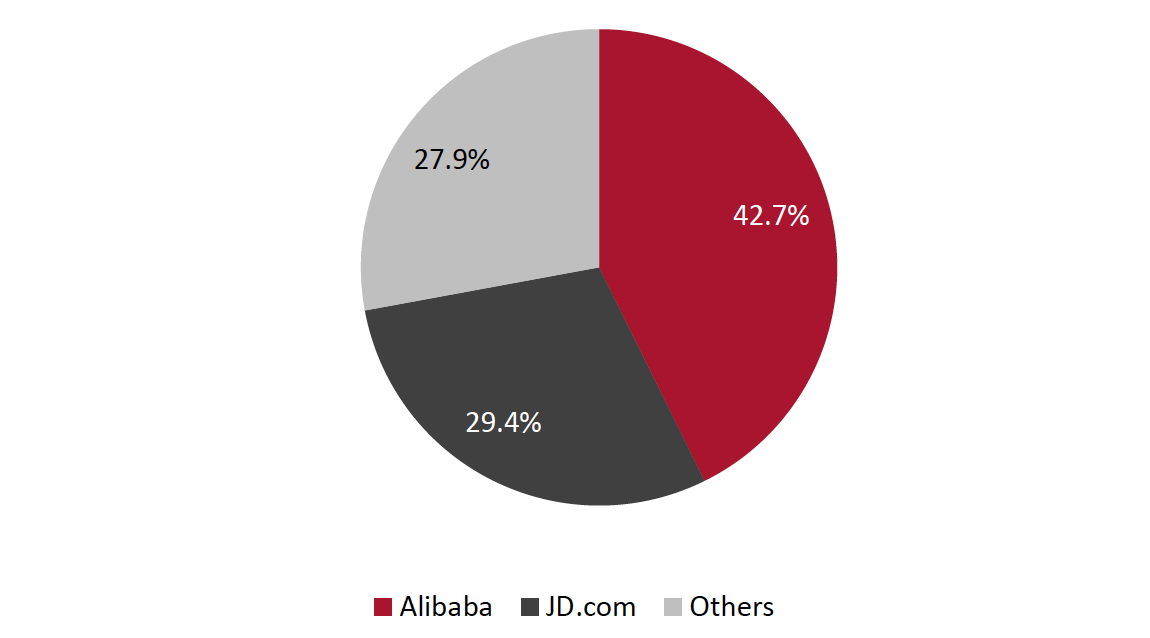 Source: Euromonitor International Limited 2021 © All rights reserved[/caption]
Revenue Growth
JD.com posted revenue of $82.9 billion in fiscal 2019, ended December 2019. Alibaba reached $72.0 billion in revenue in its fiscal year 2020, ended March 31, 2020. However, Alibaba’s revenue grew at a CAGR of 46.3% over the five years from fiscal 2016 to 2020, while JD.com saw a lower CAGR of 31.2% from 2015 to 2019.
The disparity between relative market share and relative revenues is a function of Alibaba’s focus on marketplaces—Alibaba receives a commission on sales rather than the full value, whereas JD.com’s first-party retail sales are booked at the full value of sales.
Figure 3. A Comparison of Alibaba’s and JD.com’s Revenue over Five Years (USD Bil.)
[caption id="attachment_122326" align="aligncenter" width="700"]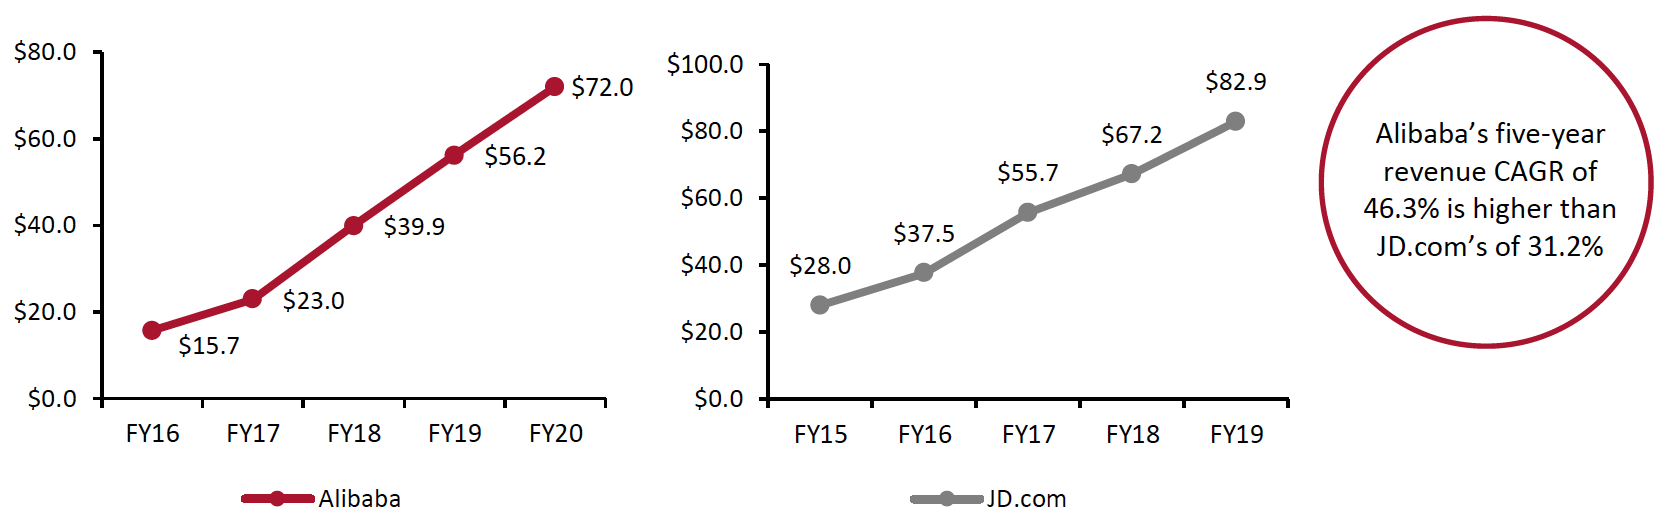 Note: Alibaba’s fiscal year ends March 31; JD.com’s fiscal year ends December 31. Both companies provided figures in USD at annual exchange rates.
Source: Company reports/Coresight Research[/caption]
In 2019, JD.com yielded worldwide GMV of $299.5 billion. Alibaba reported GMV of $945 billion on its China retail marketplaces in its fiscal year ended March 31, 2020.
Moreover, JD.com reported net income of $1.75 billion in 2019, while comparably, Alibaba reported $19.8 billion in net income in fiscal year 2020, resulting in net margins of 2.1% and 27.5%, respectively. On this basis, and not adjusting for the differences in business models, Alibaba is over 13 times more profitable than JD.com.
Profitability
Alibaba reported an operating margin of 17.9% in fiscal year 2020, which was more than ten times the 1.6% operating margin reported by JD.com at the end of 2019.
Comparing Alibaba’s core commerce business to JD.com’s third-party seller services, which share similar business functions, we found that the two companies both saw strong revenues in their latest reported fiscal years—with Alibaba reporting $61.6 billion in its fiscal 2020 and JD.com reporting $5.3 billion in fiscal 2019. In order to work out JD.com’s third-party operating margin, which was not revealed by the company, we have assumed that it has a similar operating margin to Alibaba’s core commerce—which is mostly third-party business. Alibaba reported an operating margin of 31.8% for its core commerce business in fiscal 2020, thus we have applied the same figure to JD.com, resulting in an estimated operating income of $1.69 billion for its third-party seller services (as shown in Figure 4).
The company’s operating income reached $2.0 billion for JD Retail, which includes online retail, an online marketplace and marketing services in China. We estimate that its operating income from first-party business reached around $0.31 billion in 2019, on the basis of the difference between reported figures for JD Retail and our estimate for the third-party sales segment. The inferred margin for first-party retail stood at 0.4% and 31.9% for third-party retail, highlighting that JD.com’s first-party retail drags down its overall operating margin.
Figure 4. A Breakdown of JD.com’s Revenue and Operating Income, FY19 [wpdatatable id=706]
Totals have been rounded *Coresight Research estimate: JD.com did not release revenue figures for its third-party business. We sourced the figures from financial firm Guangfa Securities. In 1Q20, JD Retail's revenue was ¥139.42 billion ($19.7 billion), and the revenue of its first-party business was ¥130.1 billion ($18.4 billion). We calculated the annual revenue of JD.com’s third-party based on the 1Q20 ratio. **JD Retail mainly consists of online retail, an online marketplace and marketing services in China. ***New Businesses include logistics services provided to third parties, overseas business and technology initiatives, as well as asset management services to logistics property investors and sales of development properties by JD Property. ****Others include inter-segment eliminations and unallocated items. The inter-segment eliminations mainly consist of services provided by JD Retail to overseas business and certain services provided by JD Logistics to the vendors of JD Retail, which the Group records as deduction of cost of revenues at the consolidated level. Unallocated items include share-based compensation, amortization of intangible assets resulting from assets and business acquisitions, effects of business cooperation arrangements, and impairment of goodwill and intangible assets, which are not allocated to segments Source: Company reports/Guangfa Securities/Coresight Research
Alibaba’s core commerce segment, which includes numerous retail and wholesale marketplaces, is its largest source of revenue—accounting for 85.6% of the company’s total revenue in fiscal year 2020. The company generates revenue from merchants through sales of customer management, marketing and software services as well as commission on transactions.
Alibaba’s other business segments, as outlined in Figure 5 are not yet turning a profit.
Figure 5. A Breakdown of Alibaba’s Revenue and Operating Income, FY20
[wpdatatable id=707]Totals have been rounded *Includes administrative expenses and other miscellaneous expenses that have not been allocated to each segment. Source: Company reports
Internally Developed Technologies: Growth Drivers
While the global secular trend in online shopping remains a strong pillar of growth for both Alibaba and JD.com, such as using C2M. In the C2M model, retailers collect data from customers and use big data to create customer profiles, analyze consumption characteristics and plan production. This helps retailers to anticipate product demand and reduce inventory and supply chain risks.
Cloud Computing is the segment that is primarily driving the rapid growth of Alibaba’s revenue. For JD.com, its technology-focused logistics arm, JD Logistics, was its fastest growing segment in 2019.
As shown in Figure 6, Alibaba’s Cloud Computing revenue grew at a rate of 62% to $5.6 billion in fiscal 2020, representing 7.9% of the company’s total revenue. The segment’s operating loss was $990.8 million in fiscal 2020, but we may see it turn profitable in the current fiscal year, according to discussions from Alibaba’s annual Investor Day. Alibaba’s cloud technology served more than half of China’s A-shares listed companies, supporting data storage and network virtualization services, as well as large-scale application, big data analytics, computing, IoT (Internet of Things), machine learning, management and security services.
Figure 6. A Breakdown of Alibaba’s Revenue by Segment, FY20
[wpdatatable id=708]Totals have been rounded Source: Company reports
Logistics is JD.com’s main area of internal technology development. As shown in Figure 7, JD.com’s logistics revenue grew at a rate of 89.6% year over year to $3.3 billion in 2019, representing 4.1% of the company’s total revenue. As detailed in Figure 4, the company’s logistics operating income totaled $(0.15) billion in 2019, an increase of 80.3% compared to 2018, and equivalent to (11.4)% of JD.com’s consolidated operating income. The logistics segment supports JD.com’s retail business strategy of growing in scale and capturing further market share despite its modest losses. JD Logistics is expected to be listed on the stock market in Hong Kong or the US in 2021 with a valuation of $40 billion, according to news agency Reuters.
Figure 7. A Breakdown of JD.com’s Revenue by Segment, FY19
[wpdatatable id=709]Source: Company reports
JD.com’s Logistics Development: In Detail
JD Logistics won first and third prize at China’s 2020 Science and Technology Awards for the Postal Industry for its 5G logistics park production control system and its network planning and simulation platform respectively. In December 2020, JD.com launched its self-developed logistics drone, which can carry loads of several hundred kilograms with airdrop capabilities, for the first time. The company is planning to deploy more than 100,000 robots within its logistics operations by 2025.
JD.com leverages a network of over 800 warehouses covering approximately 215 million square feet, as of January 2021. The company has built 30 automated smart fulfilment centers in China, referred to as “Asia No.1” logistics parks, and has achieved full coverage in 2,854 administrative districts and counties in Mainland China. The biggest advantage of JD Logistics lies in the delivery speed it offers. Same-day delivery and next-day delivery services cover 1,410 urban and rural areas in China, and the delivery times can be accurate within two hours in 250 cities and within a 30-minute window in 19 cities.
Increasing consumer demand for faster delivery of online orders will put a spotlight on JD.com’s advanced logistics network, which is an important driving force behind the steady upward development of JD.com’s e-commerce business. We have seen JD Logistics continuously evolve to offer faster delivery services, including Specified Time Delivery where shoppers can reserve a delivery within a specific time slot.
Figure 8. JD Logistics Developments Timeline
[wpdatatable id=710]Source: Company reports/Coresight Research
JD.com’s focus on logistics is also evident in the multiple financing rounds it has carried out since 2007. Figure 9 provides an overview of financing designated for logistics development, as noted in company press releases.
Figure 9. Overview of JD.com Financing Used for Logistics Development
[wpdatatable id=711]*DADA Group was established in 2014 and merged with JD Daojia—JD.com’s two-hour grocery delivery service—in April 2016. In 2016, DADA Group received $250 million from JD.com and Walmart Group. On August 9, 2018, DADA completed the latest round of $500 million in financing, with JD.com and Walmart Group both increasing their capital. Source: Company reports/Coresight Research
Alibaba’s Logistics Investments: In Detail
Alibaba does not build its own logistics system, but it has been investing in logistics firms to expand its share of the delivery market. Over the years, Alibaba has invested in 13 domestic logistics firms and four firms outside Mainland China, amounting to more than $8 billion in logistics investments. Among the 13 domestics logistic firms that Alibaba has invested in, Best, STO, YTO and ZTO are public firms that account for more than half of China's delivery market.
Logistics company Cainiao is Alibaba’s logistics arm. It was co-founded by Alibaba and logistics firms including Best, STO, YTO and ZTO in 2013. The company spans delivery, warehouse and pick-up services, as well as rural and cross-border logistics. In 2019, Alibaba invested approximately $3.3 billion in Cainiao.
Cainiao’s goal is to be able to deliver anywhere in China within 24 hours and anywhere in the world within 72 hours. Cainiao focuses on using data insights and technology to digitalize and improve efficiency across the entire logistics process. The platform uses AI to help merchants to predict regional demand for certain products and to speed up parcel deliveries by determining the fastest and most cost-effective delivery routes.
Figure 10. Alibaba’s Investments in Logistics
[wpdatatable id=712]Source: Company reports/Coresight Research
New Retail: Alibaba’s Icon
Alibaba has evolved to provide technology solutions to businesses and consumers. Through its “New Retail” concept, which is a model for integrating online retail and logistics across a single value chain powered by data and technology, Alibaba strives to remain at the forefront of innovation in e-commerce and broaden its offering into big data, mobile payment solutions and physical infrastructure.
Through its New Retail strategy, we see Alibaba tapping into different business verticals such as entertainment, offline retail and utilities to fuel growth.
Figure 11. Alibaba’s New Retail Ecosystem
[caption id="attachment_122327" align="aligncenter" width="700"]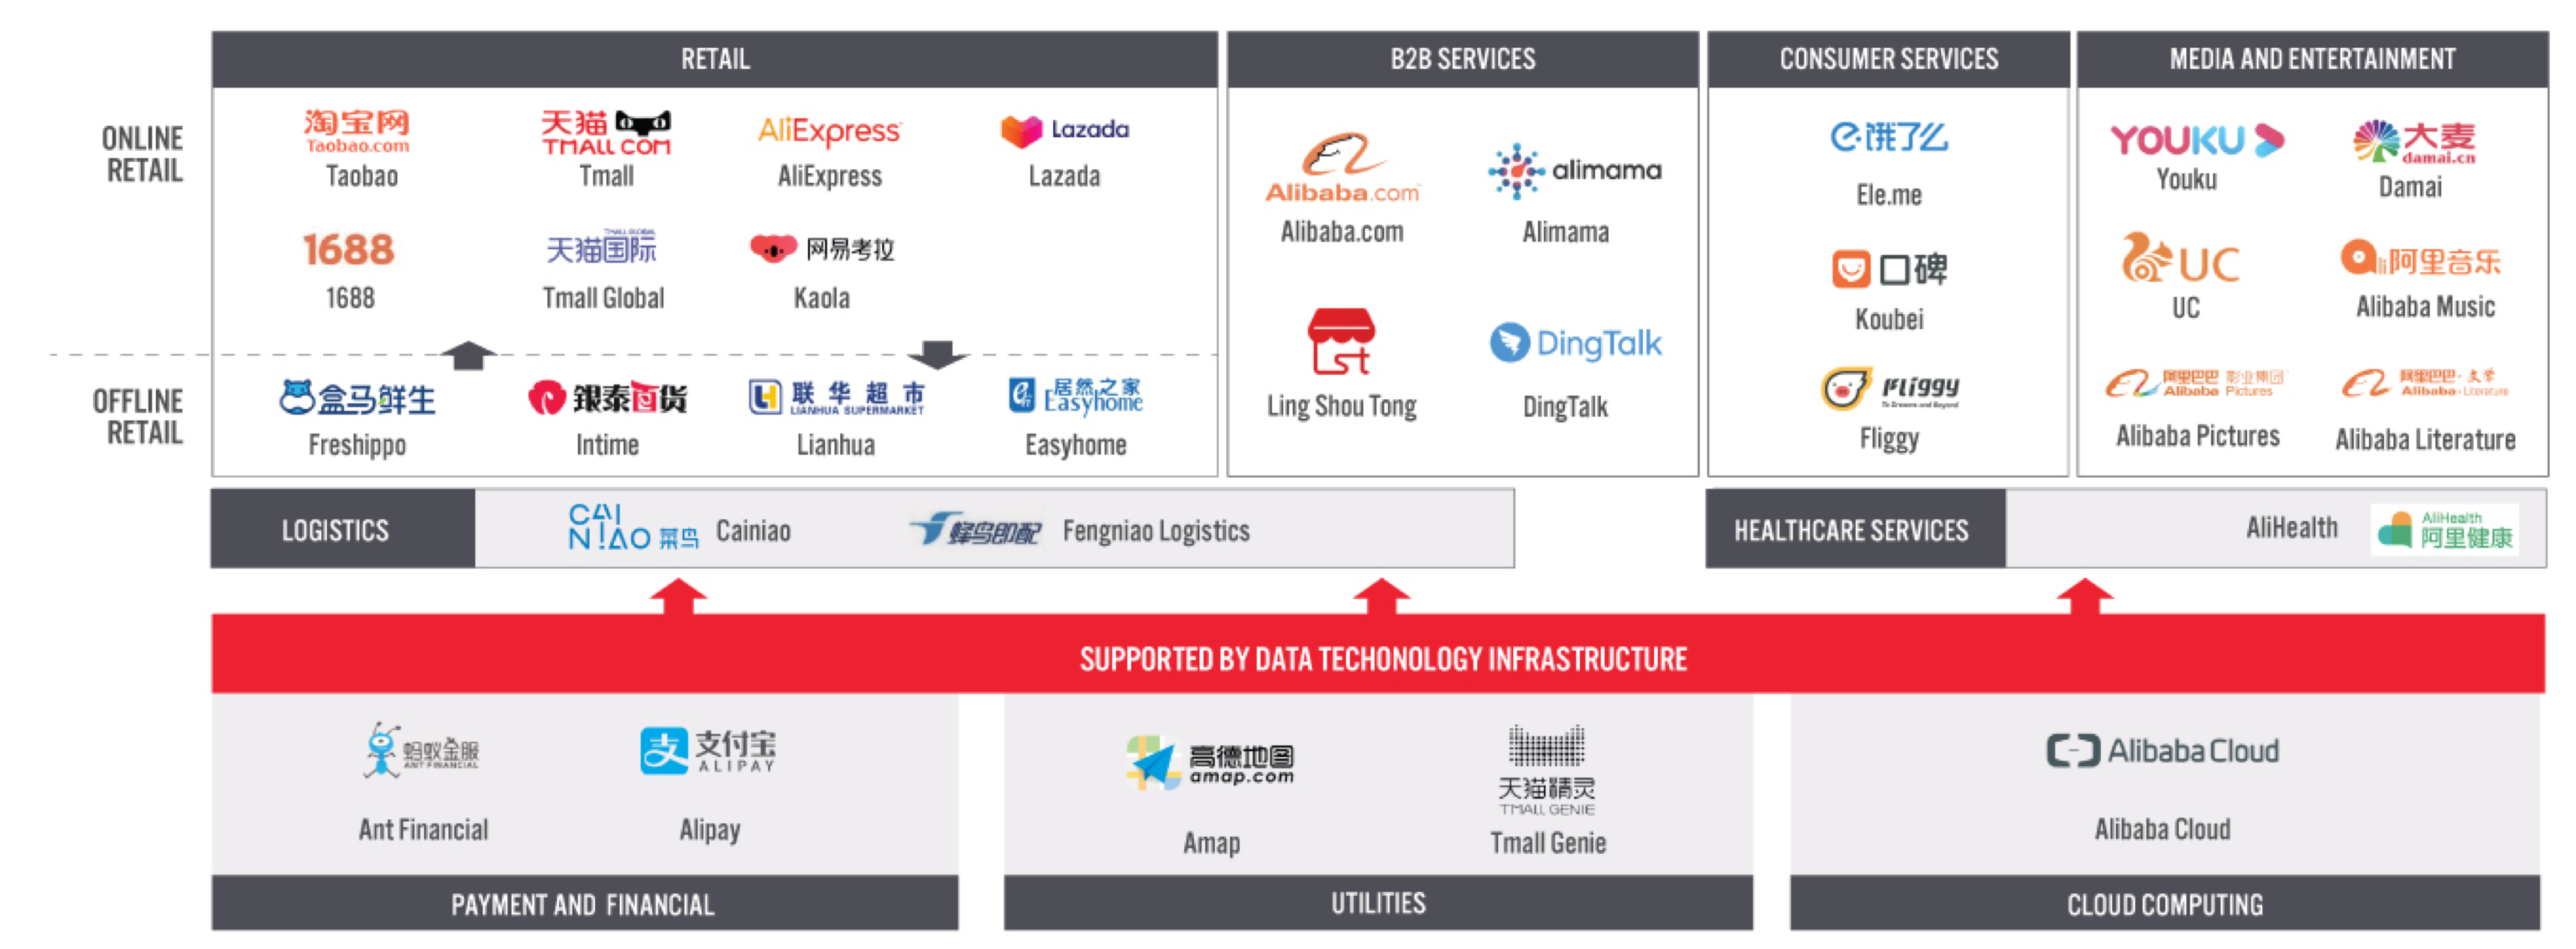 Source: Company reports/Coresight Research[/caption]
However, it is worthwhile to note that Alibaba quantifies its New Retail revenue as sales from its fresh-food chain Freshippo (and its various formats Fast & Fresh, Freshippo Farmers’ Market, Freshippo Mini, Pick’n Go), and department store chain Intime. The other units in the New Retail ecosystem come under its Digital Media & Entertainment segment or Innovation systems.
The company’s New Retail revenue increased by 115% year over year to ¥86.2 billion ($13.3 billion) in fiscal 2020. Alibaba’s New Retail revenue in the first quarter of 2020 was 16 times that of the second quarter of 2017, when the company first reported on it.
As of March 2020, Alibaba owns 207 Freshippo stores, with the proportion of online GMV for these stores in the first quarter of 2020 reaching more than 60%, increasing 10 percentage points from the same period last year.
Figure 12. Alibaba’s New Retail Revenue (CNY Bil.)
[caption id="attachment_122328" align="aligncenter" width="700"]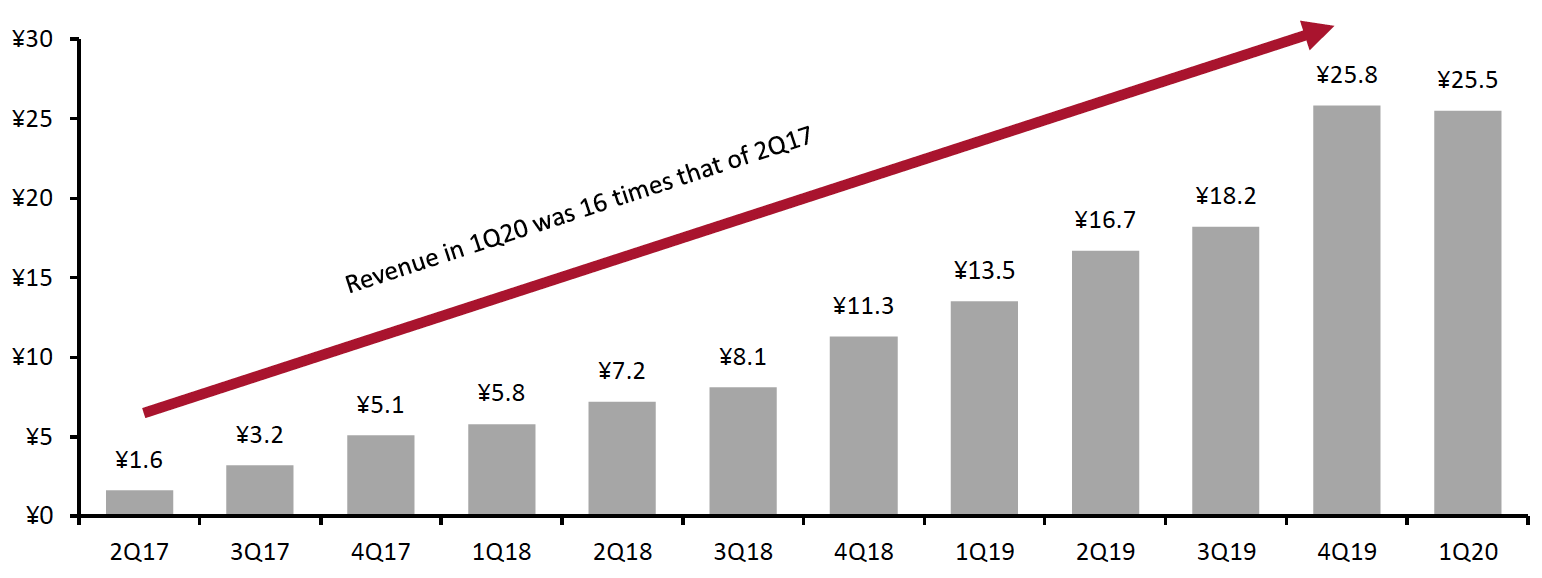 Note: Alibaba combines its New Retail revenue with its first-party revenue, such as Tmall Supermarket. The data shown in the graph includes sales from New Retail and its first-party business. Since the first-party business (e.g., Tmall Supermarket) currently counts a small part of the data, we see this data as primarily representing New Retail revenue.
Source: Company reports/Coresight Research[/caption]
We have seen Alibaba actively support offline retailers, local service providers and merchants to digitalize their businesses—empowering them with data technology and strategies to create value from data insights through the company’s New Retail strategy.
Figure 13. Alibaba’s Investment in Offline Retail Businesses
[wpdatatable id=713]Source: Company reports/Coresight Research
JD.com is also making efforts to explore new growth opportunities in the area of online and offline integration. The company has expanded its offline retail market through 7FRESH, the fresh food supermarket brand, as well as its home appliance stores. It announced plans to open 300 home appliance flagship stores in second- and third- tier cities and 5,000 stores in towns and villages by 2025. Combined with the existing 15,000 JD home appliance stores, the new stores are designed to create a new offline experience in the electronics and home appliance business.
Figure 14. JD.com’s Omnichannel Retail Ecosystem
[caption id="attachment_122329" align="aligncenter" width="700"]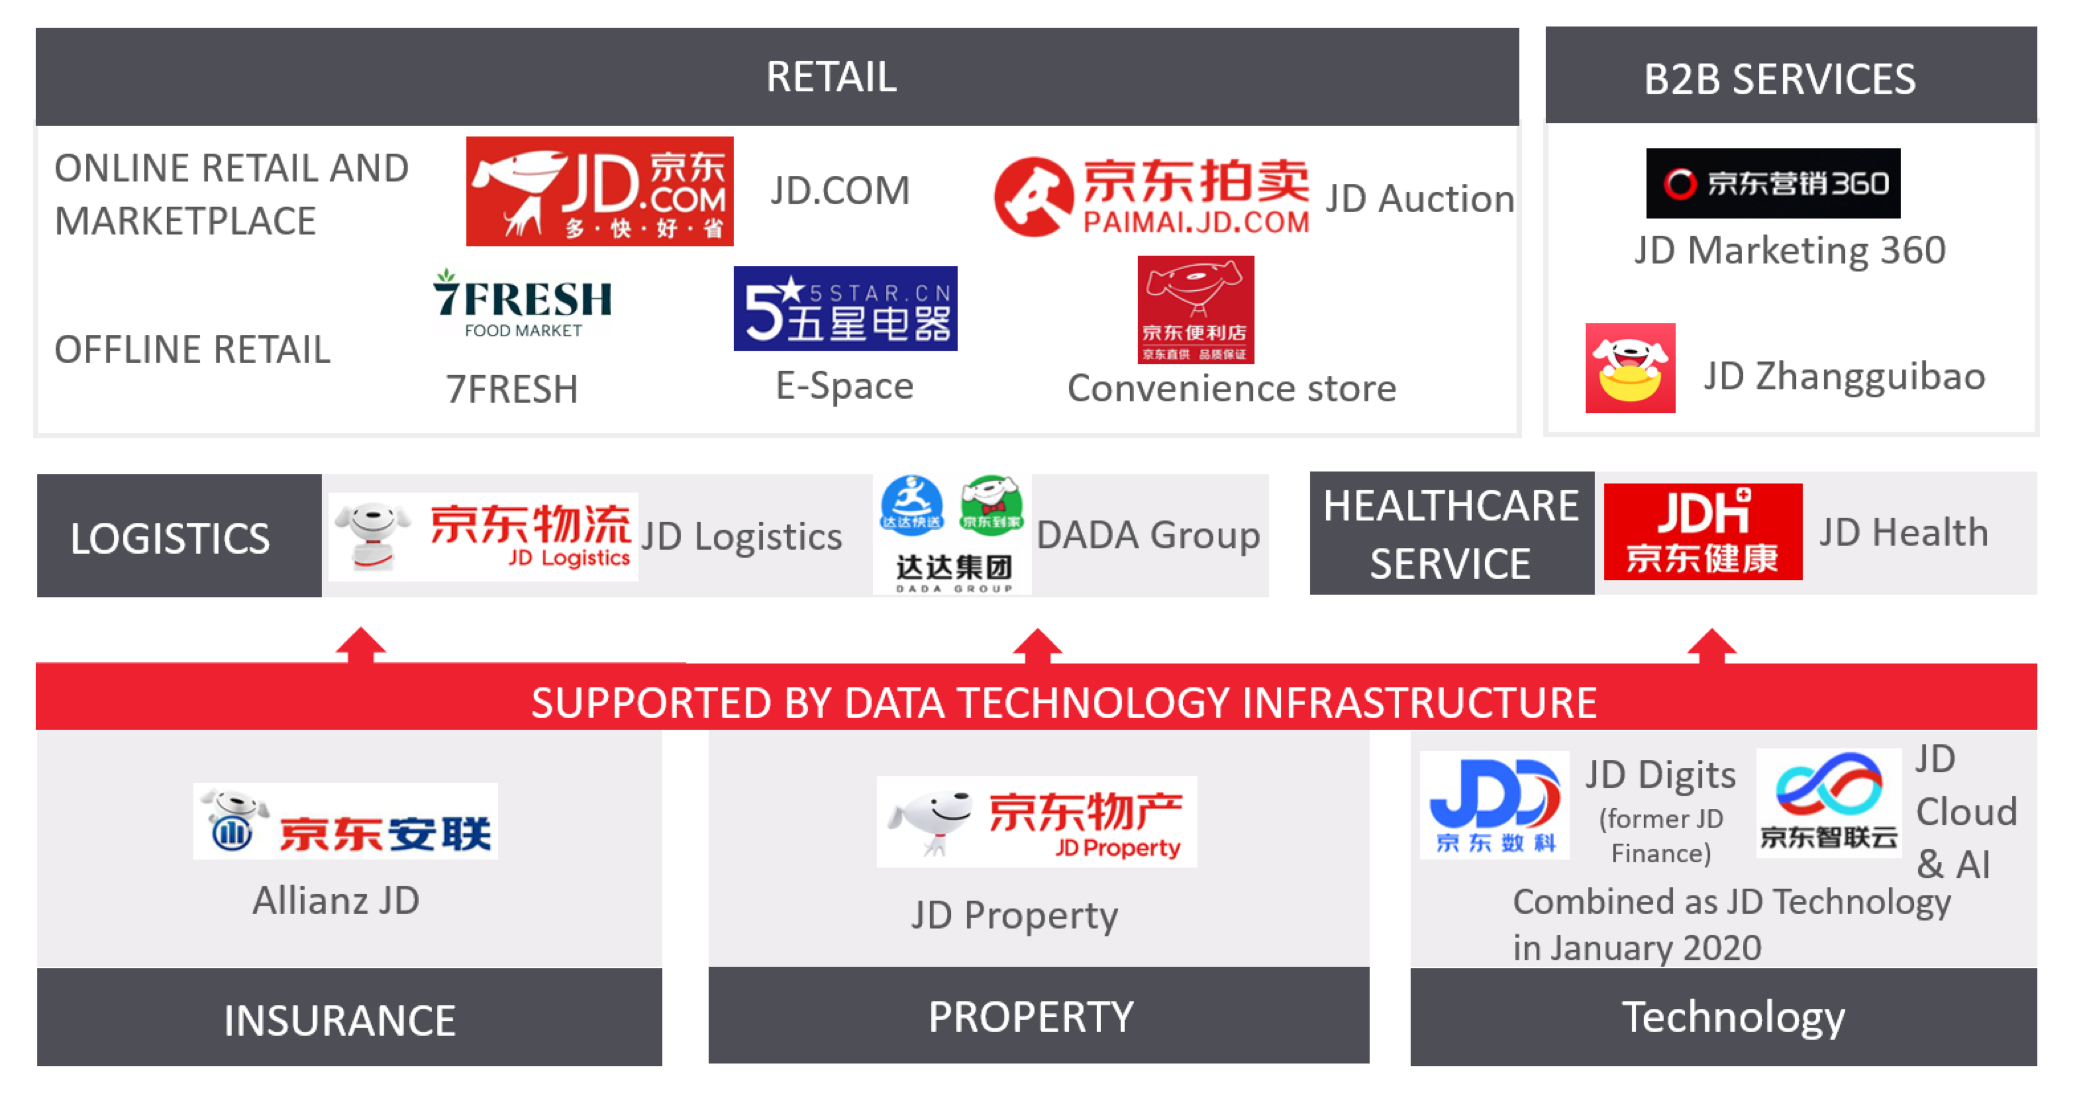 Source: Company reports/Coresight Research[/caption]
JD.com has had several business unit spin offs. JD Health, the healthcare arm of JD.com that focuses on online healthcare services such as doctor consultations and online pharmacy services, went public in December 2020 and its stock price surged on its debut on the Hong Kong stock market. There is also speculation regarding initial public offering (IPO) plans for JD Digits, formerly called JD Finance, which is designed to connect financial and physical industries with digital technology.
Where Are the Two Companies Heading?
We expect both companies to continue to develop in line with their own company cultures. Alibaba focuses on championing small businesses—promoting shared values such as community engagement and social responsibility no matter how large businesses may grow. On the other hand, JD.com focuses on becoming the most trusted company in the world, empowered by technology.
With Alibaba focusing on supporting small businesses, we expect the company to continue to use strategies such as New Retail to help digitalize small-sized businesses. JD.com will continue to invest in technology, particularly in areas such as logistics, to innovate the retail industry.
Although we have seen recent changes in leadership in both companies, we don’t expect this to bring about significant changes as both companies have established cultures. Alibaba’s founder Jack Ma is no longer involved in the day-to-day operations of the company, having stepped down from his role as chairman in September 2019. Daniel Zhang, a founding member of the Alibaba Partnership, took over as Chairman and CEO. Ma holds a 4.8% stake in Alibaba, as of 25 July 2020.
Richard Liu is Chairman and CEO of JD.com but stepped down as JD's legal representative, executive director and general manager, as well as from boards of nearly 50 subsidiaries, as of October 2019. Nevertheless, Liu still wields enormous influence in JD.com—the company's share structure gives Liu 78.4% of the voting power.
What We Think
Alibaba and JD.com are both innovators in retailing and technology in China; they are the country’s two largest e-commerce companies. In terms of business model, unlike JD.com, Alibaba does not conduct first-party e-commerce but operates only intermediary marketplaces that connect buyers and sellers.
Alibaba had a bigger share in China’s e-commerce market as of 2019—Alibaba accounted for a 42.7% share of the e-commerce market in China, while JD.com accounted for a 29.4% market share during the same period.
As for revenue growth, Alibaba’s revenue has grown at a faster pace, with a CAGR of 46.3% over the five years from fiscal 2016 to 2020, while JD.com saw a lower CAGR of 31.2% from 2015 to 2019.
Regarding profitability, Alibaba reported an operating margin of 17.9% in fiscal year 2020, which was more than ten times the 1.6% operating margin reported by JD.com at the end of 2019. This is partly due to JD.com’s first-party retail dragging down its profitability.
Internally developed technologies are primary growth drivers for both companies. Cloud Computing is the segment that is primarily driving the rapid growth of Alibaba’s revenue. For JD.com, its technology-focused logistics arm, JD Logistics, was its fastest growing segment in 2019.
Both companies are making significant investments in logistics. We have seen JD Logistics continuously evolve to offer faster delivery services, including Specified Time Delivery where shoppers can reserve a delivery within a specific time slot. Alibaba does not develop its own logistics systems, but it has been investing in logistics firms to expand its share of the delivery market.
Both companies have expanded their physical footprint in brick-and-mortar retail. Through its New Retail strategy, Alibaba is tapping into different business verticals such as entertainment, offline retail and utilities to fuel growth. JD.com is also focusing efforts on launching digitalized physical stores to explore new growth opportunities.
Implications for Brands/Retailers
- Given the example of JD.com’s first-party retail dragging down its margins, e-commerce platforms can consider alternatives such as a third-party retail business model.
- The omni connection of online and offline operations will continue to drive business. Brands and retailers can invest in digitalizing their offline businesses to offer frictionless shopping experience to consumers.
- Logistics will continue to play an important role in facilitating e-commerce sales. Brands and retailers should invest in these areas to provide smooth and convenient consumer shopping experiences.