
DIpil Das
What’s the Story?
Established over 80 years ago, Dollar General Corporation (referred to as Dollar General) is a US-based discount variety retailer and the country’s largest dollar store chain in terms of revenues and store count, as of January 2021. Its rival Dollar Tree, Inc. acquired discount retailer Family Dollar in 2015, solidifying its position as a major competitor in the US discount market. In this report, we provide an overview of both companies, including market share. We cover three key elements of the two discount retailer’s businesses—comprising revenue, profitability and store strategy.Why It Matters
Dollar General and Dollar Tree, Inc. are the two largest dollar store companies in the Coresight 100, our focus list of retail players. These two retailers make for insightful comparison given their similar business models of offering deeply discounted prices to customers whilst expanding their respective physical footprints, which continue to attract cost-conscious consumers.Dollar General vs. Dollar Tree: A Deep Dive
Company Overviews As shown in Figure 1, Dollar General and Dollar Tree, Inc. combined account for an 85.5% market share (five-year average) among discount variety retailers in the Coresight 100— which includes Big Lots, Five Below and Ollie’s Bargain Outlet. In 2014, the year prior to its acquisition of Family Dollar, Dollar Tree, Inc. held a 25.3% market share.Figure 1. Market Share: Dollar General vs. Dollar Tree, Inc. vs. Other Comparable Coresight 100 Discount Variety Retailers [caption id="attachment_131545" align="aligncenter" width="726"]
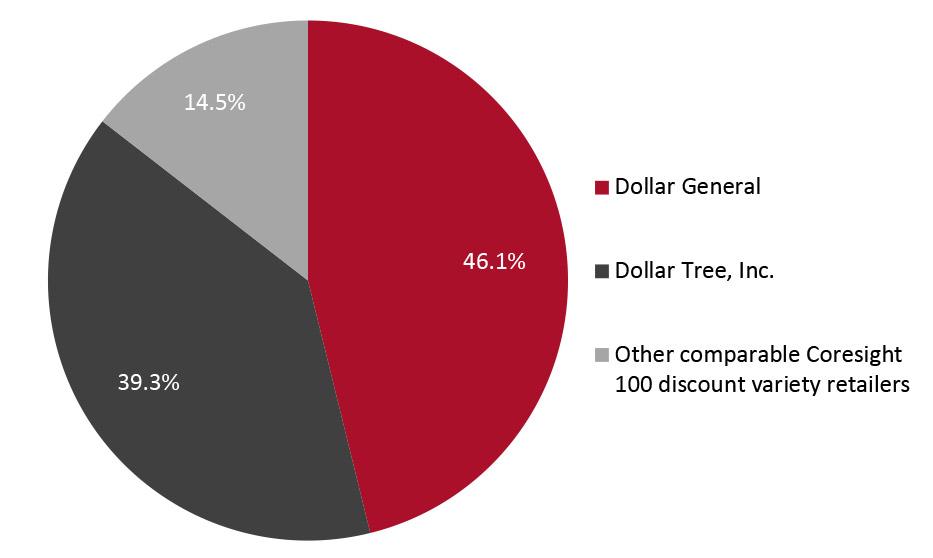 Other comparable Coresight 100 discount variety retailers include Big Lots Inc., Five Below Inc., and Ollie’s Bargain Outlet Holdings Inc. Total may not sum due to rounding.
 Source: S&P Capital IQ/company reports [/caption] Figure 2 provides an overview of key details relating to each company.
Figure 2. Company Overview: Dollar General vs. Dollar Tree, Inc. [wpdatatable id=1201]
*Throughout the report, fiscal years end in January of the following year (January 2021 for fiscal 2020) Source: S&P Capital IQ/company reports We discuss three key elements of the two discount retailers’ businesses—covering revenue, profitability and store strategy. 1. Revenue Dollar General sells a mix of products typically priced up to $10, with some ranging up to $20, across its four reporting product segments. Its consumables segment has a strong contribution history, with a three-year average contribution of 76.8% of total revenues, as shown in Figure 3. Sales for non-consumables have historically tailed far behind. Dollar General’s consumable segment sells food and household items such as cleaning and laundry products, packaged foods, perishables, and snacks, among other goods.
Figure 3. Three-Year Revenue Contribution, by Segment: Dollar General [caption id="attachment_131546" align="aligncenter" width="725"]
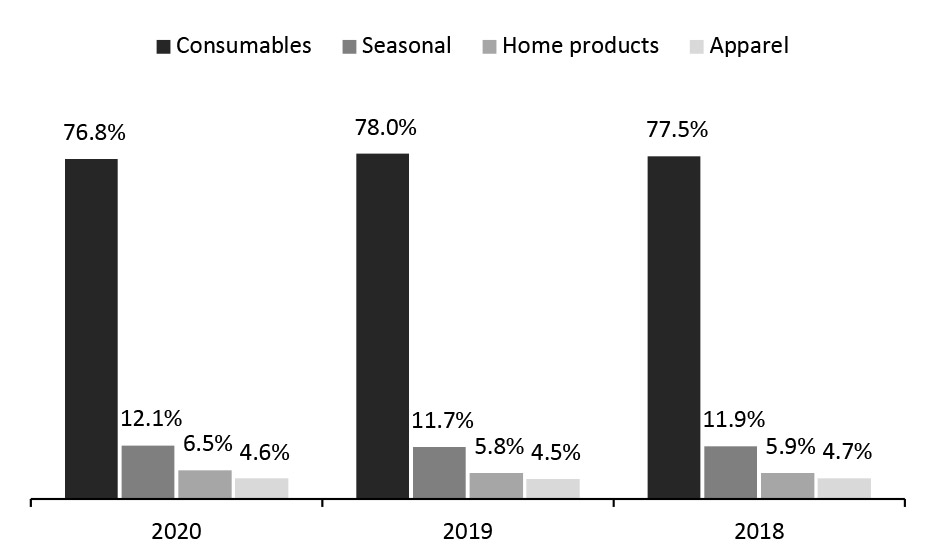 Source: S&P Capital IQ/company reports[/caption]
In July 2015, Dollar Tree, Inc. acquired Family Dollar, a leading national discount retailer in America. This acquisition segmented the Dollar Tree, Inc. revenue model into two brands—Dollar Tree and Family Dollar.
The Dollar Tree brand caters to suburban and middle-income shoppers while the Family Dollar brand caters to lower-income shoppers in rural and urban areas.
Since 2015, revenue contribution across the Dollar Tree and Family Dollar brands has been largely equal, with three-year averages of 52% and 48%, respectively.
By category, revenue contribution for Dollar Tree, Inc. approximately mirrors that of Dollar General—its consumable segment makes the largest contribution to top-line growth at 62% on a three-year average, as shown in Figure 4.
Source: S&P Capital IQ/company reports[/caption]
In July 2015, Dollar Tree, Inc. acquired Family Dollar, a leading national discount retailer in America. This acquisition segmented the Dollar Tree, Inc. revenue model into two brands—Dollar Tree and Family Dollar.
The Dollar Tree brand caters to suburban and middle-income shoppers while the Family Dollar brand caters to lower-income shoppers in rural and urban areas.
Since 2015, revenue contribution across the Dollar Tree and Family Dollar brands has been largely equal, with three-year averages of 52% and 48%, respectively.
By category, revenue contribution for Dollar Tree, Inc. approximately mirrors that of Dollar General—its consumable segment makes the largest contribution to top-line growth at 62% on a three-year average, as shown in Figure 4.
Figure 4. Three-Year Revenue Contribution, by Segment: Dollar Tree, Inc. [caption id="attachment_131547" align="aligncenter" width="726"]
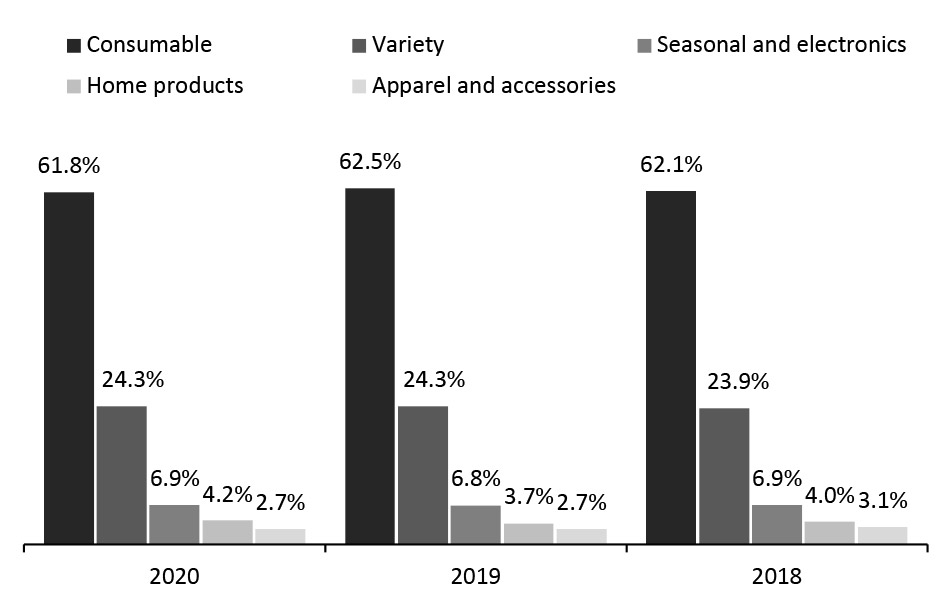 Source: S&P Capital IQ/company reports[/caption]
Revenue Growth
Both companies have maintained an upward revenue growth trend, with Dollar General recording a five-year CAGR of 8.7% from 2016 to 2020, and Dollar Tree, Inc. witnessing an 8.6% CAGR for the same period.
Dollar General’s growth has been supported by its aggressive store rollout strategy—the company has seen an average of 881 net store openings each year since 2018. In 2020, the company’s same-store sales growth increased by 16.3% year over year, a significant increase from previous years—Dollar General saw same-store growth of 3.9% and 3.2% in 2019 and 2020, respectively.
Overall, Dollar General generated revenue of $33.7 billion in fiscal 2020, as shown in Figure 5, solidifying the company as a market leader amongst other dollar store chains and discount variety stores under Coresight 100 coverage.
Source: S&P Capital IQ/company reports[/caption]
Revenue Growth
Both companies have maintained an upward revenue growth trend, with Dollar General recording a five-year CAGR of 8.7% from 2016 to 2020, and Dollar Tree, Inc. witnessing an 8.6% CAGR for the same period.
Dollar General’s growth has been supported by its aggressive store rollout strategy—the company has seen an average of 881 net store openings each year since 2018. In 2020, the company’s same-store sales growth increased by 16.3% year over year, a significant increase from previous years—Dollar General saw same-store growth of 3.9% and 3.2% in 2019 and 2020, respectively.
Overall, Dollar General generated revenue of $33.7 billion in fiscal 2020, as shown in Figure 5, solidifying the company as a market leader amongst other dollar store chains and discount variety stores under Coresight 100 coverage.
Figure 5. Revenue (Left Axis; USD Bil.) and YoY % Change (Right Axis): Dollar General [caption id="attachment_131548" align="aligncenter" width="724"]
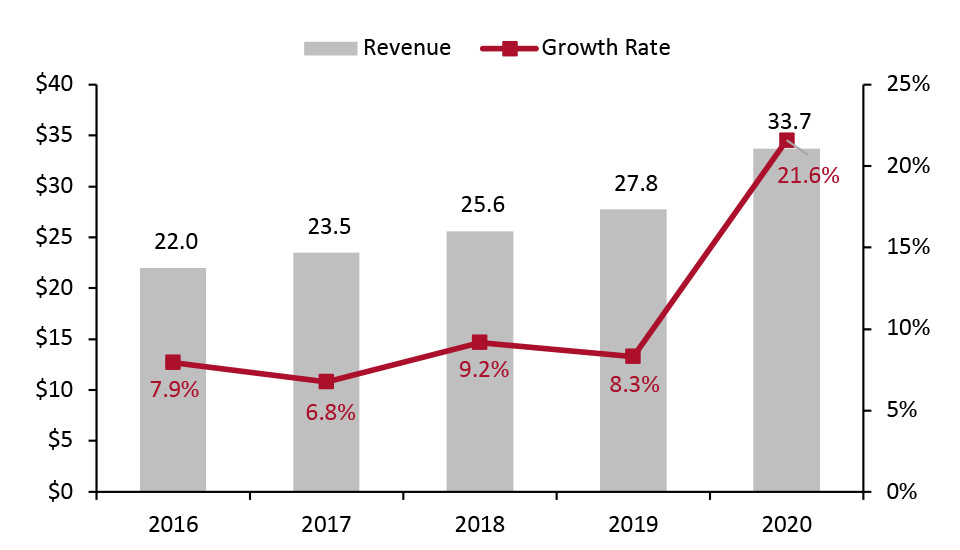 Source: S&P Capital IQ/company reports[/caption]
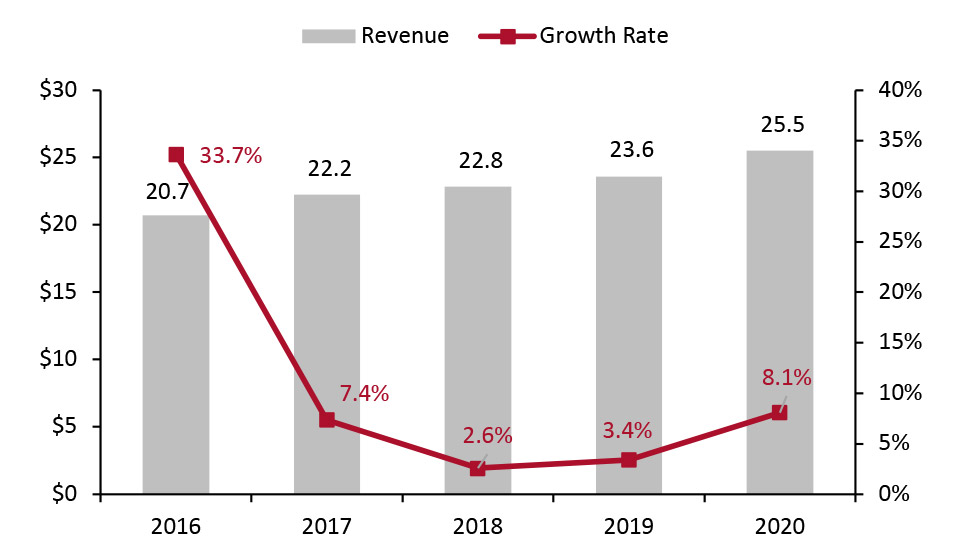
Dollar Tree, Inc. has maintained its revenue growth by developing a broad-ranging offering across a variety of product segments. The company stated the acquisition of Family Dollar in 20215 was geared toward offering a wider and more compelling merchandise assortment, to offer greater value to a large consumer base.
Same-store sales increased by 6.1% year over year in its fiscal 2020 while sales by the company’s brand segments Family Dollar and Dollar Tree increased by 10.5% and 2.2%, respectively.
In terms of overall revenue, the company’s acquisition of Family Dollar led to a 33.7% spike in revenue, as shown in Figure 6. in 2016. Revenue growth has since returned to single digits for the discount retailer, with a notable uptick in 2020.
Source: S&P Capital IQ/company reports[/caption]
Dollar Tree, Inc. has maintained its revenue growth by developing a broad-ranging offering across a variety of product segments. The company stated the acquisition of Family Dollar in 20215 was geared toward offering a wider and more compelling merchandise assortment, to offer greater value to a large consumer base.
Same-store sales increased by 6.1% year over year in its fiscal 2020 while sales by the company’s brand segments Family Dollar and Dollar Tree increased by 10.5% and 2.2%, respectively.
In terms of overall revenue, the company’s acquisition of Family Dollar led to a 33.7% spike in revenue, as shown in Figure 6. in 2016. Revenue growth has since returned to single digits for the discount retailer, with a notable uptick in 2020.
Figure 6. Revenue (Left Axis; USD Bil.) and YoY % Change (Right Axis): Dollar Tree, Inc. [caption id="attachment_131549" align="aligncenter" width="725"]
 Source: S&P Capital IQ/company reports[/caption]
Revenue Disparity
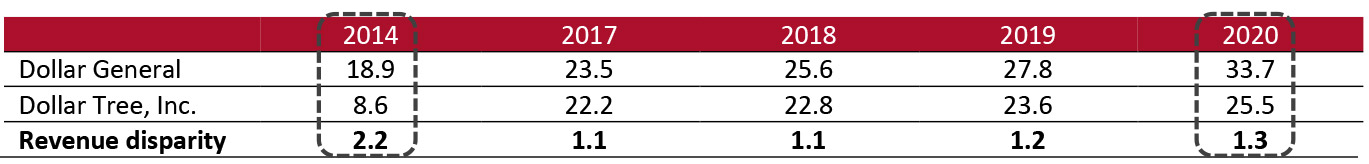
Prior to the acquisition of Family Dollar, Dollar Tree, Inc. was half the size of Dollar General in revenue terms, as indicated in Figure 7 with the pre-acquisition revenue disparity of 2.2 for 2014.
Dollar Tree’s acquisition of Family Dollar pushed the company’s sales to exceed $15.0 billion—compared to $8.6 billion in the prior year. As such, the revenue disparity between the two companies (expressed as a multiple) has significantly decreased and remained much lower, coming in at 1.3 in 2020.
Source: S&P Capital IQ/company reports[/caption]
Revenue Disparity
Prior to the acquisition of Family Dollar, Dollar Tree, Inc. was half the size of Dollar General in revenue terms, as indicated in Figure 7 with the pre-acquisition revenue disparity of 2.2 for 2014.
Dollar Tree’s acquisition of Family Dollar pushed the company’s sales to exceed $15.0 billion—compared to $8.6 billion in the prior year. As such, the revenue disparity between the two companies (expressed as a multiple) has significantly decreased and remained much lower, coming in at 1.3 in 2020.
Figure 7. Revenue Disparity: Dollar General vs. Dollar Tree, Inc. [caption id="attachment_131550" align="aligncenter" width="726"]
 Source: S&P Capital IQ/company reports[/caption]
2. Profitability
Operating Margin
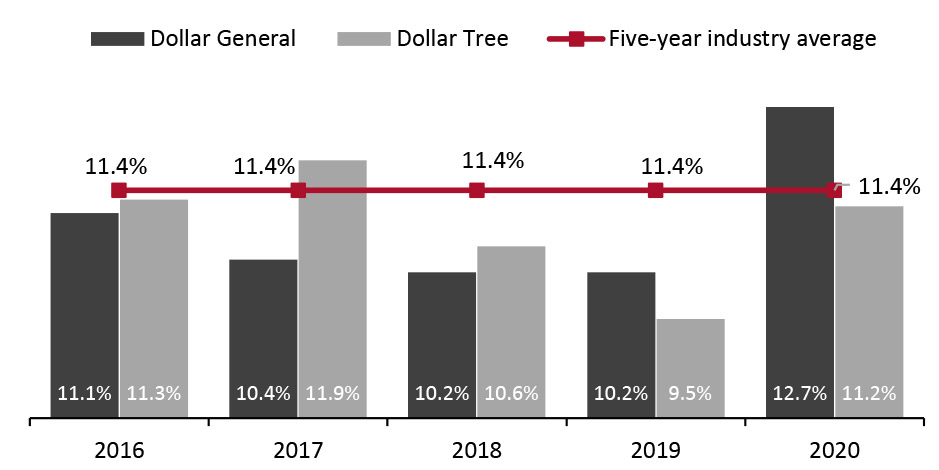
Historically, Dollar Tree, Inc. has reported a better operating margin than Dollar General, albeit with only marginal differences, but 2019 and 2020 bucked this trend, as shown in Figure 8.
Both companies have maintained a five-year average margin of 10.9%, which falls within the purview of the discount retail industry five-year average of 11.4%. We calculated this average using other discount variety retailers in the Coresight 100 companies, comprising Big Lots, Five Below and Ollie’s Bargain Outlet.
The operating margins reported by both companies in fiscal 2020 improved notably—with an increase of 2.5 percentage points for Dollar General and 1.7 percentage points for Dollar Tree, Inc. This increase can be attributed to the impact of the Covid-19 crisis in 2020 as demand for essentials increased and many consumers prioritized value purchases.
Source: S&P Capital IQ/company reports[/caption]
2. Profitability
Operating Margin
Historically, Dollar Tree, Inc. has reported a better operating margin than Dollar General, albeit with only marginal differences, but 2019 and 2020 bucked this trend, as shown in Figure 8.
Both companies have maintained a five-year average margin of 10.9%, which falls within the purview of the discount retail industry five-year average of 11.4%. We calculated this average using other discount variety retailers in the Coresight 100 companies, comprising Big Lots, Five Below and Ollie’s Bargain Outlet.
The operating margins reported by both companies in fiscal 2020 improved notably—with an increase of 2.5 percentage points for Dollar General and 1.7 percentage points for Dollar Tree, Inc. This increase can be attributed to the impact of the Covid-19 crisis in 2020 as demand for essentials increased and many consumers prioritized value purchases.
Figure 8. Operating Margin: Dollar General vs. Dollar Tree, Inc. (Incl. Five-Year Industry Average) [caption id="attachment_131551" align="aligncenter" width="725"]
 Source: S&P Capital IQ/company reports[/caption]
Net Profit
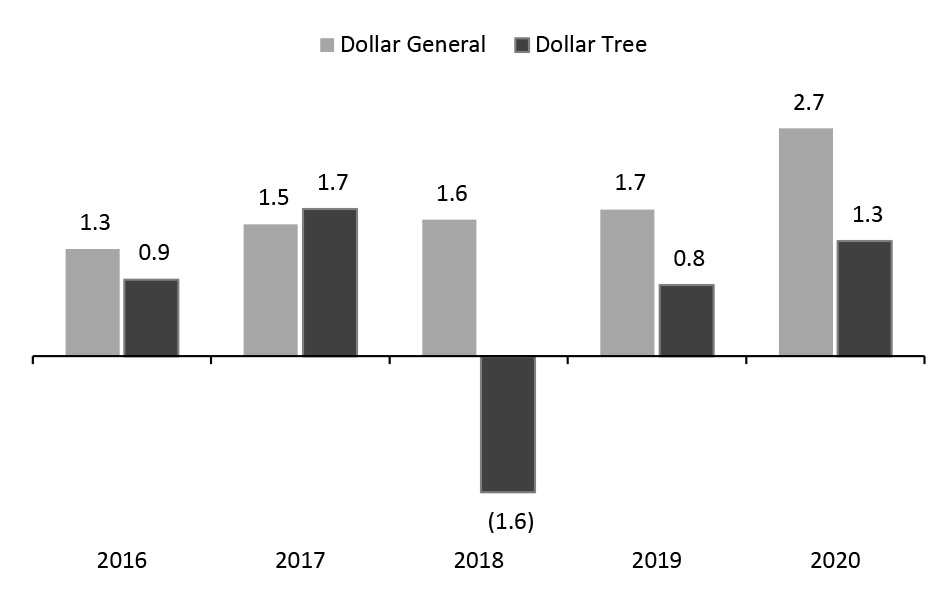
Net profitability over the years has largely been positive for both companies, as shown in Figure 9. Dollar General has sustained net income growth since 2017, with its net income margin averaging 6.5% from 2016 to 2020.
Dollar Tree, Inc. recorded a notable exception in 2018 with a $1.6 billion loss, owing to the to the ongoing assessment of Family Dollar stores, which led to refurbishments and closures of underperforming stores in the reporting year. The closures were made in a bid to reposition the Family Dollar brand for longer-term benefits, according to the company.
The renovated Family Dollar brand locations were expanded to accommodate the sale of alcohol and include a $1 Dollar Tree merchandise section. Dollar Tree, Inc. returned to profitability in 2019 with net gains of $0.8 billion and a net income gain of $1.3 billion in fiscal 2020.
Source: S&P Capital IQ/company reports[/caption]
Net Profit
Net profitability over the years has largely been positive for both companies, as shown in Figure 9. Dollar General has sustained net income growth since 2017, with its net income margin averaging 6.5% from 2016 to 2020.
Dollar Tree, Inc. recorded a notable exception in 2018 with a $1.6 billion loss, owing to the to the ongoing assessment of Family Dollar stores, which led to refurbishments and closures of underperforming stores in the reporting year. The closures were made in a bid to reposition the Family Dollar brand for longer-term benefits, according to the company.
The renovated Family Dollar brand locations were expanded to accommodate the sale of alcohol and include a $1 Dollar Tree merchandise section. Dollar Tree, Inc. returned to profitability in 2019 with net gains of $0.8 billion and a net income gain of $1.3 billion in fiscal 2020.
Figure 9. Net Profit: Dollar General vs. Dollar Tree, Inc. (USD Bil.) [caption id="attachment_131552" align="aligncenter" width="725"]
 Source: S&P Capital IQ/company reports[/caption]
3. Store Strategy
Store Formats
Within its 17,000 US stores, Dollar General has multiple store formats, comprising:
Source: S&P Capital IQ/company reports[/caption]
3. Store Strategy
Store Formats
Within its 17,000 US stores, Dollar General has multiple store formats, comprising:
- Traditional stores: 7,300 square feet of sales space
- Small-format: 6,000 square feet of sales space
- Large store formats (introduced in 2020): 8,500 square feet and 9,500 square feet of sales space
- Dollar Tree brand stores: 8,640 square feet of sales space
- Family Dollar brand stores: 8,460 square feet of sales space
Figure 10. Sales per Square Foot (USD): Dollar General vs. Dollar Tree, Inc. [caption id="attachment_131553" align="aligncenter" width="725"]
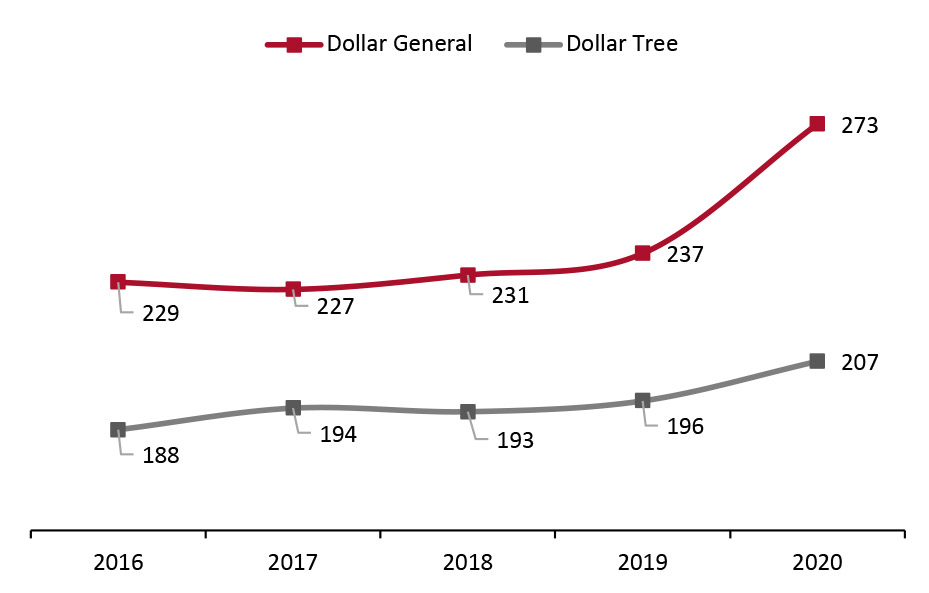 Source: Company reports[/caption]
Expansion Plans
Bucking the retail trend of store closures, Dollar General has announced plans to open 1,050 new stores, remodel 1,750 stores and relocate 100 stores in fiscal 2021. The retailer opened 1,000 new stores, remodeled 1,670 stores and relocated 110 stores in fiscal 2020.
Dollar General has also announced that it will accelerate store openings for Pop Shelf—its new store format featuring a range of home and beauty goods—which is so far exceeding sales and gross margin expectations, according to company management. Dollar General operates 17,266 stores across 46 US states, as of 30 January 2021.
Source: Company reports[/caption]
Expansion Plans
Bucking the retail trend of store closures, Dollar General has announced plans to open 1,050 new stores, remodel 1,750 stores and relocate 100 stores in fiscal 2021. The retailer opened 1,000 new stores, remodeled 1,670 stores and relocated 110 stores in fiscal 2020.
Dollar General has also announced that it will accelerate store openings for Pop Shelf—its new store format featuring a range of home and beauty goods—which is so far exceeding sales and gross margin expectations, according to company management. Dollar General operates 17,266 stores across 46 US states, as of 30 January 2021.
- Click here for more Coresight Research coverage of US store closures and openings.
What We Think
- Dollar General and Dollar Tree Inc. are big winners in US store-based retailing, with largely unrivalled expansion strategies. Their deeply discounted price model provides a strong advantage for both companies in the current retail market.
- The operating margins reported by both companies in fiscal 2020 improved notably. We believe this can attributed to the impact of the Covid-19 crisis in 2020 as demand for essentials increased and many consumers prioritized value purchases.
- We expect Dollar General and Dollar Tree, Inc. will continue to refine their offerings and capabilities for local US markets in order to sustain their revenue and remain relevant as they target suburban, urban and middle-income shoppers.