DIpil Das
US shoppers say they will spend an average $86.27 on Halloween festivities this year, down slightly from last year’s record average of $86.79 per person, according to data recently released by the NRF and Prosper Insights & Analytics. In total, US consumers are expected to spend $8.8 billion this year, also down slightly from $9 billion in 2018 which was also slightly less than the $9.1 billion spent in 2017. While total spend has declined slightly in recent years, the longer-term trend has been slow but steady growth, from $3.3 billion in 2005 to $8.8 billion in 2019.
The NRF estimates consumers will spend $3.2 billion on costumes (purchased by 67% of Halloween shoppers), $2.6 billion on candy (95% of shoppers), $2.7 billion on decorations (72%) and $390 million on greeting cards (34%).
[caption id="attachment_97704" align="aligncenter" width="700"]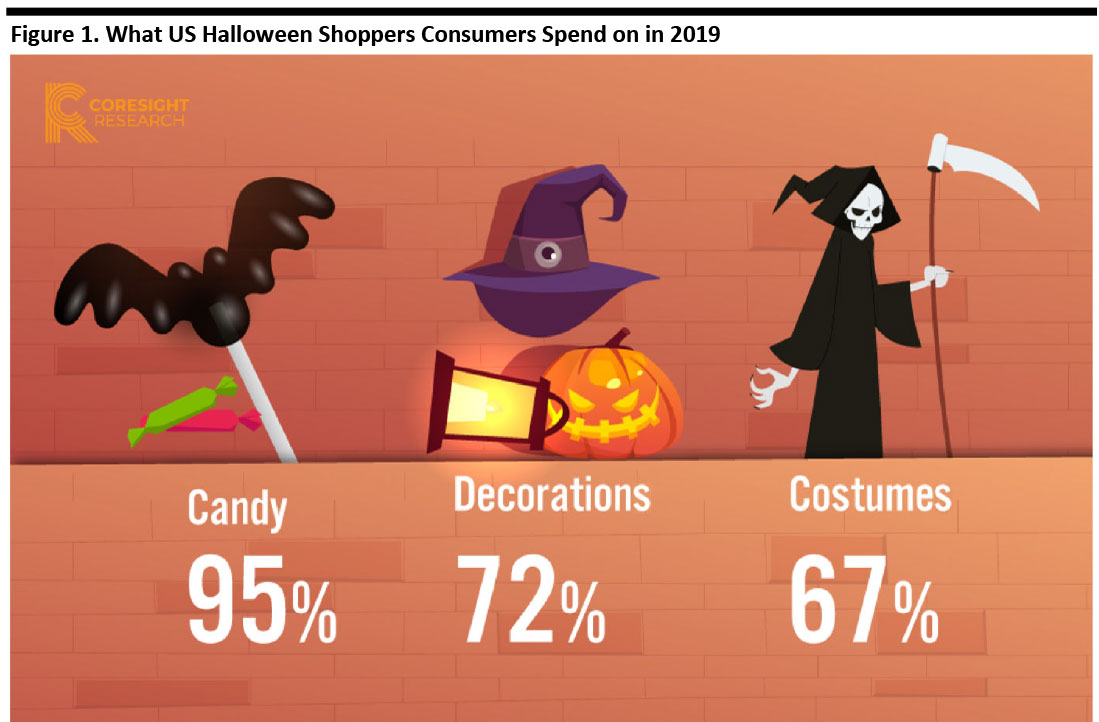 Source: NRF/Prosper Insights & Analytics[/caption]
Around 68% of those surveyed said they plan to celebrate Halloween this year, or 172 million people, down from 175 million last year.
Among those participating, 69% plan to hand out candy, 49% will decorate their home or yard, 47% will dress in costume, 44% will carve a pumpkin, 32% will throw or attend a party, 29% will take their children trick-or-treating and 22% will visit a haunted house. Animals are also getting in on the action: 17% of those surveyed – around 29 million people – plan to dress their pets in costume.
Younger adults are more likely to participate, though average spend peaks slightly older, in the mid-30s to mid-40s age group—likely due to the presence of children in households.
[caption id="attachment_97700" align="aligncenter" width="700"]
Source: NRF/Prosper Insights & Analytics[/caption]
Around 68% of those surveyed said they plan to celebrate Halloween this year, or 172 million people, down from 175 million last year.
Among those participating, 69% plan to hand out candy, 49% will decorate their home or yard, 47% will dress in costume, 44% will carve a pumpkin, 32% will throw or attend a party, 29% will take their children trick-or-treating and 22% will visit a haunted house. Animals are also getting in on the action: 17% of those surveyed – around 29 million people – plan to dress their pets in costume.
Younger adults are more likely to participate, though average spend peaks slightly older, in the mid-30s to mid-40s age group—likely due to the presence of children in households.
[caption id="attachment_97700" align="aligncenter" width="700"]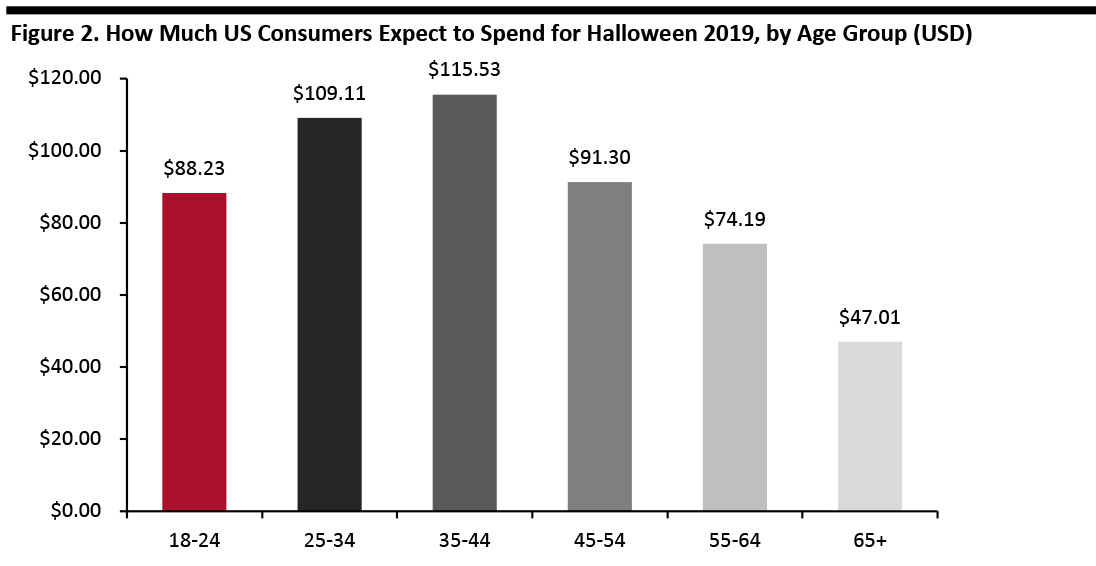 Source: NRF/Prosper Insights & Analytics[/caption]
Online Emerges as a Favorite Destination for Costume Inspiration
Online search remains the top source of Halloween inspiration, cited by 35% of consumers surveyed, followed by browsing in stores at 28%. Just 20% will get ideas from friends and family.
Social media’s sway has increased steadily since 2015, and we are seeing clear patterns emerge. Pinterest was cited by 18% as the inspiration destination of choice, up from 13% last year, while 14% cited YouTube (up from 8%) and Instagram (up from 7%).
Men and women also prefer different social media channels: Pinterest was the choice of 25% of women but only 12% of men, while YouTube was cited by 19% of men but only 10% of women. Instagram was almost evenly split at 15% of men and 14% of women.
By age, Instagram, Pinterest and YouTube see very strong spikes in use among the youngest adult age groups, with one-third or more of 18-24 year olds turning to Instagram or Pinterest for costume inspiration.
[caption id="attachment_97701" align="aligncenter" width="700"]
Source: NRF/Prosper Insights & Analytics[/caption]
Online Emerges as a Favorite Destination for Costume Inspiration
Online search remains the top source of Halloween inspiration, cited by 35% of consumers surveyed, followed by browsing in stores at 28%. Just 20% will get ideas from friends and family.
Social media’s sway has increased steadily since 2015, and we are seeing clear patterns emerge. Pinterest was cited by 18% as the inspiration destination of choice, up from 13% last year, while 14% cited YouTube (up from 8%) and Instagram (up from 7%).
Men and women also prefer different social media channels: Pinterest was the choice of 25% of women but only 12% of men, while YouTube was cited by 19% of men but only 10% of women. Instagram was almost evenly split at 15% of men and 14% of women.
By age, Instagram, Pinterest and YouTube see very strong spikes in use among the youngest adult age groups, with one-third or more of 18-24 year olds turning to Instagram or Pinterest for costume inspiration.
[caption id="attachment_97701" align="aligncenter" width="700"]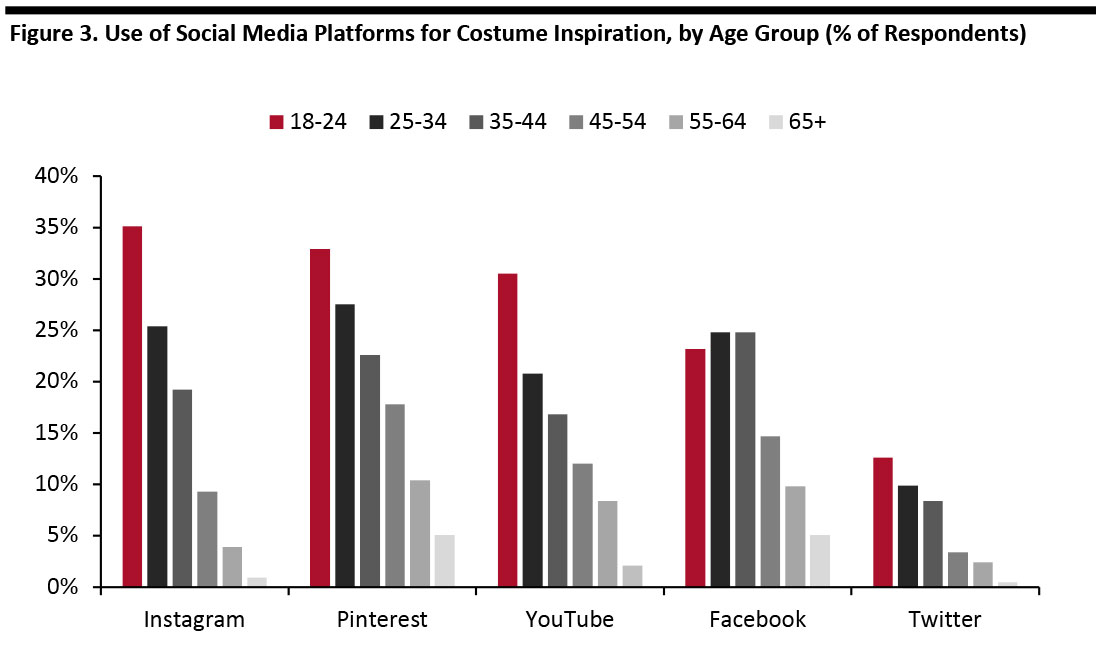 Source: NRF/Prosper Insights & Analytics[/caption]
Where People Will Shop
To buy Halloween merchandise, 42% of shoppers will go to a discount store and 36% to a specialty Halloween or costume store; 25% will shop online, another 25% will go to a grocery store and 23% will visit a department store.
The ongoing trade issue with China is causing consumer uncertainty, and 14% of those surveyed said concerns about the economy will impact Halloween plans. That said, most Halloween merchandise was in the country before a 15% tariff on consumer goods took effect September 1.
Top Costumes
As Halloween in the US is generally a children’s holiday, costume choices do not change much from one year to the next – although for adults, costume tastes vary more.
This year, an estimated 3.1 million children will dress up as their favorite princess, 2.4 million as their favorite superhero, 2 million as Spider-Man, 1.5 million as an Avengers character other than Spider-Man and 1.4 million as Batman.
Here are the top 10 choices for children, adults and their pets:
[caption id="attachment_97709" align="aligncenter" width="700"]
Source: NRF/Prosper Insights & Analytics[/caption]
Where People Will Shop
To buy Halloween merchandise, 42% of shoppers will go to a discount store and 36% to a specialty Halloween or costume store; 25% will shop online, another 25% will go to a grocery store and 23% will visit a department store.
The ongoing trade issue with China is causing consumer uncertainty, and 14% of those surveyed said concerns about the economy will impact Halloween plans. That said, most Halloween merchandise was in the country before a 15% tariff on consumer goods took effect September 1.
Top Costumes
As Halloween in the US is generally a children’s holiday, costume choices do not change much from one year to the next – although for adults, costume tastes vary more.
This year, an estimated 3.1 million children will dress up as their favorite princess, 2.4 million as their favorite superhero, 2 million as Spider-Man, 1.5 million as an Avengers character other than Spider-Man and 1.4 million as Batman.
Here are the top 10 choices for children, adults and their pets:
[caption id="attachment_97709" align="aligncenter" width="700"]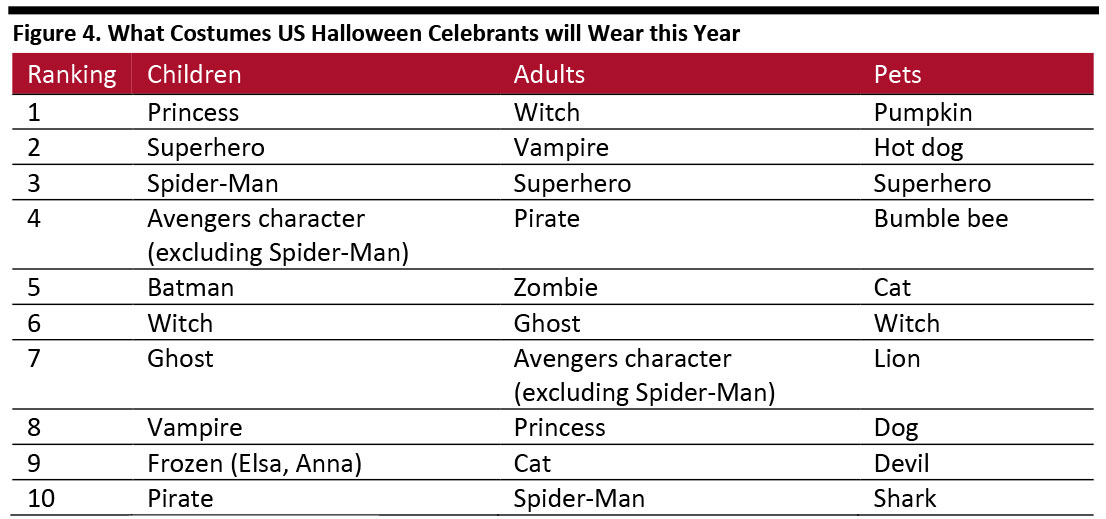 Source: NRF/Prosper Insights & Analytics[/caption]
The survey of 7,419 consumers was conducted September 3-10 and has a margin of error of plus or minus 1.2 percentage points.
Source: NRF/Prosper Insights & Analytics[/caption]
The survey of 7,419 consumers was conducted September 3-10 and has a margin of error of plus or minus 1.2 percentage points.
Source: NRF/Prosper Insights & Analytics[/caption]
Around 68% of those surveyed said they plan to celebrate Halloween this year, or 172 million people, down from 175 million last year.
Among those participating, 69% plan to hand out candy, 49% will decorate their home or yard, 47% will dress in costume, 44% will carve a pumpkin, 32% will throw or attend a party, 29% will take their children trick-or-treating and 22% will visit a haunted house. Animals are also getting in on the action: 17% of those surveyed – around 29 million people – plan to dress their pets in costume.
Younger adults are more likely to participate, though average spend peaks slightly older, in the mid-30s to mid-40s age group—likely due to the presence of children in households.
[caption id="attachment_97700" align="aligncenter" width="700"] Source: NRF/Prosper Insights & Analytics[/caption]
Online Emerges as a Favorite Destination for Costume Inspiration
Online search remains the top source of Halloween inspiration, cited by 35% of consumers surveyed, followed by browsing in stores at 28%. Just 20% will get ideas from friends and family.
Social media’s sway has increased steadily since 2015, and we are seeing clear patterns emerge. Pinterest was cited by 18% as the inspiration destination of choice, up from 13% last year, while 14% cited YouTube (up from 8%) and Instagram (up from 7%).
Men and women also prefer different social media channels: Pinterest was the choice of 25% of women but only 12% of men, while YouTube was cited by 19% of men but only 10% of women. Instagram was almost evenly split at 15% of men and 14% of women.
By age, Instagram, Pinterest and YouTube see very strong spikes in use among the youngest adult age groups, with one-third or more of 18-24 year olds turning to Instagram or Pinterest for costume inspiration.
[caption id="attachment_97701" align="aligncenter" width="700"] Source: NRF/Prosper Insights & Analytics[/caption]
Where People Will Shop
To buy Halloween merchandise, 42% of shoppers will go to a discount store and 36% to a specialty Halloween or costume store; 25% will shop online, another 25% will go to a grocery store and 23% will visit a department store.
The ongoing trade issue with China is causing consumer uncertainty, and 14% of those surveyed said concerns about the economy will impact Halloween plans. That said, most Halloween merchandise was in the country before a 15% tariff on consumer goods took effect September 1.
Top Costumes
As Halloween in the US is generally a children’s holiday, costume choices do not change much from one year to the next – although for adults, costume tastes vary more.
This year, an estimated 3.1 million children will dress up as their favorite princess, 2.4 million as their favorite superhero, 2 million as Spider-Man, 1.5 million as an Avengers character other than Spider-Man and 1.4 million as Batman.
Here are the top 10 choices for children, adults and their pets:
[caption id="attachment_97709" align="aligncenter" width="700"] Source: NRF/Prosper Insights & Analytics[/caption]
The survey of 7,419 consumers was conducted September 3-10 and has a margin of error of plus or minus 1.2 percentage points.