Source: Company reports
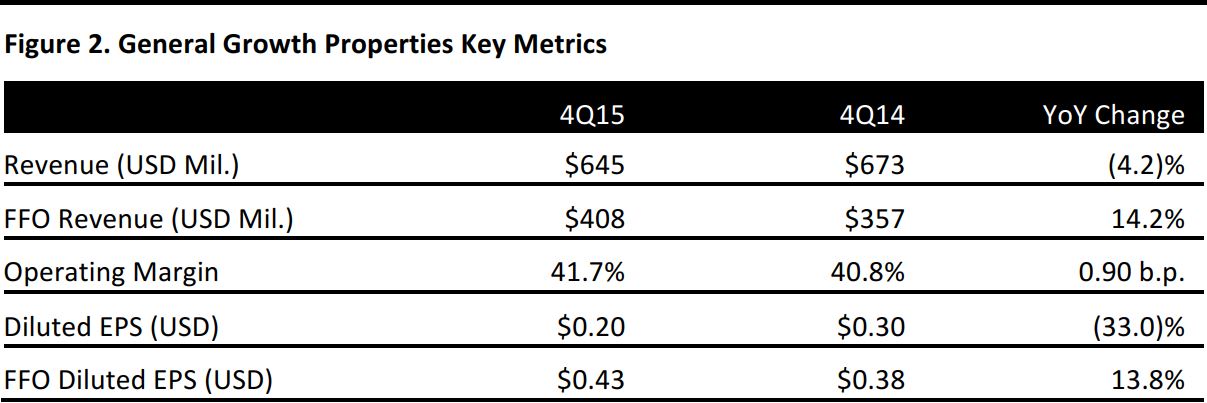
General Growth reported 4Q15 FFO of $408.2 million, or 43 cents per share. The REIT said its revenues were down 4.2% year over year, to $645 million, but they beat the consensus estimate of $625.8 million. The year-ago 4Q results included a tax-related gain of $77.2 million. FFO is a closely watched measure in the REIT industry that takes net income and adds back items such as depreciation and amortization.
The increase was driven by rental rates for signed leases in the previous 12 months, which rose by 10.8%, or $6.32 per square foot, to $64.92 per square foot when compared to the rental rate of expiring leases. Tenant sales, excluding anchor stores, rose by 2.8%, to $21 billion, on a trailing 12-month basis. Tenant sales for properties of less than 10,000 square feet increased by 3.0%, to $588 per square foot, on a trailing 12-month basis.
Meanwhile, the percentage of leased properties on a same-store basis was 96.9%, compared with 97.2% a year earlier.
Comparable net operating income increased by 6.7% year over year, to $624 million. Overall, General Growth reported a profit of $194 million, or 20 cents a share, compared with $289.5 million, or 30 cents a share, a year earlier.
Since exiting bankruptcy in 2010, the second-largest mall owner in the US by number of properties has been shifting its focus to high-end urban addresses such as Manhattan’s Fifth Avenue and Chicago’s Michigan Avenue.
For the full-year 2015, the company reported FFO of $1.38 billion, or $1.44 per share, for EPS growth of 22.9%. Revenue was reported as $2.4 billion.
Guidance
The company raised a key projection for the year despite the revenue decline. It now projects FFO of $1.52–$1.56 a share, compared with its earlier guidance of $1.51–$1.55 and the consensus estimate of $1.54. For the first quarter of 2016, General Growth expects FFO of $0.34–$0.36 per diluted share, compared with the consensus estimate of $0.34.