DIpil Das
US Retail Traffic and In-Store Metrics: February 2022
The Coresight Research US Retail Traffic and In-Store Metrics series reviews changes in selected store-based metrics, as reported by RetailNext. In this month’s report, we review store traffic changes through February 2022—which saw a substantial improvementn traffic growth compared to January, with trends supported by President’s Day holiday shopping on February 21 and the decline in Covid-19 cases. Year-over-year changes are our core metric for store-based data; however, due to Covid-19 all data in this report from March to July 2021 is compared to 2019 (pre-pandemic), because stores began closing in March 2020 and there were widespread store closures from April to July 2020. From August 2021 onward, the comparison is made on a year-over-year basis. February 2022 saw an accelerated growth in traffic trends. Traffic registered 31.9% growth in February, higher than January’s 26.9% increase year over year. The improvement in traffic growth was seen due to the decline in the number of covid-19 cases and President’s Day holiday shopping. Our latest US Consumer Tracker survey, undertaken on March 7, found a marked reduction in consumer avoidance of public places including shops and shopping centers, suggesting strengthening traffic trends are likely to be continuing into March.- In February, ATV (average transaction value, or sales divided by transactions) increased by 7.9%, 3.0 percentage points lower than January’s growth of 10.9%, reflecting an apparent deconsolidation of shopping trips as consumers return to stores.
- The conversion rate (sales transactions as a percentage of traffic) decreased by 2.0 percentage points in February, versus January’s 1.7 percentage points decline year over year.
- Shopper yield (sales divided by traffic) increased by 0.4% in February, lower than January’s 0.7% growth year over year.
- Unit per transaction (number of items purchased divided by number of transactions) decreased by 3.5% in February, lower than January’s 4.5% decline.
- Average unit retail (net sales divided by units sold) increased by 13.7% in February, lower than January’s 16.9% growth year over year.
Figure 1. US Store-Based Traffic and Sales: YoY % Change [caption id="attachment_143264" align="aligncenter" width="700"]
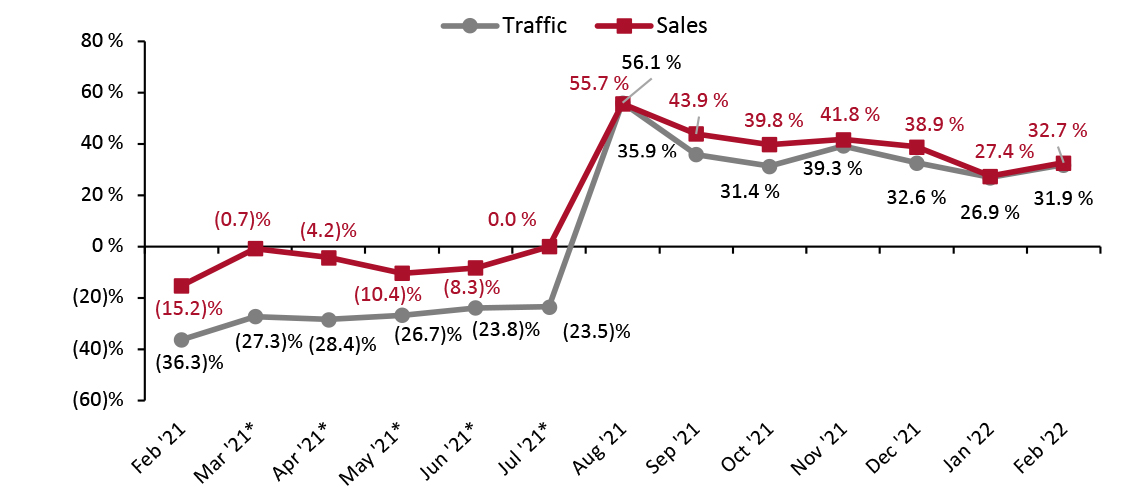 *March–July 2021 numbers are two-year % change due to store closures in the comparable period in 2020
 Source: RetailNext [/caption]
Figure 2. US Store-Based Nonfood Retail Metrics: YoY % Change [caption id="attachment_143265" align="aligncenter" width="700"]
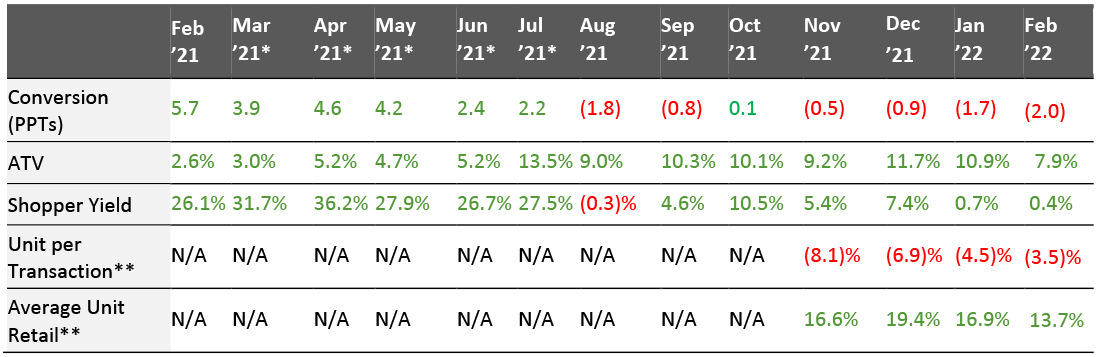 ATV=average transaction value; Shopper yield=Sales divided by traffic
 *March–July 2021 numbers are two-year % change due to store closures in the comparable period in 2020
**RetailNext started providing data on these from November 2021
Source: RetailNext [/caption] Weekly Shopper Traffic Trends Weekly data for February tracks the progress of store traffic over four weeks (January 30, 2022–February 26, 2022):
- In the first week of February, traffic was weakest due to the impact of winter storms across the country. Traffic increased by 25.5% in the first week of February, a decrease from January’s final week 28.4% growth.
- As the month progressed, traffic performance showed an improved trend. The fourth week witnessed the strongest traffic trend, with growth of 39.7% on a year-over-year basis, driven by President’s Day holiday shopping and a decrease in Covid-19 cases.
- In February, apparel was the best-performing category and saw a traffic increase of 50.8% year-over-year, about 1000 basis point higher than January. Traffic trends in the apparel category was strongest in the fourth week, supported by customers shopping during the President’s Day holiday.
- The health and beauty category performed second-best in traffic trends in February, with an increase in traffic by 30.3% year-over-year, 30 basis points higher than January.
- Footwear saw a traffic increase of 29.0% on a year-over-year basis, declining 430 basis points from January.
- Traffic in the jewelry category increased by 24.9% year-over-year. The third week of February witnessed the strongest traffic trends as shoppers purchased jewelry for Valentine’s Day.
- The softest growth was seen in the home category compared to other categories. The home category recorded a 15.3% increase in traffic year over year, 880 basis points higher than January.
Figure 3. US Retail Traffic by Industry Vertical: YoY % Change [caption id="attachment_143266" align="aligncenter" width="700"]
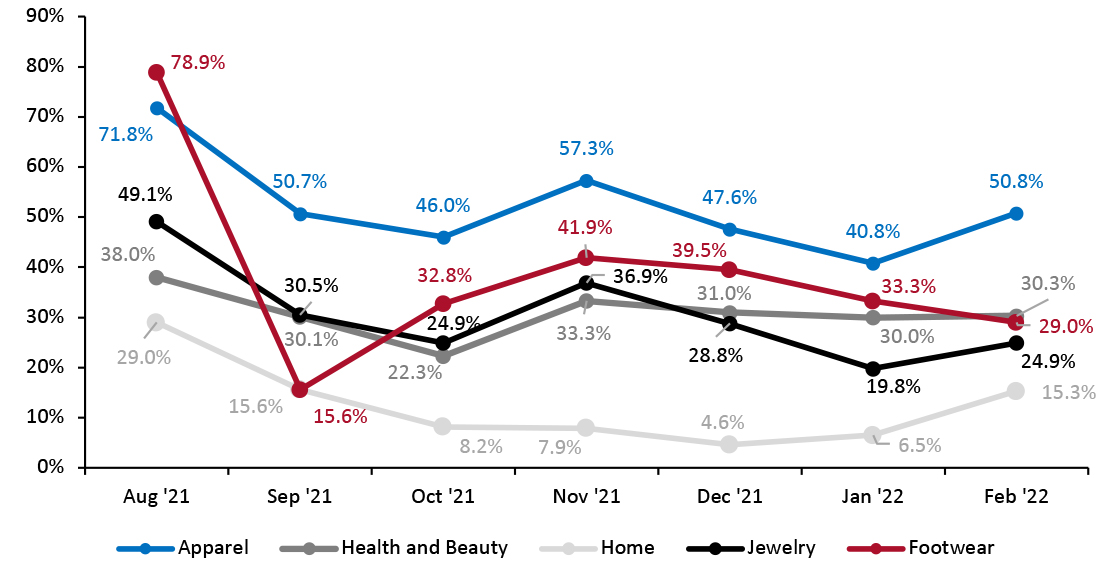 RetailNext started providing traffic trends by vertical on a year-over-year basis from August 2021
 Source: RetailNext [/caption] Regional Traffic Trends In the month of February, several states began to lift indoor mask mandates as the number of new Covid-19 cases declined. New York lifted its indoor mask mandate on February 10, while Connecticut lifted mask mandates for unvaccinated people on February 15. On February 15, the District of Columbia announced that proof of vaccination to enter indoor venues, restaurants and gyms was no longer needed. Similarly, in the third week of February, California removed the indoor mask mandate for vaccinated individuals. In New Mexico, mask mandates for most indoor public places were lifted on February 17. At the end of first week of February, regions from Texas to New York experienced heavy snow, freezing rain and sleet which caused power outages and icy roads. The South and Midwest regions witnessed dangerous ice due to winter storms. Retail traffic in February varied across region.
- The Northeast region performed best, as traffic increased by 40.8% year over year. The fourth week saw the strongest traffic trend, while the first week saw the weakest. Connecticut had the softest traffic in first week—affected by sleet and freezing rain amid the winter storms.
- The South region performed second-best with traffic increasing by 32.3% year over year. The second week saw the best trend in traffic compared to other weeks. Tennessee and Texas saw a decline in traffic trend from the third week to the fourth due to winter storms.
- The West region’s traffic increased by 30.8% year over year. The fourth week saw the best traffic trend compared to other weeks due to President’s Day shopping.
- Traffic by mall location type increased between 22.4% and 42.5% year over year.
- Other locations, including airports, casinos and hotels, performed best compared to all other location types, increasing by 42.5%. This is likely due to the easing of restrictions in public places amid declines in Covid-19 cases.
- Traditional malls performed second-best with traffic increasing by 42.2%, followed by luxury locations, which reported a 42.0% year-over-year rise in traffic.
- Outlet locations registered growth of 41.0% while lifestyle centers saw traffic growth of 39.3% year over year.
- Street-front/freestanding locations saw a traffic increase of 34.1% and strip malls registered growth of 22.4% respectively.