albert Chan
US Retail Sales: February 2022
Coresight Research’s measure of core retail sales is the unadjusted year-over-year change, excluding sales of gasoline, motor vehicles and parts. This metric continued to be strong in February, despite rising prices and declining consumer sentiment. In February, US retail sales grew 12.8% from the year prior. Furthermore, the US Census Bureau adjusted January’s estimates from an 8.2% year-over-year growth to an even stronger 9.4% year-over-year growth, suggesting that despite inflation and concerns of a looming recession, the economy is continuing to grow. Retail sales growth was healthy in February, boosted by another strong month of job creation as average hourly wages continue to rise within a still-tight labor market.
February’s retail sales estimates indicate that consumers are continuing to spend strongly within a 40-year high inflationary context. Hence, we expect retail sales growth could continue to stay elevated in March as retail sales estimates do not factor out inflation, and they are likely to be elevated by higher prices. However, as move deeper into 2022 it is likely that we will see retail sales growth slow. In our weekly US Consumer Tracker, less than half of consumers are avoiding any public place for the first time since the pandemic started, indicating that we are witnessing a transition into a new normal. Especially as we approach warmer weather, we expect to see a further shift back to spending on services and experiences rather than goods, as consumers return to traveling more frequently than in peak pandemic years. In this context, we do not expect sales growth to remain in the upper-single to low double digits for the remainder of 2022. Overall, we expect retail sales growth to remain positive in 2022, a rise on top of the jump exhibited in 2021.
Figure 1. US Total Retail Sales ex. Gasoline and Automobiles: YoY % Change [caption id="attachment_143595" align="alignnone" width="700"]
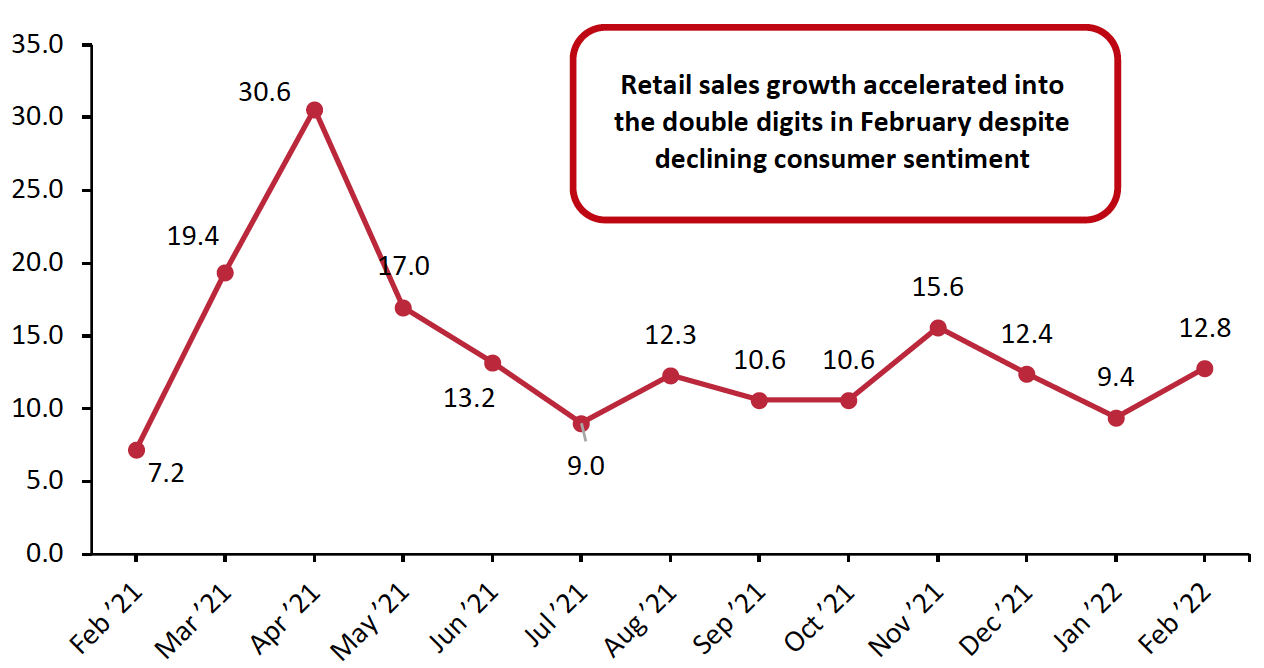 Data are not seasonally adjusted
Source: US Census Bureau/Coresight Research[/caption] In relation to pre-pandemic comparatives of February 2020, retail sales remained in line with recent two-year growth trends, although slowing slightly from January’s revised estimates, to 21.0%.
Figure 2. US Total Retail Sales ex. Gasoline and Automobiles: % Change from Two Years Ago [caption id="attachment_143596" align="alignnone" width="700"]
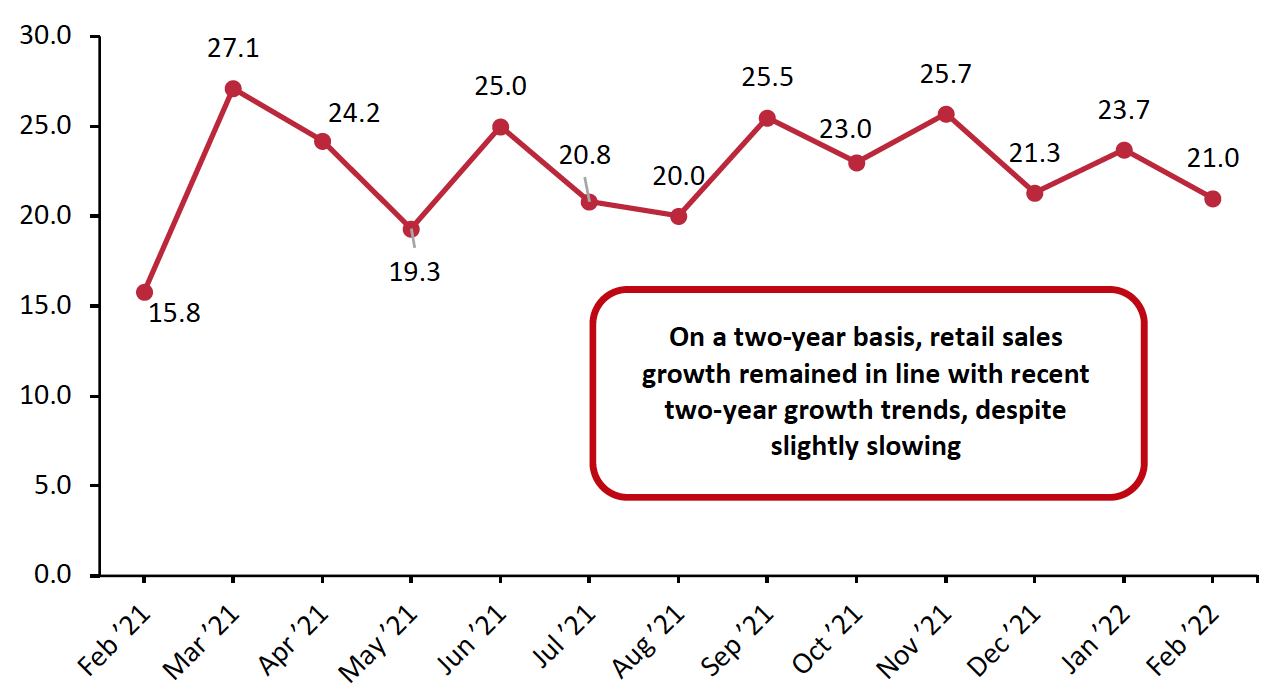 Source: US Census Bureau/Coresight Research[/caption]
Seasonally adjusted retail sales, including automobiles and gasoline, grew a very strong 15.9% year over year, accelerating from January’s 12.6% year-over-year growth. However,, this was likely artificially boosted by higher gasoline prices.
Source: US Census Bureau/Coresight Research[/caption]
Seasonally adjusted retail sales, including automobiles and gasoline, grew a very strong 15.9% year over year, accelerating from January’s 12.6% year-over-year growth. However,, this was likely artificially boosted by higher gasoline prices.
Figure 3. US Total Retail Sales incl. Gasoline and Automobiles: Seasonally Adjusted YoY % Change [caption id="attachment_143597" align="alignnone" width="700"]
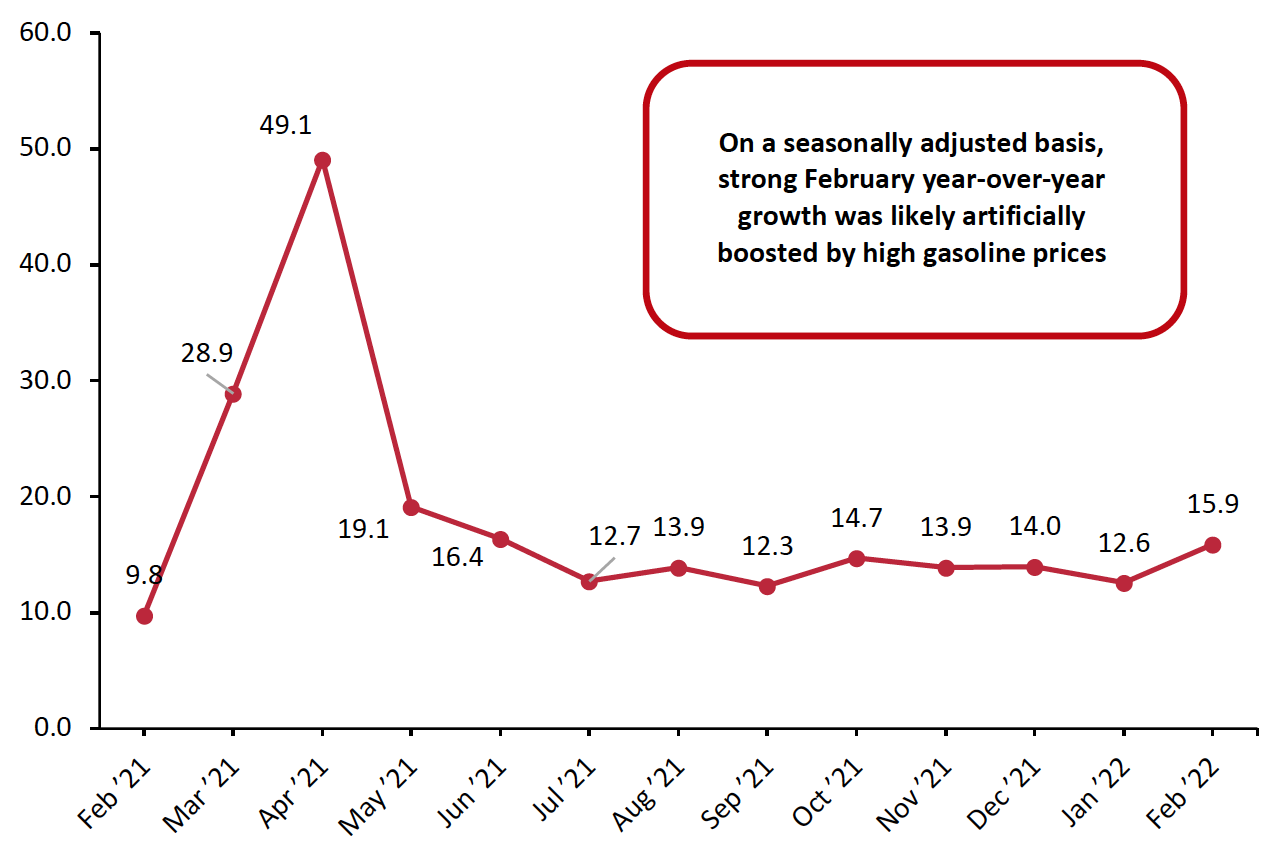 Data are seasonally adjusted
Source: US Census Bureau/Coresight Research[/caption]
Sales Decline Month over Month
On a month-over-month basis, seasonally adjusted sales growth (excluding automobiles and gas) was negative. Compared to January, seasonally adjusted sales declined by 1.0%, potentially reflecting the challenges consumers are facing spending within the current inflationary context.
Figure 4. US Total Retail Sales ex. Gasoline and Automobiles: MoM % Change
[caption id="attachment_143598" align="alignnone" width="700"]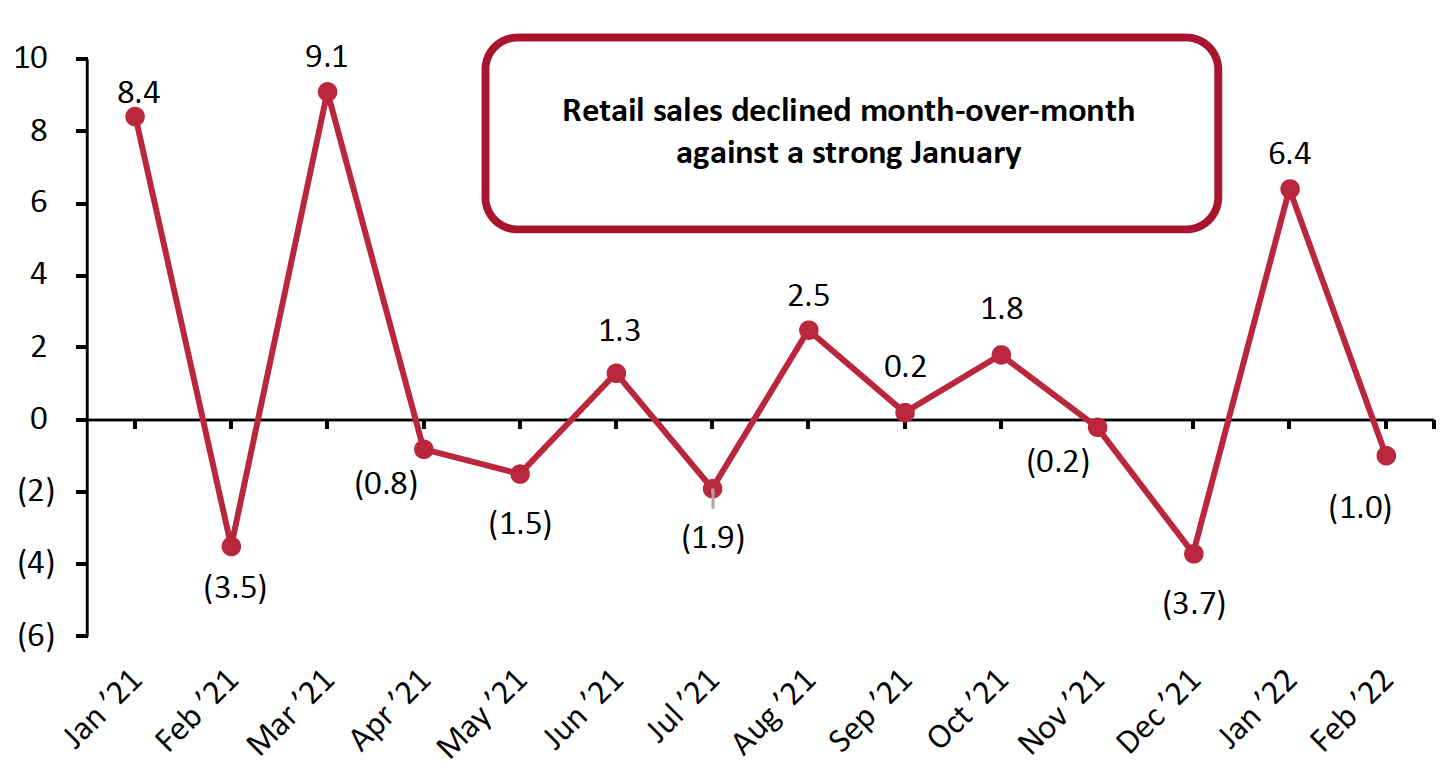 Data are seasonally adjusted
Source: US Census Bureau/Coresight Research[/caption]
Retail Sales Growth by Sector
Overall retail sales growth was strong in February, against healthy 2021 comparatives. In this section, we compare February 2022 sales to February 2021 sales.
With overall retail sales growth reaching double digits in February, several individual sectors also saw sales rise by double digits in February compared to a year ago:
- For the second consecutive month, clothing and clothing accessory stores posted the strongest month of growth in year-over-year terms, as sales rose by 31.0%. Clothing sales are benefiting from the transition to a new normal, which includes an updated and differentiated wardrobe as consumers balance a work-from-home and work-in-office lifestyle.
- General merchandise stores saw sales growth accelerate from January to 12.6% year-over-year growth in February. The department store subsector posted a very strong month as sales grew by 22.4% from a year ago.
- Sales growth at miscellaneous store retailers accelerated from an already strong January, growing sales 24.6% from a year ago.
- Sporting goods, hobby, musical instrument and bookstores exhibited sales growth acceleration from a modest January. In February, sales grew 11.6% from a year prior, up from January’s 0.7% year-over-year growth.
- Food and beverage stores saw sales increase 8.0% from a year ago, while grocery stores specifically saw sales rise 8.4%. However, according to the BLS, food at home prices rose 8.6% from a year ago in February. When factoring in inflation, both food and beverage stores and grocery stores appear to have underperformed.
- Building material and garden supply dealers continued to witness sales accelerate, growing 14.9% from a year ago, up from an already strong month of January when sales increased 9.3% year over year.
- Electronics and appliance stores are feeling the tangible impact of the global microchip shortage. Sales grew a modest 2.6% from a year ago in February. Notably, the Census Bureau’s revised estimates for January indicate that sales declined by 3.0% year over year in January.
- Not included in our definition of retail sales, but reflecting the shift back to public places and services spending, the Census Bureau reported a 33.0% year-over-year rise in sales at food-service and drinking establishments in February.