
Nitheesh NH
US
| What’s New? | Trend Data | Positive or Negative* |
| Earnings vs. Inflation: In January, the US saw inflation reach a four-decade high. Consumer prices increased 7.5% compared to a year ago, as inflation is at its highest point since 1982. Inflation is being led by volatile gas prices, rising energy costs and food price increases. Meanwhile, average weekly earnings growth remained in line with recent trends, growing 4.2% year over year in January. Inflation continues to outpace average earnings growth in the US, cutting into consumers’ ability to spend. Consequently, consumers are spending more on essentials as discretionary spending on nonessential goods is slowing within the inflationary context. |
Average Weekly Earnings vs. Consumer Prices: YoY % Change 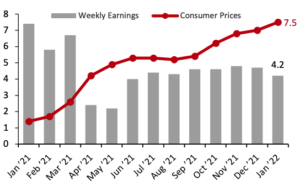 |
|
| Food and Fuel Prices: Food and gas price inflation rates are significant metrics because higher costs in these categories can impact discretionary spending. January saw US food inflation continue to climb as prices grew 7.4% from a year ago, up from December’s 6.5% year-over-year growth. Food price inflation is being driven in part by skyrocketing gas prices. The US saw the price of gasoline per gallon grow 40.0% from a year ago. Soaring gasoline prices, combined with a shortage of available truck drivers, mean that food importers are paying more to transport fresh produce, putting upward pressure on food at home prices. |
Consumer Prices for Food at Home and Gasoline: YoY % Change 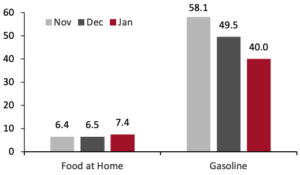 |
|
| Retail Sales: Total US retail sales, excluding gasoline and automobiles, grew by a strong 8.2% year over year, against strong January 2021 comparatives when there was double-digit retail sales growth. |
Total Retail Sales ex. Automobiles and Gasoline: YoY % Change [caption id="attachment_142390" align="aligncenter" width="300"]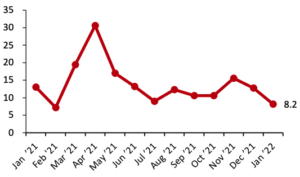 Data are not seasonally adjusted[/caption] Data are not seasonally adjusted[/caption] |
UK
| What’s New? | Trend Data | Positive or Negative* |
| Earnings vs. Inflation: In the UK, inflation continued its steady upward trend. Consumer prices grew 4.9% from a year ago, slightly picking up from December’s 4.8% growth. Despite above average inflation, average weekly earnings growth remains in line with price increases, a positive for consumers. In December (latest available data) average weekly earnings also grew by 4.9%. |
Average Weekly Earnings vs. Consumer Prices: YoY % Change [caption id="attachment_142391" align="aligncenter" width="300"]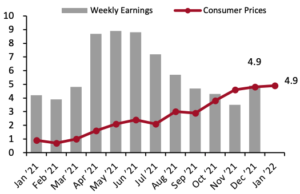 Latest earnings data are for December; consumer prices are CPIH[/caption] Latest earnings data are for December; consumer prices are CPIH[/caption] |
|
| Food and Fuel Prices: Higher costs for food and automotive fuel can impact discretionary spending. In January, UK food price inflation continued to slowly accelerate to 4.4%, up from December’s 4.2%. year-over-year growth. Automotive fuel price inflation appears to be easing while remaining high, growing 23.6% year over year. |
Consumer Prices for Food at Home and Automotive Fuel: YoY % Change [caption id="attachment_142392" align="aligncenter" width="300"]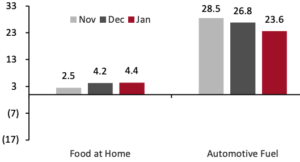 Data are not seasonally adjusted[/caption] Data are not seasonally adjusted[/caption] |
|
| Retail Sales: Total UK retail sales growth was strong in January, growing 11.6% against weaker comparatives from a year ago when sales declined. Sales volumes grew 6.0% from a year ago. On a month-over-month basis, the growth in sales volumes was the largest since April 2021, when nonessential retailing was permitted to reopen, according to the ONS. |
Total Retail Sales ex. Automobiles and Automotive Fuel: YoY % Change [caption id="attachment_142393" align="aligncenter" width="300"]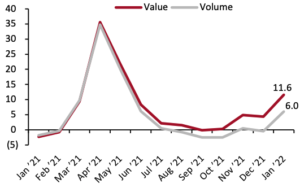 Data are not seasonally adjusted[/caption] Data are not seasonally adjusted[/caption] |
|
China
| What’s New? | Trend Data | Positive or Negative* |
| Income vs. Inflation: In China, the consumer price index grew just 0.9% in January, following a steady downward trend in inflation in recent months. Data on per capita disposable income are released quarterly. In the fourth quarter of 2021, per capita disposable income grew 5.4% year over year, down from the 10.4 % growth in the third quarter of 2021 but remaining healthy. Growth in disposable income is outpacing increases in consumer prices, a net positive for consumer ability to spend. |
Per Capita Disposable Income vs. Consumer Prices: YoY % Change [caption id="attachment_142397" align="aligncenter" width="300"]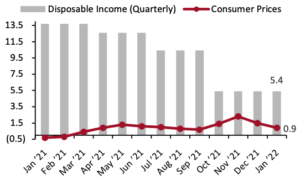 Disposable income data are quarterly[/caption] Disposable income data are quarterly[/caption] |
|
| Food and Fuel Prices: Higher costs for food and automotive fuel can impact discretionary spending. In January, food prices in China were mostly unchanged, declining marginally by 0.1% compared to a year ago. Beijing’s fuel price inflation––paralleling the US––picked up speed from easing pressures in December. In January, fuel prices increased 35.3% compared to January 2021, up from December’s 24.1% year-over-year rise in prices |
Consumer Prices for Food at Home and Automotive Fuel: YoY % Change 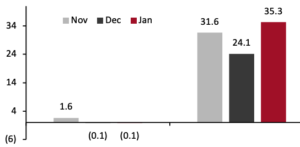 |
|
| Retail Sales: Retail sales data for January and February are released together in March. Therefore, this month we have no new retail sales data to update. In December, retail sales growth slowed in growing just 2.3% compared to a year ago, indicating that economic recovery is losing momentum amid the country-wide spread of the Omicron variant and the Chinese zero-tolerance policy towards to containing outbreaks. |
Total Retail Sales ex. Food Service, incl. Automobiles and Gasoline: YoY % Change [caption id="attachment_142401" align="aligncenter" width="300"]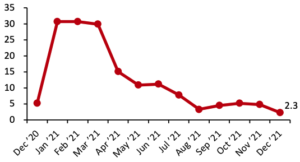 From December 2020, our China retail sales index excludes food-service sales; data in prior reports included food-service sales. Data for January and February 2021 are aggregated.[/caption] From December 2020, our China retail sales index excludes food-service sales; data in prior reports included food-service sales. Data for January and February 2021 are aggregated.[/caption] |