albert Chan
Introduction
What’s the Story?
In our Leading Indicators of US Retail Sales monthly series, we examine several key macroeconomic indicators of US retail sales and analyze how they may impact the industry in the months to come. We analyze the latest available data, as of the end of January 2022, from sources such as the US Census Bureau, the US Bureau of Economic Analysts (BEA), the US Bureau of Labor Statistics (BLS) and the US Department of Housing and Urban Development (HUD).
Why It Matters
Macroeconomic indicators have a significant impact on overall retail sales growth. Looking at 10 indicators (unemployment rate, labor force participation rate, disposable income per capita, average hourly wages, consumer sentiment, saving rate, gas price, federal funds rate, housing starts and housing prices), we can historically account for a majority of the variation in retail sales growth and create a strong basis for predicting sales moving forward.
The close correlation between retail sales growth predictions based on economic indicators and actual retail sales growth is shown in Figure 1.
Figure 1. US Actual Retail Sales ex. Auto and Gas Sales vs. Model Predicted Sales, January 2000–December 2021 (YoY % Change) [caption id="attachment_141683" align="aligncenter" width="700"]
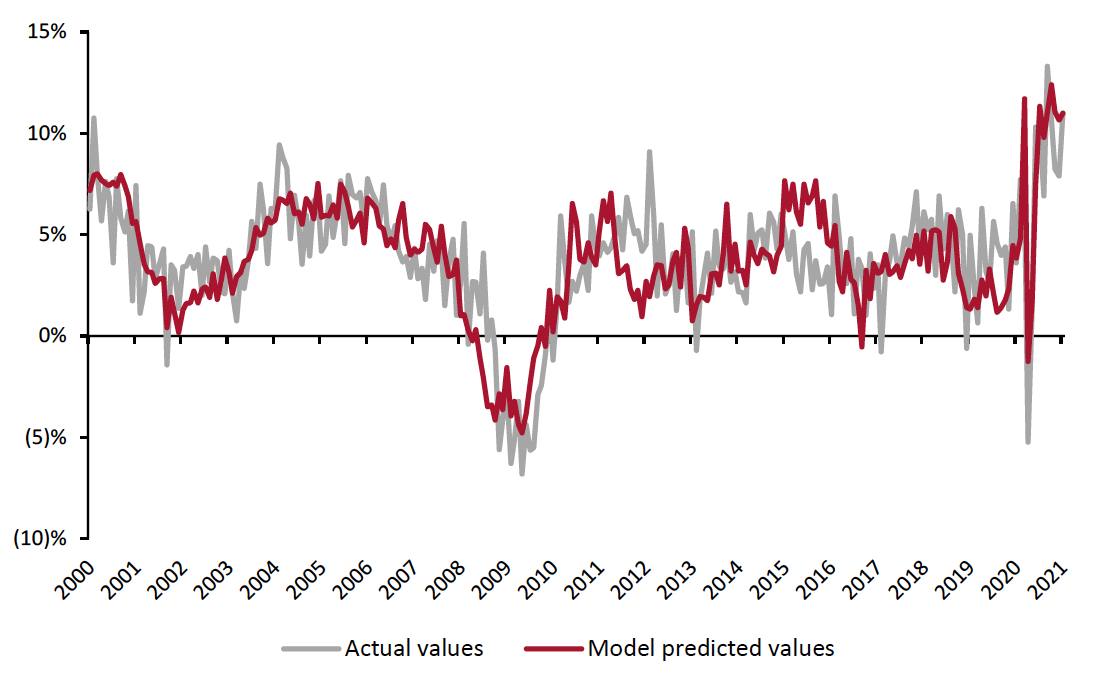 Source: BEA/BLS/Federal Reserve Board of Governors/S&P/Coresight Research[/caption]
In December, retail sales growth remained strong but was a slight deceleration from a strong November. December retail sales growth was likely affected by the earlier-than-usual holiday season. As consumers started shopping earlier for holiday this year, they have wrapped up holiday shopping earlier as well, reflected in the sales growth deceleration December.
Leading Indicators of US Retail Sales: Coresight Research Analysis
Indicators Overview
Of the 10 indicators we examined, five are likely to have a positive impact on retail sales in the coming months. In January, the unemployment rate was mostly unchanged, while more workers joined the labor force. Wages continued to rise in January within a tight labor market while disposable income fell in December (latest available data). Consumer sentiment began to improve in December as gas prices continued to decline following President Biden’s announcement that the US will use the Strategic Petroleum Reserve to release more oil into the economy. However, as the worst of the Omicron variant is now behind us, gas prices have climbed once more. Inflation in aggregate remains high, and as a result, consumer sentiment has fallen back to near-record lows, similar to the levels seen in November 2021.
Figure 2. US: Leading Indicators of Retail Sales, as of the end of January 2022
[caption id="attachment_141684" align="aligncenter" width="700"]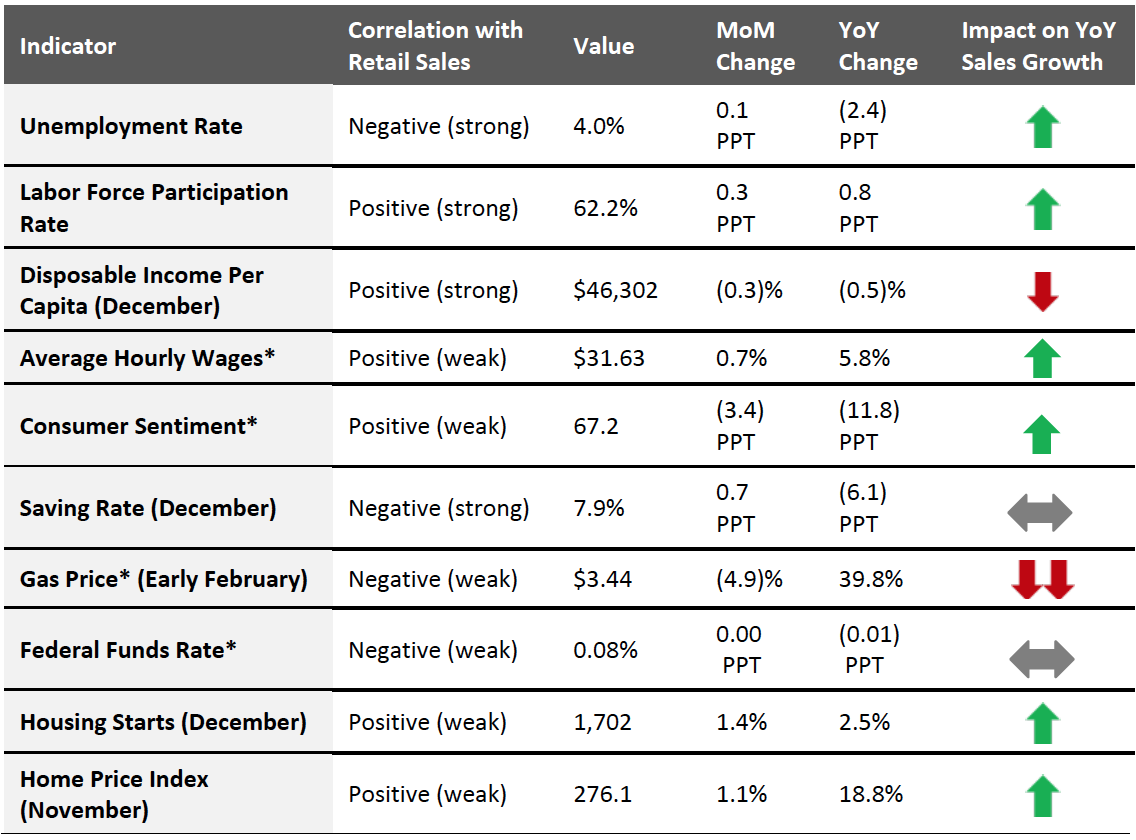 Latest available data from January unless otherwise indicated
*Not included in predictive model
Source: BEA/BLS/Federal Reserve Board of Governors/S&P/University of Michigan/US Energy Information Administration/Coresight Research[/caption]
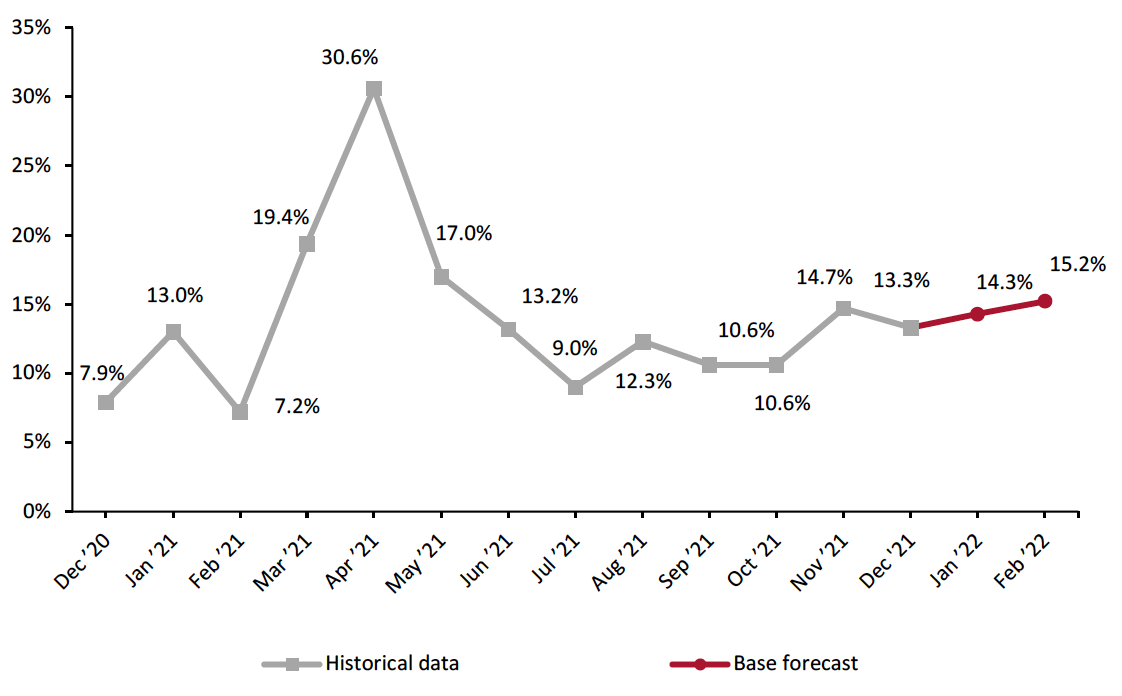
Our model, which analyzes correlations between retail sales and macroeconomic indicators, generates a projection of 14.3% year-over-year growth in total retail sales in January and 15.2% growth in February. Against strong comparatives from 2021, especially in January, these are aggressive projections.
As analysts, we believe year-over-year retail sales expansion is likely to be below these mid-teens projections. More qualitatively, we expect more moderate growth in the coming months, and we expect full-year growth to be in the single digits.
With inflation at its highest point in 40 years, we could potentially see elevated retail sales. However, inflation is currently outpacing average hourly wage growth, which has a negative impact on consumers’ spending abilities. Gas prices have risen also once more in reaction to geopolitical developments, cutting into consumer spending power and resulting in a depressed consumer sentiment.
Figure 3. US Retail Sales ex. Auto and Gas (YoY % Change) [caption id="attachment_141685" align="aligncenter" width="700"]
 Source: BEA/BLS/Federal Reserve Board of Governors/S&P/Coresight Research[/caption]
The Job Market
In January, the job market performed strongly, far surpassing expectations for a month of slow job growth due to the Omicron variant. The US added 467,000 employees to nonfarm payrolls in January. Alongside a strong January, the BLS made large revisions to what was an originally weak December, upping the total number of nonfarm employees added to the economy from 199,000 to 510,000. Nonfarm employment has increased by 19.1 million from its April 2020 value but remains below its February 2020 pre-pandemic level by 2.9 million, according to the BLS. In January, job gains were led by the professional and business services, retail trade, transportation and warehousing, and temporary services sectors. The retail sector posted a very strong month, adding 61,000 jobs in nonfarm payrolls. Specifically, the most gains were seen in general merchandise stores (29,000), health and personal care stores (11,000) and sporting goods, hobby, or music stores (7,000).
The unemployment rate ticked up slightly from December’s 3.9% but remains well below the 5.0% level of unemployment that economists consider to be full employment, standing at 4.0% in January. Hiring is strong owing to high demand for goods and services during pandemic recovery. Meanwhile, the labor force participation rate saw a welcomed increase in January, rising to 62.2% from 61.9%. Although the labor force participation rate increased, it remains 1.2 percentage points below its February 2020 pre-pandemic level.
Figure 4. US Unemployment Rate (Left Axis, %) and Labor Force Participation Rate (Right Axis, %) [caption id="attachment_141686" align="aligncenter" width="700"]
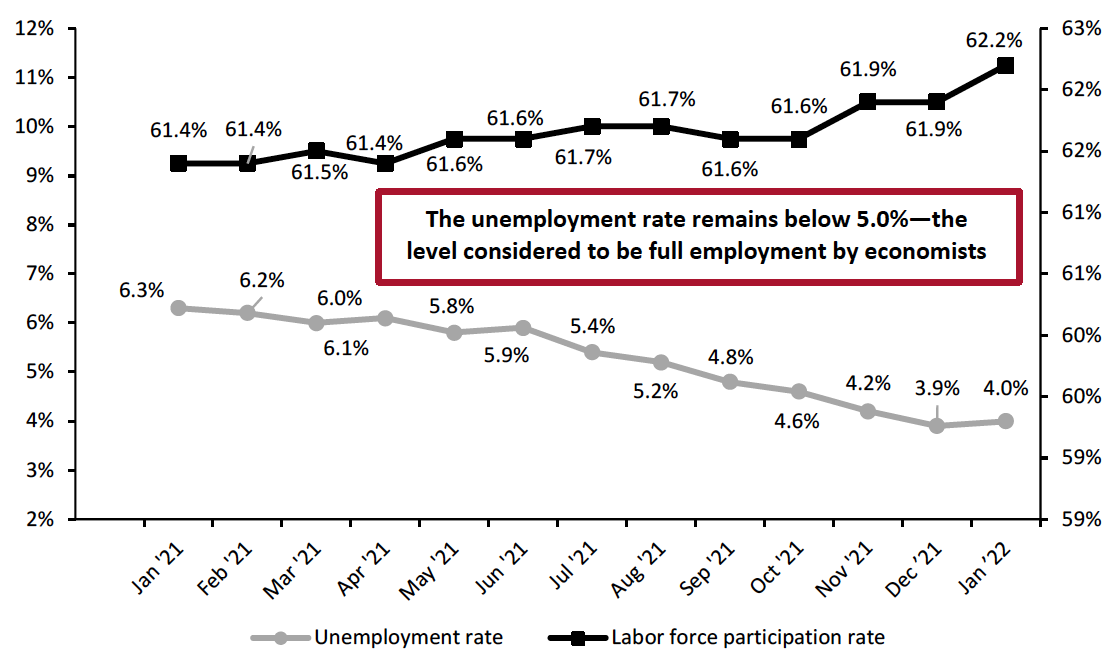 Source: BLS[/caption]
The highs in average hourly wages in the private sector continued in January. Average hourly wages climbed to $31.63, a month-over-month increase of nearly $0.32—a meaningful figure considering the sheer scale of the US workforce. With workers in high demand, an increase in hourly wages is one method employers are using to draw more workers back into the labor force. Workers continue to have the upper hand to demand better pay and working conditions in a tight labor market.
Source: BLS[/caption]
The highs in average hourly wages in the private sector continued in January. Average hourly wages climbed to $31.63, a month-over-month increase of nearly $0.32—a meaningful figure considering the sheer scale of the US workforce. With workers in high demand, an increase in hourly wages is one method employers are using to draw more workers back into the labor force. Workers continue to have the upper hand to demand better pay and working conditions in a tight labor market.
Figure 5. US Average Hourly Wages, All Private-Sector Employees (USD) [caption id="attachment_141687" align="aligncenter" width="700"]
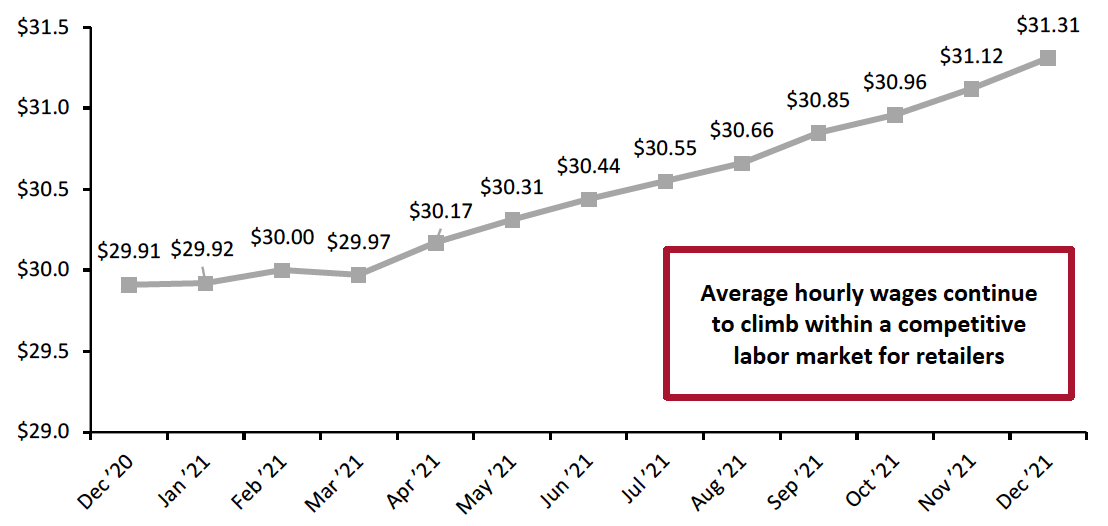 Source: BLS[/caption]
Implications
Although the Omicron variant peaked in the US in January, it did not hinder job creation throughout the month—a promising sign for the US economy. Furthermore, the labor force participation rate increased in January, albeit marginally, potentially relieving some of the pressure within the tight labor market. Still, workers remain in high demand and businesses are competing for hiring by increasing wages: Average hourly wages have hit record highs in 10 consecutive months. With the worst of the Omicron variant behind us, we expect hiring to remain strong in February. Nevertheless, the “Great Contemplation” remains a challenge to the labor supply. Workers have been offered the opportunity to rethink their lives and livelihoods during the two years of the pandemic, and many are deciding to leave their jobs. In November, the US saw a record number of workers resign at 4.5 million. In December, this number remained high at 4.3 million.
Income, Savings and Sentiment
Real disposable income per capita has fallen substantially since the stimulus-driven spike in March. The beginning of Child Tax Credit payments caused a slight uptick in real disposable income in July. Since then, real disposable income has exhibited slight fluctuations, Child Tax Credit payments expired in December. In December (latest available data) real disposable income per capita fell from November’s value to $46,302 but remains higher than it was in September.
Figure 6. US Annualized Real Disposable Income Per Capita (USD) [caption id="attachment_141688" align="aligncenter" width="700"]
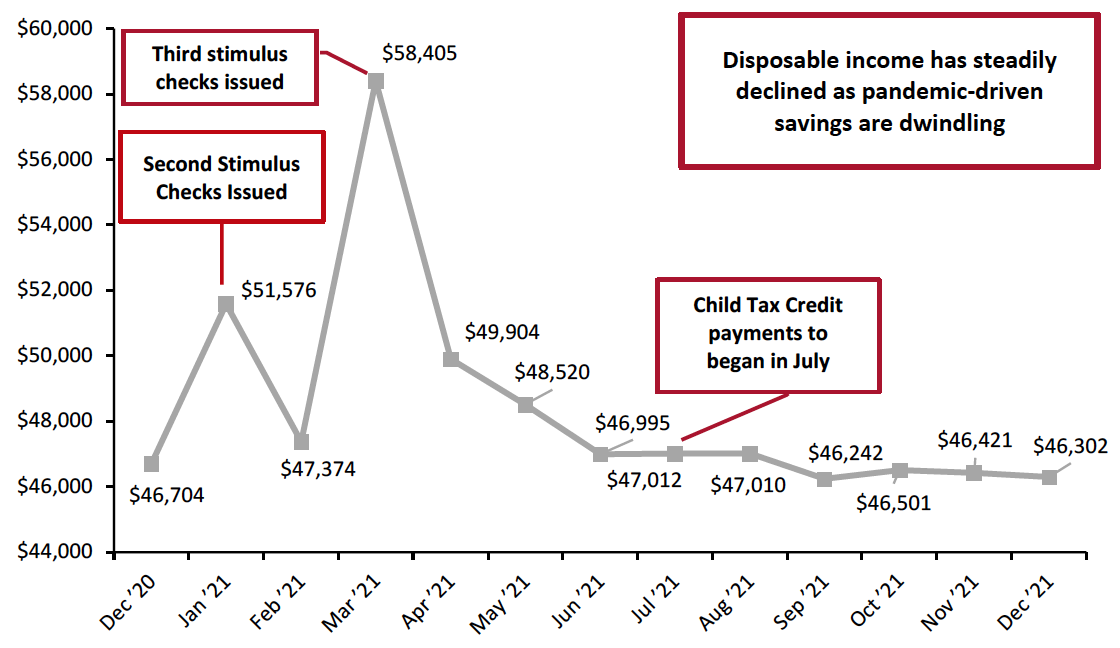 Source: BEA[/caption]
The personal saving rate has also substantially declined since the third round of stimulus checks in March. July saw a small uptick, likely due to the beginning of Child Tax Credit payments. Since then, the savings rate has declined to pre-pandemic levels but appears to be on a steady upward trend once more. Consumers’ excess savings during the pandemic have likely dwindled due to the expiration of government assistance, such as stimulus payments and supplemental unemployment benefits. Although the savings rate appears to be at pre-pandemic levels, it remains healthy. If the upward trend in the savings rate continues, it would imply that consumers have more free cash to spend, to the benefit of retail sales.
Figure 7. Personal Saving Rate (%)
[caption id="attachment_141689" align="aligncenter" width="700"]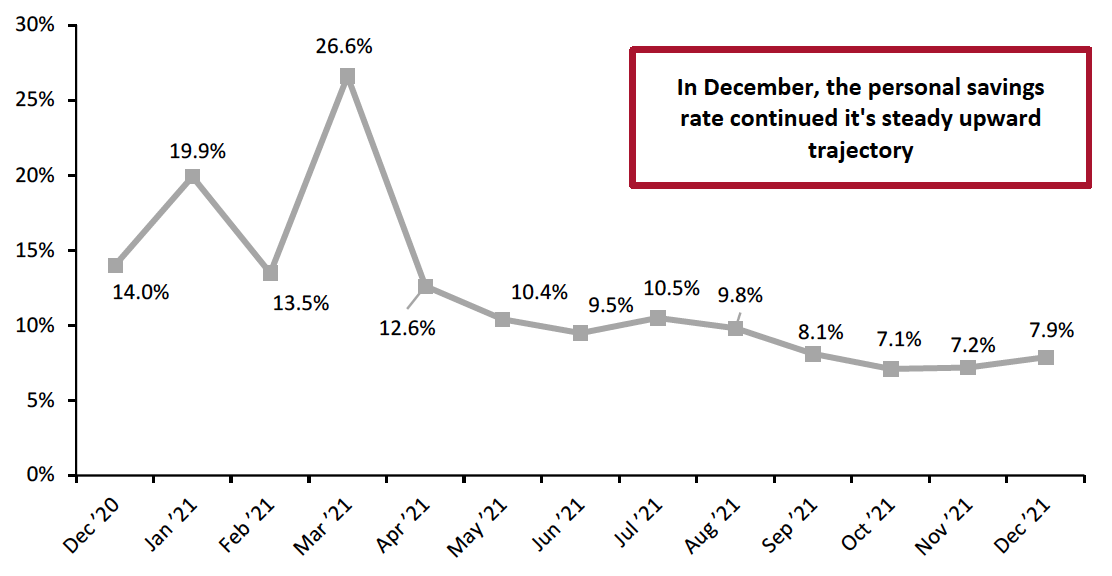 Source: BEA[/caption]
Consumer confidence started to improve in December after hitting a 10-year low in early November. In January, the University of Michigan consumer sentiment index declined once more to a decade low of 67.2.
Alongside gas price rises in January, the anticipated interest rate hike by the Federal Reserve Bank in March is likely to slow wage growth and trim gains in stocks and home values, resulting in decade-low consumer sentiment.
Figure 8. University of Michigan Consumer Sentiment Index
[caption id="attachment_141690" align="aligncenter" width="700"]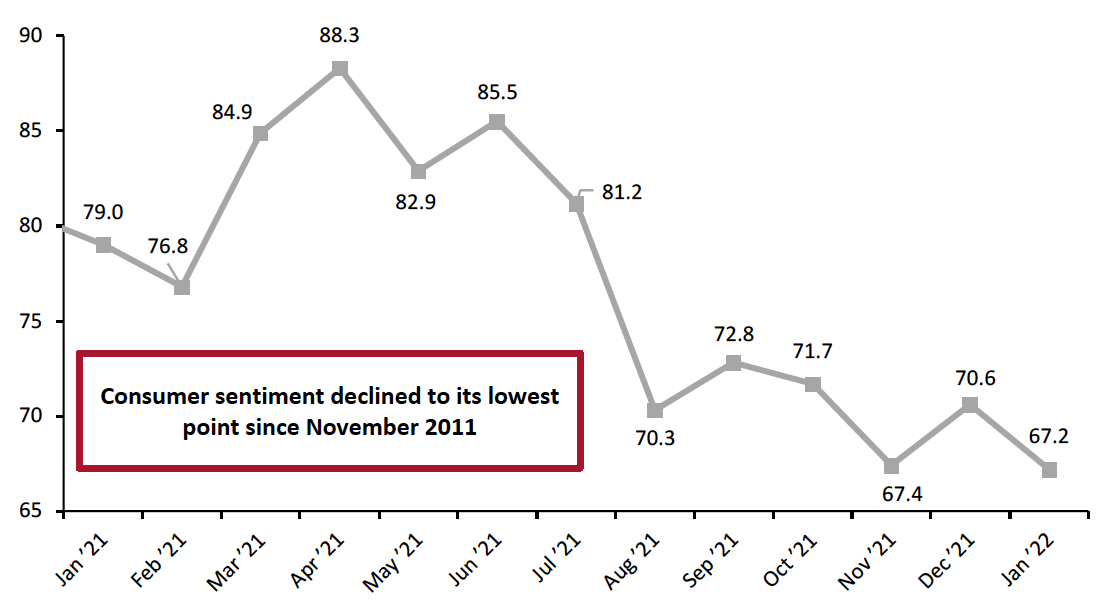 Source: University of Michigan[/caption]
Gas prices had started to ease in recent months. In November, President Biden’s administration announced that the US would utilize the Strategic Petroleum Reserve (SPR) and release 50 million barrels of oil into the economy to combat fuel inflation. Since November, gas prices have been declining, supported by reduced travel as consumers tried to avoid the Omicron variant. However, with the worst of Omicron behind us, consumers have again increased their gasoline consumption, putting upward pressure on the price of gasoline. As of early February, gas prices have increased to $3.44 per gallon.
Figure 9. US Regular All Formulations Gas Price (Dollars per Gallon)
[caption id="attachment_141691" align="aligncenter" width="700"]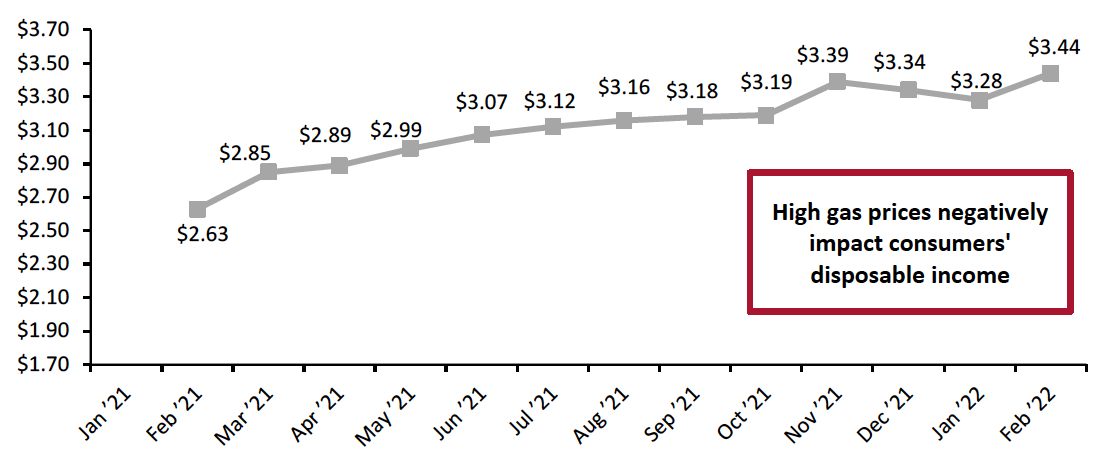 Source: US Energy Information Administration[/caption]
Implications
Higher gasoline prices have a multiplier effect throughout the entire economy, impacting the price of goods delivery as well as personal travel. With gas prices climbing once more, and inflation remaining high in aggregate, consumers have less spending power.
Housing
Housing starts picked up in December, increasing by 1.4% month over month—representing the second consecutive month of increases. There were 1.7 million new housing starts in December.
Home prices continued to climb in November (the latest month for which Case-Shiller Index data is available), reaching 276.1 points, up from 273.1 points in October. Rising home prices can create a wealth effect, making consumers feel more affluent and emboldening them to spend.
Figure 10. Housing Starts (Thousands, Left Axis) and Case-Shiller US Home Price Index (Right Axis)
[caption id="attachment_141692" align="aligncenter" width="700"]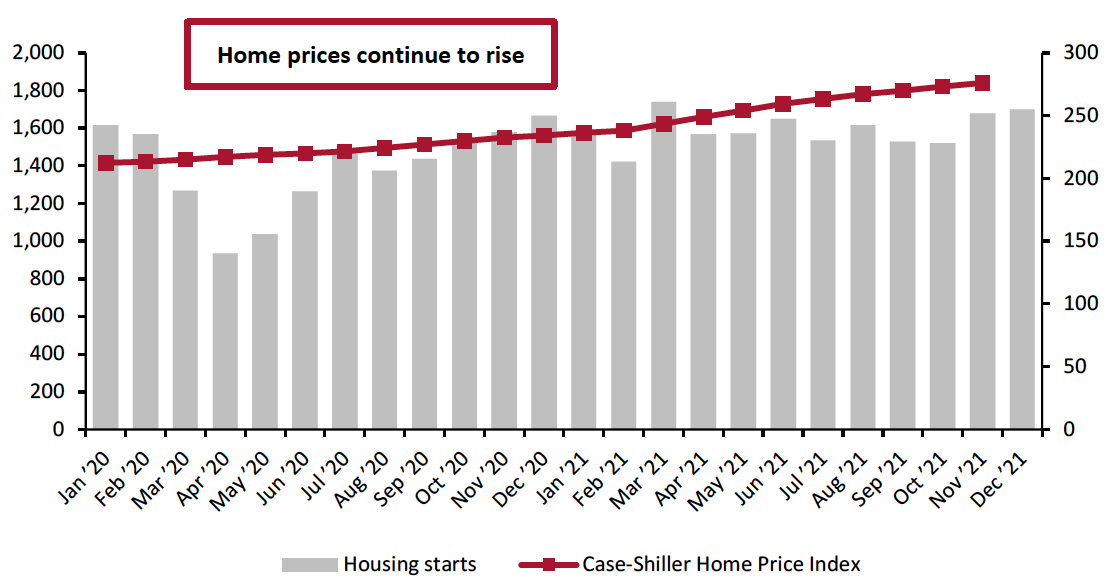 Source: HUD/US Census Bureau[/caption]
While the rise in housing prices causes some consumers to feel more affluent, it also means many are forced to rent rather than buy—which may be the reason we have observed three consecutive month-over-month declines in housing starts.
Implications
The strength of the housing market, and especially house prices, remains another positive for retail. House-moves will continue to benefit furniture, furnishings, home-improvement and appliance retailers while the wealth effect from rising prices will trickle down to many discretionary sectors, including big-ticket sectors such as electronics.
What We Think
December retail sales remained strong despite a slowdown in year-over-year growth compared to November. The earlier-than-usual holiday season may mean consumers finished holiday shopping earlier than usual this year, reflected in December’s lower year-over-year growth.
In a month when consumers traditionally pull back on spending in a post-holiday dwindle, seasonal increases in Covid-19 cases may be contributing to increased spending on goods in January 2022.
Implications for Brands/Retailers
- Stronger-than expected January job creation and revisions for the December payroll growth is a positive for retail, especially as wages continue to grow. With more employed workers, more consumers not only possess but will likely be eager to spend their hard-earned income.
- However, consumer sentiment now stands at 67.2, the lowest level seen since November 2011. Rising gas prices and overall high inflation are contributing to a multiplier effect throughout the economy that is likely to hinder consumers’ ability to spend.