Nitheesh NH
The Coresight Research US Retail Traffic and In-Store Metrics series reviews year-over-year changes in selected store-based metrics, as reported by RetailNext. In this month’s report, we review store traffic changes through February 2021, when many states opted to extend coronavirus-related restrictions. As a result, new Covid-19 cases declined in February versus January. As some states are easing their restrictions in March, we expect to see an improvement in traffic trends during the month. RetailNext’s coverage does not include food retailers but does include some other retail sectors deemed essential; the exclusion of food retail means that the figures cited below almost certainly overstate recent declines in total retail traffic.
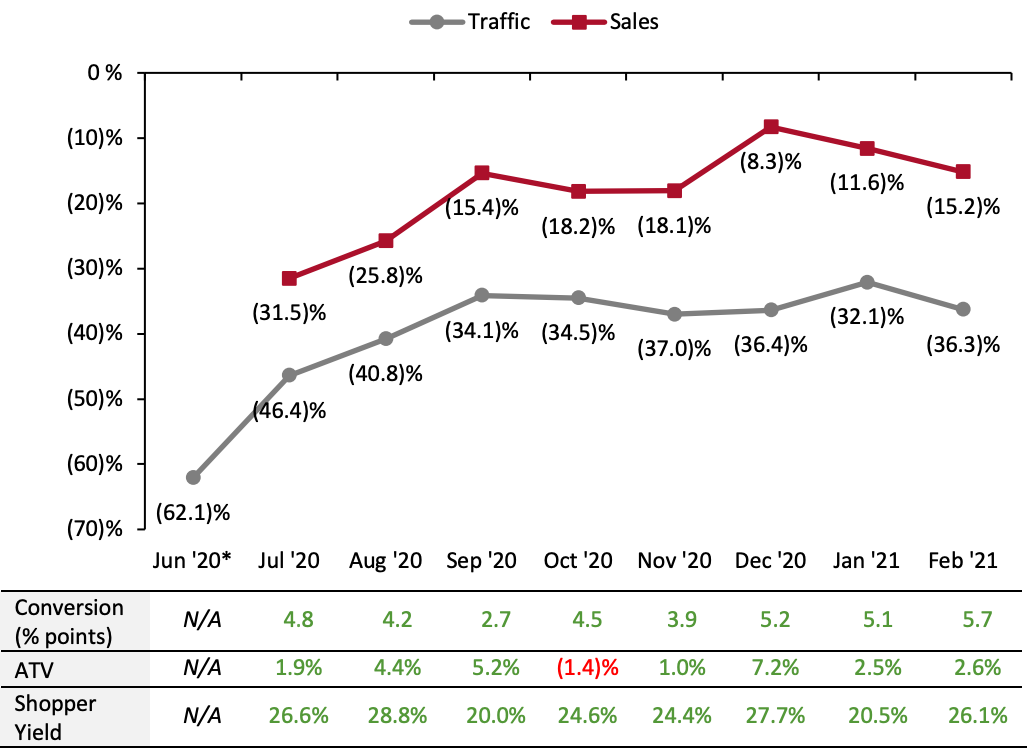 ATV=average transaction value; Shopper yield= Sales divided by traffic *For June 2020, other than traffic, RetailNext did not publish data that it typically provides for sales, conversion rate, shopper yield and ATV.
Source: RetailNext[/caption] Weekly Shopper Traffic Trends Weekly data for February tracks the progress of store traffic over four weeks (January 31, 2021–February 27, 2021):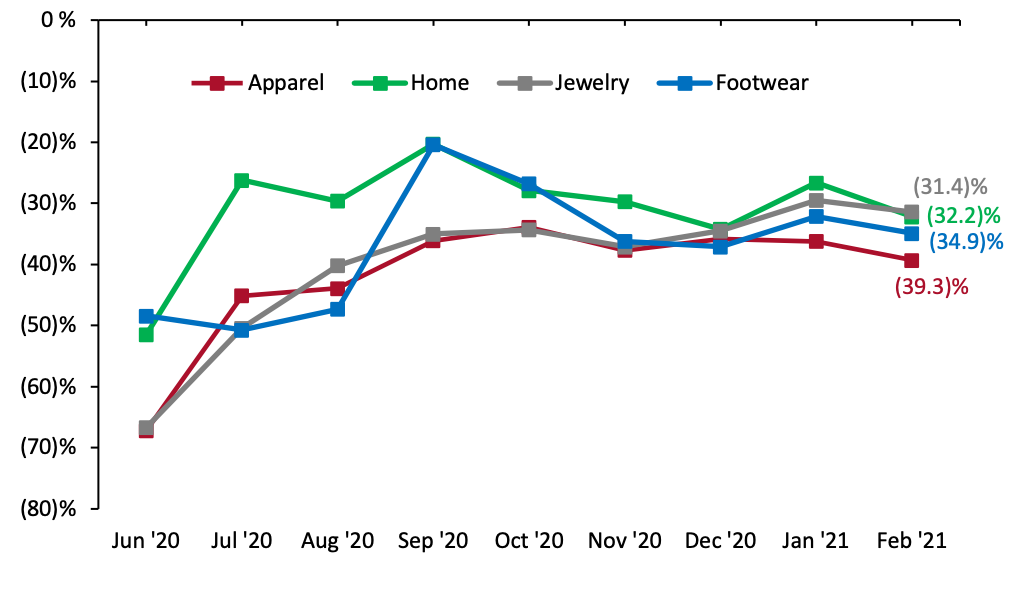 Source: RetailNext[/caption]
Regional Traffic Trends
In February, the Midwest, Northeast and South regions were severely impacted by Winter Storm Uri from February 12 to 16, with power outages and heavy snow, along with the coldest temperatures recorded for decades. The traffic trends in the South and Northeast regions deteriorated from the first week to the second week of February, reaching their largest decline in the third week. However, traffic trends started to improve in the fourth week of February. Within the Northeast region, Connecticut saw the best traffic trends while New York witnessed the largest decline in traffic. In the South region, Florida and Texas saw the worst performance, while in the Midwest, Illinois witnessed the largest decline in traffic. New Covid-19 cases declined in February from January as many states opted to extend restrictions.
Retail traffic in February varied across regions:
Source: RetailNext[/caption]
Regional Traffic Trends
In February, the Midwest, Northeast and South regions were severely impacted by Winter Storm Uri from February 12 to 16, with power outages and heavy snow, along with the coldest temperatures recorded for decades. The traffic trends in the South and Northeast regions deteriorated from the first week to the second week of February, reaching their largest decline in the third week. However, traffic trends started to improve in the fourth week of February. Within the Northeast region, Connecticut saw the best traffic trends while New York witnessed the largest decline in traffic. In the South region, Florida and Texas saw the worst performance, while in the Midwest, Illinois witnessed the largest decline in traffic. New Covid-19 cases declined in February from January as many states opted to extend restrictions.
Retail traffic in February varied across regions:
- February saw a slight weakening in traffic trends: Traffic declined by 36.3% year over year in February versus January’s 32.1% decline.
- The conversion rate (sales transactions as a percentage of traffic) grew by 5.7 percentage points in February, up from January’s growth of 5.1 percentage points.
- In February, ATV (sales divided by transactions) increased by 2.6%, versus January’s 2.5% growth.
- Shopper yield (sales divided by traffic) increased by 26.1% in February, versus January’s 20.5% growth.
ATV=average transaction value; Shopper yield= Sales divided by traffic *For June 2020, other than traffic, RetailNext did not publish data that it typically provides for sales, conversion rate, shopper yield and ATV.Source: RetailNext[/caption] Weekly Shopper Traffic Trends Weekly data for February tracks the progress of store traffic over four weeks (January 31, 2021–February 27, 2021):
- Traffic declined by 32.7% in the first week of February, an easing from the final week of January, which saw a traffic decline of 33.9%. However, traffic declines accelerated to 37.4% in the second week of February.
- Declines further accelerated in the third week of February, reaching 39.3%, as many states were affected by heavy snow from Winter Storm Uri, which lead to power outages from February 12 to 16.
- However, declines eased to 34.0% in the fourth week of February, even with the slight increase in Covid-19 cases versus the prior week.
- The apparel sector experienced the greatest traffic decline at 39.3%, a fall of 310 basis points compared to January.
- The footwear sector saw a 34.9% decrease in traffic, a drop of 280 basis points compared to January.
- The jewelry sector posted the lowest traffic decrease at 31.4%, a deterioration of 480 basis points compared to January.
- The home sector reported a traffic decline of 32.2%, a weakening of 270 basis points compared to January.
Source: RetailNext[/caption]
Regional Traffic Trends
In February, the Midwest, Northeast and South regions were severely impacted by Winter Storm Uri from February 12 to 16, with power outages and heavy snow, along with the coldest temperatures recorded for decades. The traffic trends in the South and Northeast regions deteriorated from the first week to the second week of February, reaching their largest decline in the third week. However, traffic trends started to improve in the fourth week of February. Within the Northeast region, Connecticut saw the best traffic trends while New York witnessed the largest decline in traffic. In the South region, Florida and Texas saw the worst performance, while in the Midwest, Illinois witnessed the largest decline in traffic. New Covid-19 cases declined in February from January as many states opted to extend restrictions.
Retail traffic in February varied across regions:
- The Northeast was the worst-performing region, witnessing a traffic decline of 36.9%. The region saw its best traffic trends in the first week of the month, with a decline of 32.9%. However, the traffic trends deteriorated in the second and third weeks owing to the heavy snow from Winter Storm Uri in the region.
- The Midwest posted a traffic decline of 36.5%. The region witnessed its best traffic trends in the fourth week of February, with traffic improving by around seven percentage points to (31.6)%.
- The South outperformed all other regions with a traffic decline of 35.0% for the month. The region saw its best traffic trends in the first week, with a traffic decline of 27.9%. Impacted by the winter storm, the region saw the largest decline in traffic in the third week, at 39.1%.
- The West posted the second-best traffic performance for the month, with a 36.1% decline. As with the Northeast and South regions, the West also witnessed its best traffic trends in the first week of the month, with a traffic decline of 31.2%. In the third week of February, the region outperformed other regions, with a traffic decline of 37.2%.
- Traffic by mall location type declined between 24% and 44%—strip malls outperformed all other location types by 12 percentage points, with a decline of only 24.2%. These locations benefited from being open-air and from the presence of nondiscretionary retailers, such as food retailers.
- Street-front/freestanding and outlet locations witnessed traffic declines of around 37%, while traditional mall locations saw a traffic decline of 35%.
- Luxury locations saw a traffic decline of 43%, while other retail locations, including airports, casinos and hotels, reported a traffic decline of 42%. Many of these locations are situated in destination areas and were substantially impacted by lower foot traffic in tourist areas owing to travel restrictions, as well as consumers avoiding such areas amid the pandemic.