DIpil Das
What’s the Story?
In our Leading Indicators of US Retail Sales monthly series, we examine several key macroeconomic indicators of US retail sales and analyze how they may impact the industry in the months to come. We analyze the latest available data, as of the end of February 2021, from sources such as the US Census Bureau, the US Bureau of Economic Analysts (BEA), the US Bureau of Labor Statistics (BLS) and the US Department of Housing and Urban Development (HUD).Why It Matters
Macroeconomic indicators have a significant impact on overall retail sales growth. Looking at 10 indicators (unemployment rate, labor force participation rate, disposable income per capita, average hourly raises, consumer sentiment, savings rate, gas price, interest rate, housing starts and housing prices), we can historically account for a majority of the variation in retail sales growth and create a strong basis for predicting sales moving forward. The close correlation between retail sales growth predictions based on economic indicators and actual retail sales growth is shown in Figure 1.Figure 1. US Actual Retail Sales ex. Auto and Gas Sales vs. Model Predicted Sales, January 2000–January 2021 (YoY % Change) [caption id="attachment_124174" align="aligncenter" width="725"]
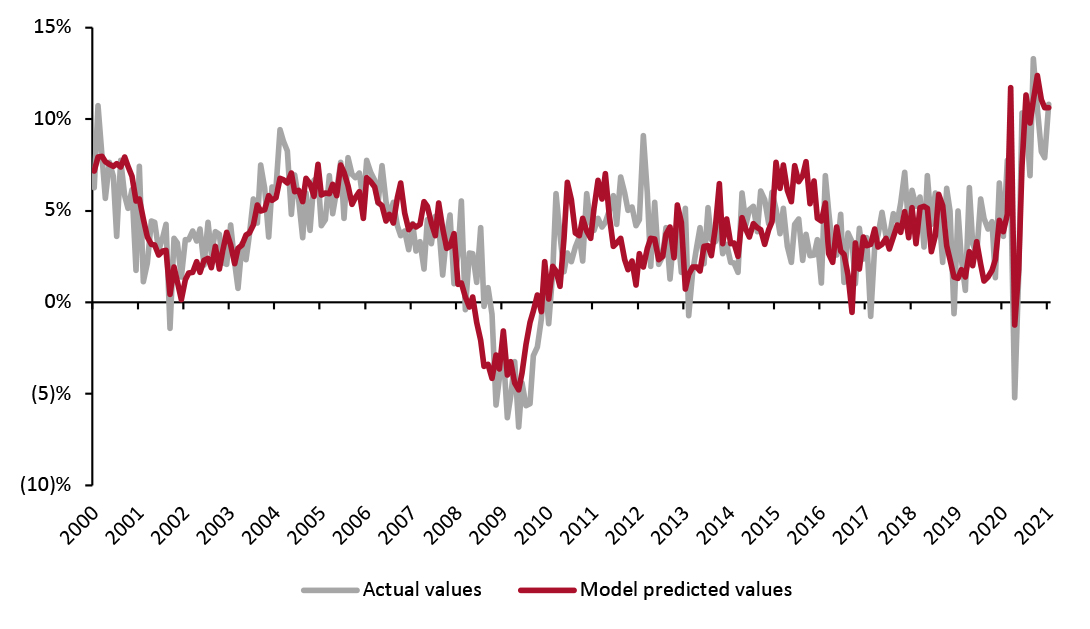 Source: BEA/BLS/Federal Reserve Board of Governors /S&P/Coresight Research[/caption]
Retail sales in January 2021 were exceptionally strong, with year-over-year growth of nearly 11%, excluding auto and gas. This continues a trend of strong retail sales over the course of the Covid-19 pandemic, as consumers are presented with few other avenues through which to spend their money. Analyzing major macroeconomic indicators, we are able to outline what the coming months in sales will look like.
Source: BEA/BLS/Federal Reserve Board of Governors /S&P/Coresight Research[/caption]
Retail sales in January 2021 were exceptionally strong, with year-over-year growth of nearly 11%, excluding auto and gas. This continues a trend of strong retail sales over the course of the Covid-19 pandemic, as consumers are presented with few other avenues through which to spend their money. Analyzing major macroeconomic indicators, we are able to outline what the coming months in sales will look like.
Leading Indicators of US Retail Sales: In Detail
Indicators Overview Of the 10 indicators we examined, six are likely to have a positive impact on retail sales in coming months. Continued relatively high unemployment and low labor force participation rates, combined with a near-record-high savings rate and poor consumer sentiment, are likely to have reined in retail sales in February (figures yet to be reported) after strong January growth, which was driven by stimulus checks. However, high disposable incomes among consumers, coupled with high home prices, should help keep sales growth solid despite other dreary indicators.Figure 2. US: Leading Indicators of Retail Sales, as of the End of February 2021 [caption id="attachment_124175" align="aligncenter" width="725"]
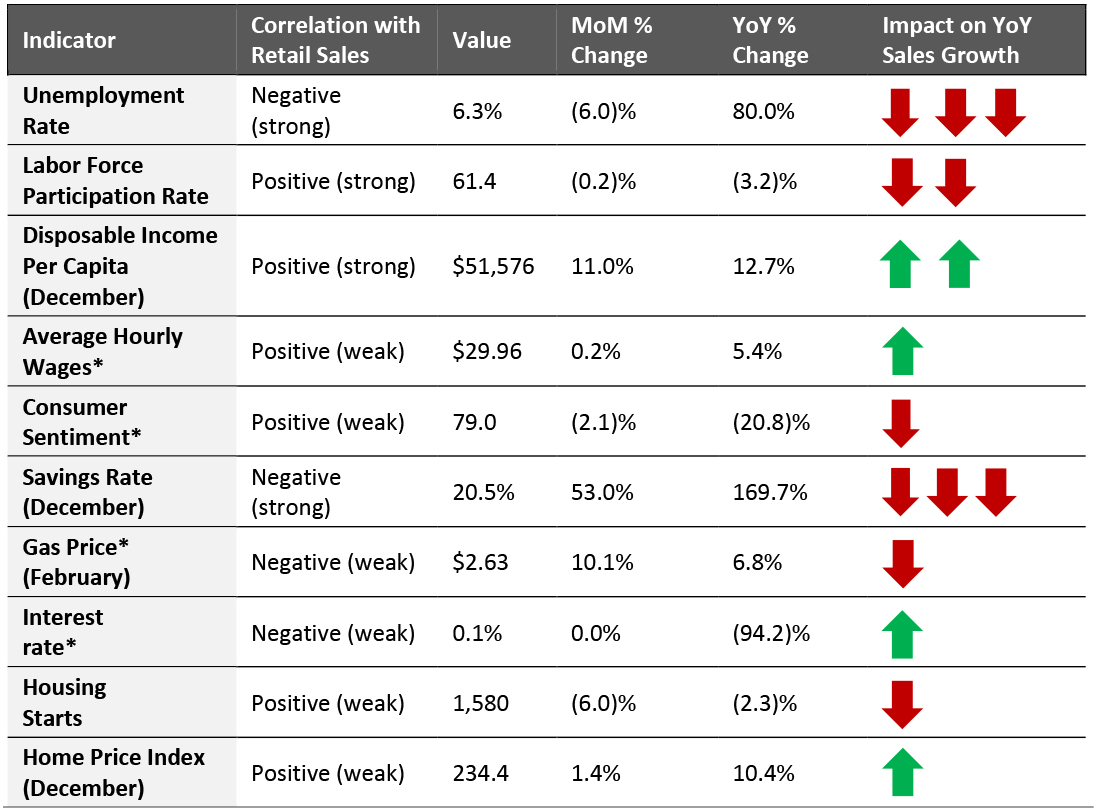 Latest available data from January unless otherwise indicated
 *Not included in predictive model
Source: BEA/BLS/Federal Reserve Board of Governors /S&P/University of Michigan/US Energy Information Administration/Coresight Research [/caption] Looking ahead to yet-to-be-reported February sales and projected sales in March, we predict that retail sales will increase by about 6.3% overall, year over year, as illustrated in Figure 3. Sales growth could slip as low as 5.5% if consumers begin transitioning spending toward services as vaccination efforts gain steam, but growth could also reach 8.0% if stimulus spending in a strong January carries over into February.
Figure 3. US Retail Sales ex. Auto and Gas (YoY % Change) [caption id="attachment_124184" align="aligncenter" width="725"]
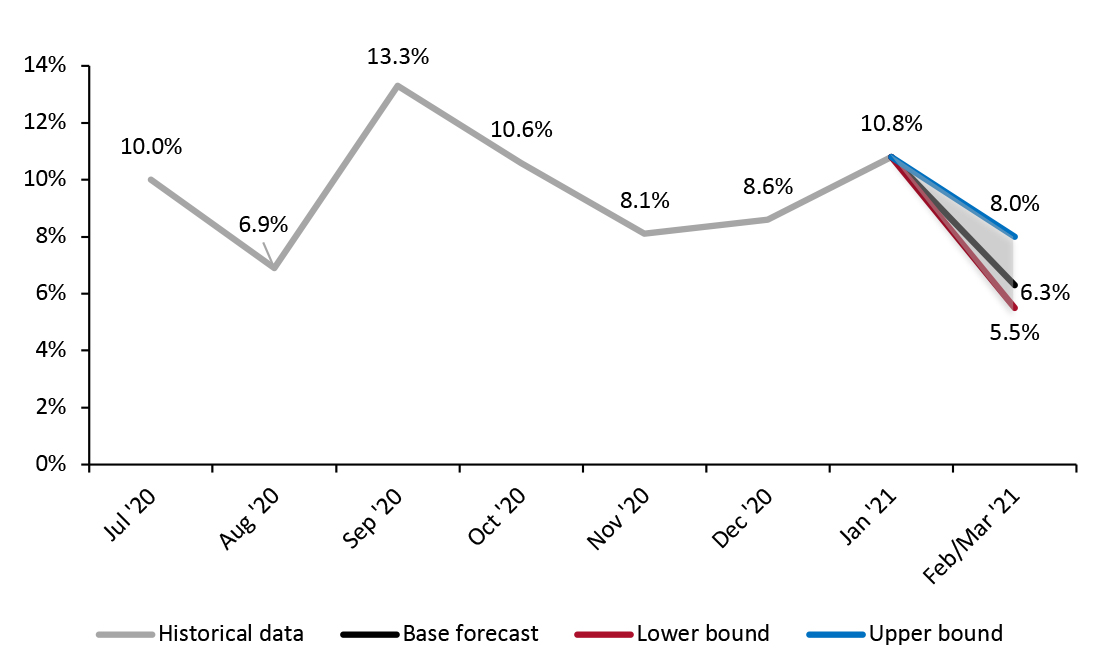 Source: US Census Bureau/BEA/BLS/Federal Reserve Board of Governors /S&P/Coresight Research[/caption]
This projection could turn out to be heavily conservative if, within the timeframe of the estimate, another major stimulus check is passed. This estimate, and the upper and lower bounds, are made assuming no further stimulus is implemented before the end of March.
The Job Market
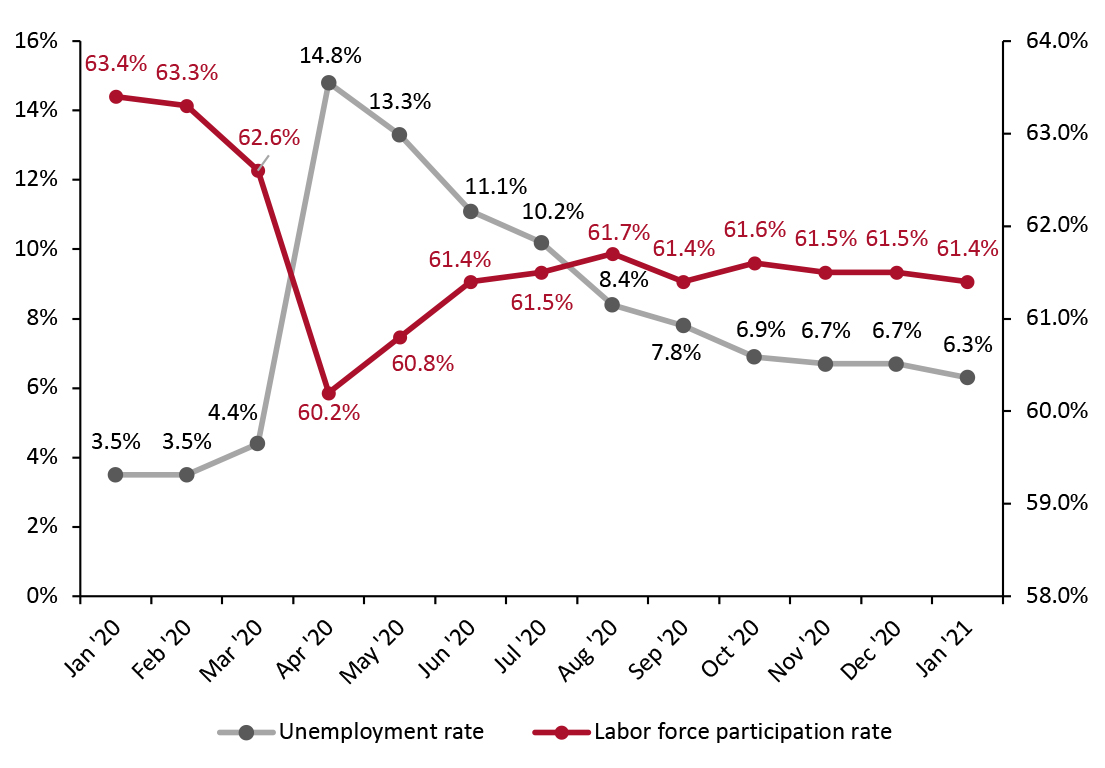
In January 2021, unemployment fell by the largest margin, month over month, since October 2020 (although the total decline since October is just 0.6 percentage points). This indicates that few jobs lost during the pandemic returned in the fall and winter months.
Shifts, or lack thereof, in labor force participation paint a similarly somber picture: January’s participation rate was actually lower than October’s, as labor force participation remains down 2.0 percentage points versus January 2020. Discouraged workers and those forced to take time off to care for children amid school closures remain out of the force.
Recovery was swift in the labor market over summer 2020 as strict lockdowns were eased, enabling some retail and service industry jobs to return. However, since then, less progress has been made on reopening the economy: Bars and restaurants still have capacity constraints; travel remains heavily restricted; and Coresight Research’s US Consumer Tracker shows that more than 78% of consumers are currently avoiding public areas. For the labor market to take recovery to the next level, virus cases must decrease immensely.
Source: US Census Bureau/BEA/BLS/Federal Reserve Board of Governors /S&P/Coresight Research[/caption]
This projection could turn out to be heavily conservative if, within the timeframe of the estimate, another major stimulus check is passed. This estimate, and the upper and lower bounds, are made assuming no further stimulus is implemented before the end of March.
The Job Market
In January 2021, unemployment fell by the largest margin, month over month, since October 2020 (although the total decline since October is just 0.6 percentage points). This indicates that few jobs lost during the pandemic returned in the fall and winter months.
Shifts, or lack thereof, in labor force participation paint a similarly somber picture: January’s participation rate was actually lower than October’s, as labor force participation remains down 2.0 percentage points versus January 2020. Discouraged workers and those forced to take time off to care for children amid school closures remain out of the force.
Recovery was swift in the labor market over summer 2020 as strict lockdowns were eased, enabling some retail and service industry jobs to return. However, since then, less progress has been made on reopening the economy: Bars and restaurants still have capacity constraints; travel remains heavily restricted; and Coresight Research’s US Consumer Tracker shows that more than 78% of consumers are currently avoiding public areas. For the labor market to take recovery to the next level, virus cases must decrease immensely.
Figure 4. US Unemployment Rate (Left Axis, %) and Labor Force Participation Rate (Right Axis, %) [caption id="attachment_124177" align="aligncenter" width="725"]
 Source: BLS[/caption]
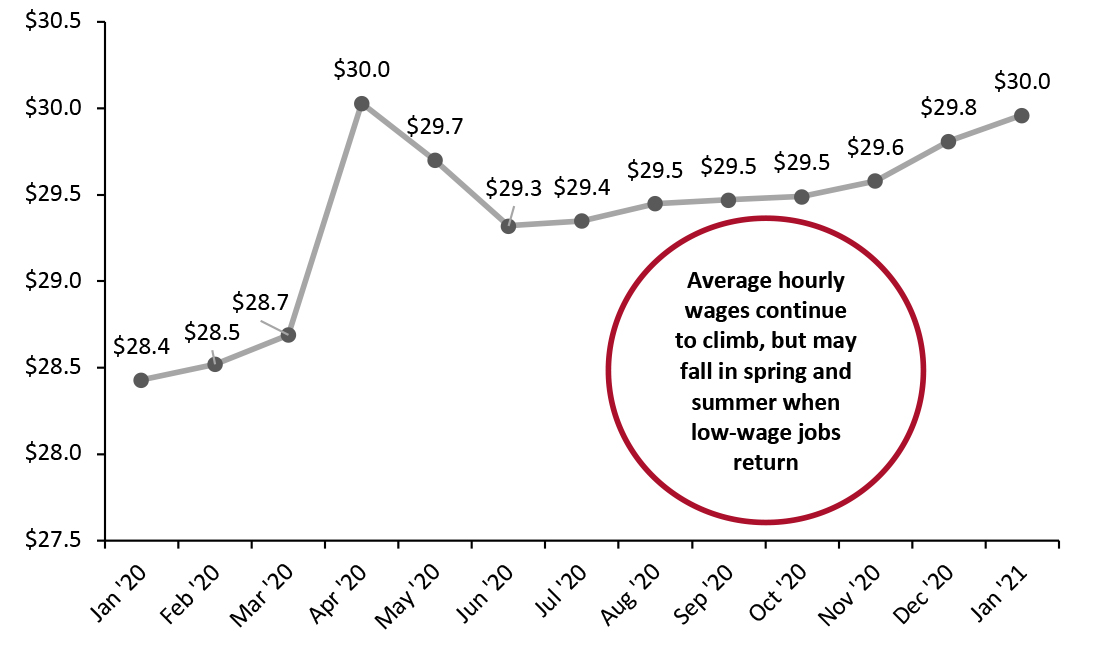
Average hourly wages across all private-sector employees stood at $29.96 as of January 2021, continuing an upward trend seen since the beginning of the crisis and representing the seventh consecutive period of month-over-month wage growth.
Source: BLS[/caption]
Average hourly wages across all private-sector employees stood at $29.96 as of January 2021, continuing an upward trend seen since the beginning of the crisis and representing the seventh consecutive period of month-over-month wage growth.
Figure 5. US Average Hourly Wages, All Private-Sector Employees (USD) [caption id="attachment_124178" align="aligncenter" width="725"]
 Source: BLS[/caption]
As we highlighted last month, a sustained rise in average hourly wages is typically a positive indicator for consumer spending, but the rise in wages during the pandemic has been driven by a reduction in the employment of low-wage workers. Looking ahead, we may actually see average wages drop over the summer as more low-wage workers return to employment.
Implications
The bounceback of the labor market remains slow and uneven, hitting lower-income consumers hardest and shaping the current rebound into a bifurcated recovery, divided along income fault lines. It is unlikely that we will see significant movement in labor numbers in the next two months to be reported (February and March), as the cold weather will continue to make outdoor activities less attractive, and continued caution around indoor activities tempers the recovery of much of the service industry. Herd immunity will see the return of jobs in many low-wage sectors, but that recovery remains at least three months in the future. For now, retailers must continue to target two discrete groups of consumers: high-income workers who have retained their jobs and are spending strongly thanks to the housing and stock markets; and low-income consumers, many of whom have been out of jobs for months, who are very cost conscious.
Income, Savings and Sentiment
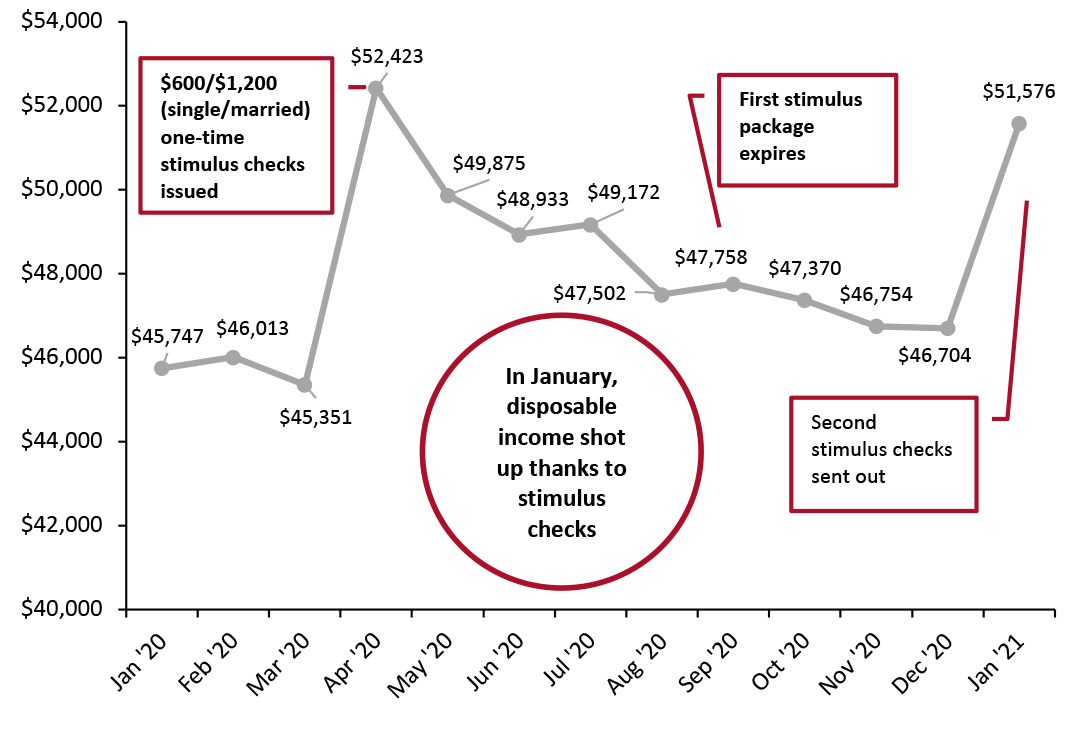
Disposable income rose to $51,576 in January off the back of a second round of stimulus checks issued by the government, bucking a nearly uniform decline since its jump in April, when consumers first felt the benefits of government aid packages. This rise in income helped contribute to strong retail sales in January, but the one-off nature of the checks consumers received mean they are likely to have an underwhelming effect on sales in February and March.
Source: BLS[/caption]
As we highlighted last month, a sustained rise in average hourly wages is typically a positive indicator for consumer spending, but the rise in wages during the pandemic has been driven by a reduction in the employment of low-wage workers. Looking ahead, we may actually see average wages drop over the summer as more low-wage workers return to employment.
Implications
The bounceback of the labor market remains slow and uneven, hitting lower-income consumers hardest and shaping the current rebound into a bifurcated recovery, divided along income fault lines. It is unlikely that we will see significant movement in labor numbers in the next two months to be reported (February and March), as the cold weather will continue to make outdoor activities less attractive, and continued caution around indoor activities tempers the recovery of much of the service industry. Herd immunity will see the return of jobs in many low-wage sectors, but that recovery remains at least three months in the future. For now, retailers must continue to target two discrete groups of consumers: high-income workers who have retained their jobs and are spending strongly thanks to the housing and stock markets; and low-income consumers, many of whom have been out of jobs for months, who are very cost conscious.
Income, Savings and Sentiment
Disposable income rose to $51,576 in January off the back of a second round of stimulus checks issued by the government, bucking a nearly uniform decline since its jump in April, when consumers first felt the benefits of government aid packages. This rise in income helped contribute to strong retail sales in January, but the one-off nature of the checks consumers received mean they are likely to have an underwhelming effect on sales in February and March.
Figure 6. US Annualized Real Disposable Income Per Capita (USD) [caption id="attachment_124179" align="aligncenter" width="725"]
 Source: BEA[/caption]
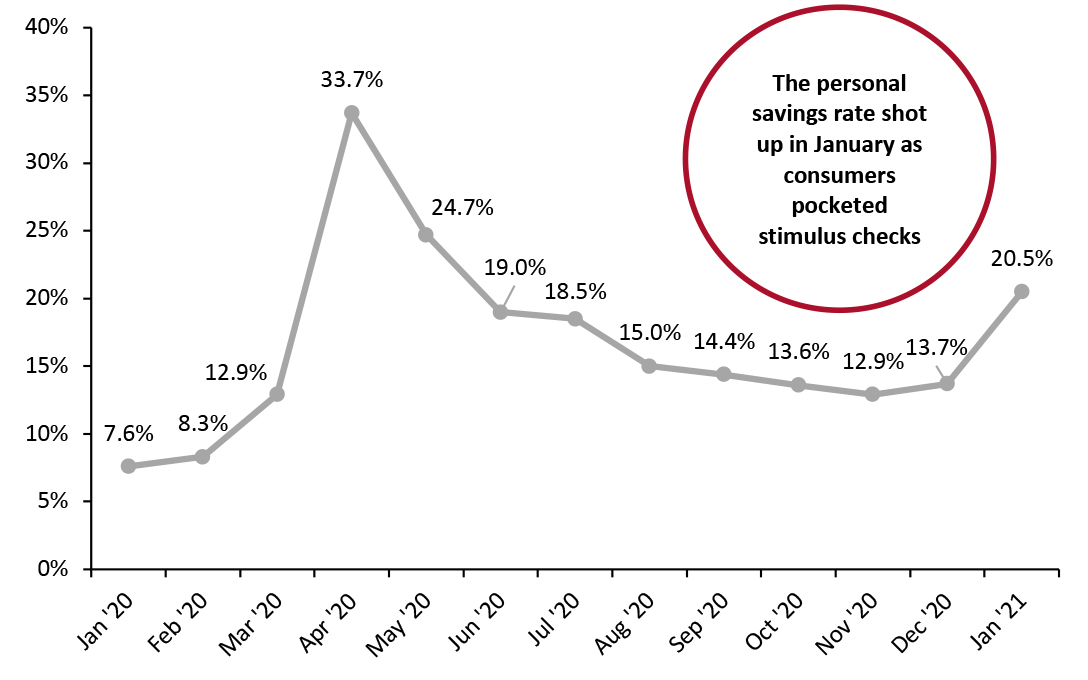
After declining steadily since April, the personal savings rate rose slightly in December 2020 to 13.7% and shot up to 20.5% in January 2021, as many consumers saved money acquired through stimulus checks. With spending options still very limited, the personal savings rate remains unprecedently high and will likely remain so until virus case numbers are drastically lowered—then, we may see a sharp drop in the savings rate as consumers unleash pent-up spending.
Source: BEA[/caption]
After declining steadily since April, the personal savings rate rose slightly in December 2020 to 13.7% and shot up to 20.5% in January 2021, as many consumers saved money acquired through stimulus checks. With spending options still very limited, the personal savings rate remains unprecedently high and will likely remain so until virus case numbers are drastically lowered—then, we may see a sharp drop in the savings rate as consumers unleash pent-up spending.
Figure 7. Personal Savings Rate (%) [caption id="attachment_124180" align="aligncenter" width="725"]
 Source: BEA[/caption]
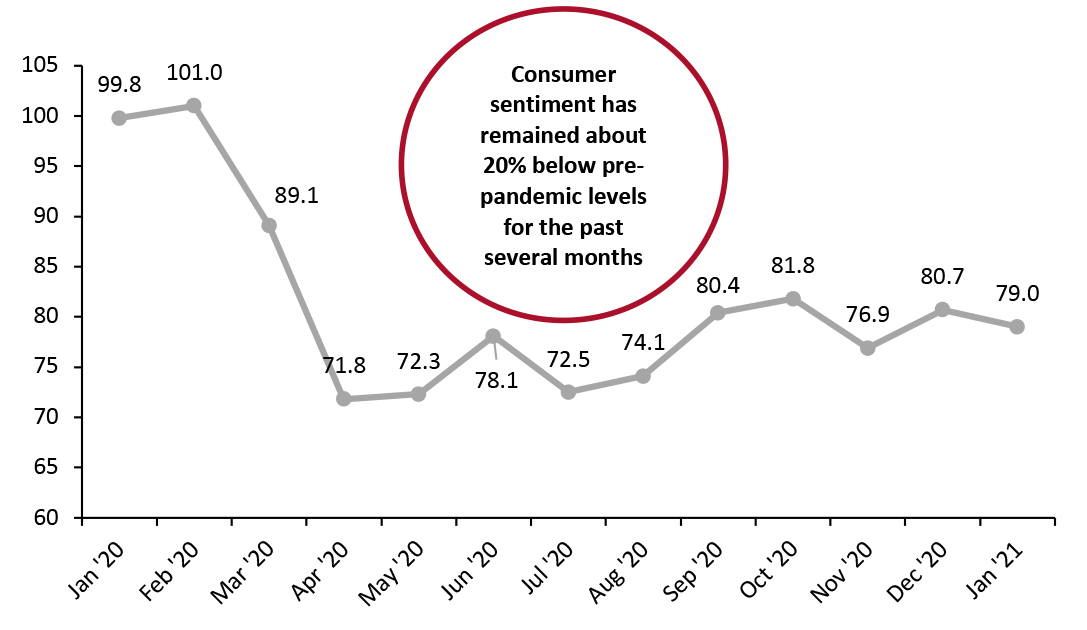
The recovery in consumer sentiment has stalled in recent months. After rebounding from 71.8 in April to 81.8 in October, consumer sentiment has fallen overall since October 2020 (see Figure 8).
More than one in 10 Americans have now received their first Covid-19 vaccine, giving hope to many consumers who have been worried for almost a full year about the pandemic’s effect on their lives and livelihoods. Consumer sentiment is therefore likely to rebound in spring.
Source: BEA[/caption]
The recovery in consumer sentiment has stalled in recent months. After rebounding from 71.8 in April to 81.8 in October, consumer sentiment has fallen overall since October 2020 (see Figure 8).
More than one in 10 Americans have now received their first Covid-19 vaccine, giving hope to many consumers who have been worried for almost a full year about the pandemic’s effect on their lives and livelihoods. Consumer sentiment is therefore likely to rebound in spring.
Figure 8. University of Michigan Consumer Sentiment Index [caption id="attachment_124181" align="aligncenter" width="725"]
 Source: University of Michigan[/caption]
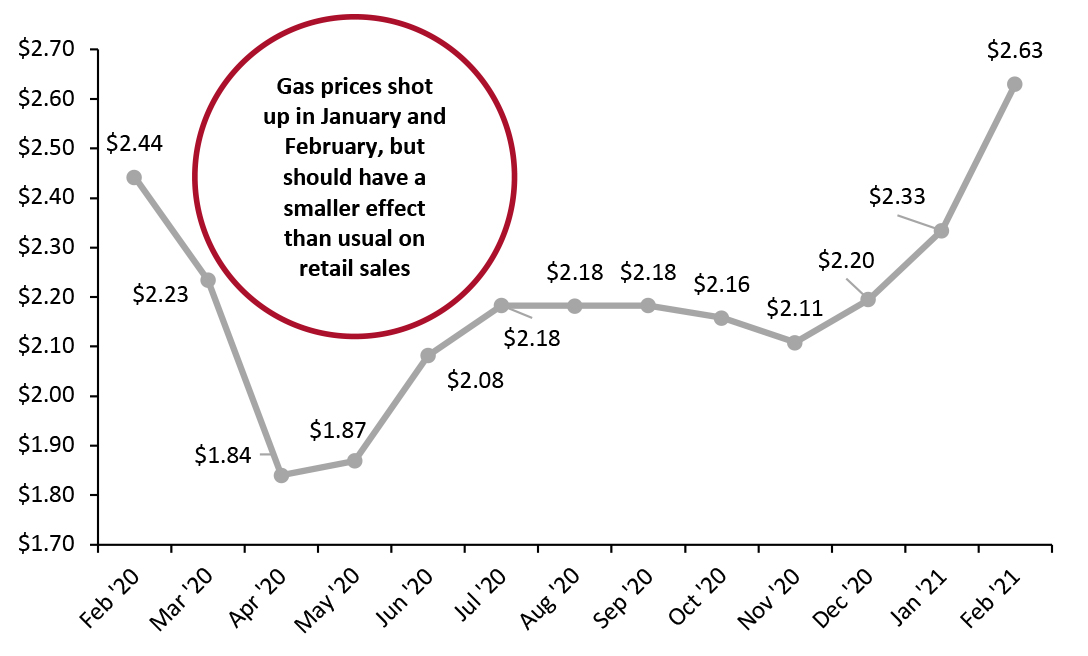
Gas prices have spiked in recent months, rising to $2.63 in February 2021 after falling as low as $2.11 in November 2020.
Source: University of Michigan[/caption]
Gas prices have spiked in recent months, rising to $2.63 in February 2021 after falling as low as $2.11 in November 2020.
Figure 9. US Regular All Formulations Gas Price (Dollars per Gallon) [caption id="attachment_124182" align="aligncenter" width="725"]
 Source: US Energy Information Administration[/caption]
During much of the pandemic, low gas prices have helped consumers afford to spend more on alternative products. Normally, such a sharp increase in gas prices would have substantial effects on consumers’ abilities to spend on other products. However, with consumers still driving far less than pre-pandemic, the drag of high gas prices on retail sales is likely to be underwhelming.
Implications
The rise in the savings rate, coupled with underwhelming consumer confidence, indicates that in the short term, consumers are not going back to their pre-pandemic spending habits. The good news for retailers is that most of the money consumers are saving is coming out of their usual expenditures on services and experiences, not goods. In fact, keeping the savings rate high for now may actually be beneficial for retailers in the long run: Consumers are spending well on retail goods as they have few spending alternatives, but as more avenues of opportunity open over the spring and summer, retailers will face stiffer competition for the dollars of consumers. High savings now will translate to more spending firepower once the crisis is under control, increasing the amount of money to go around to both service providers and retailers in a more competitive economic landscape in the future.
Housing
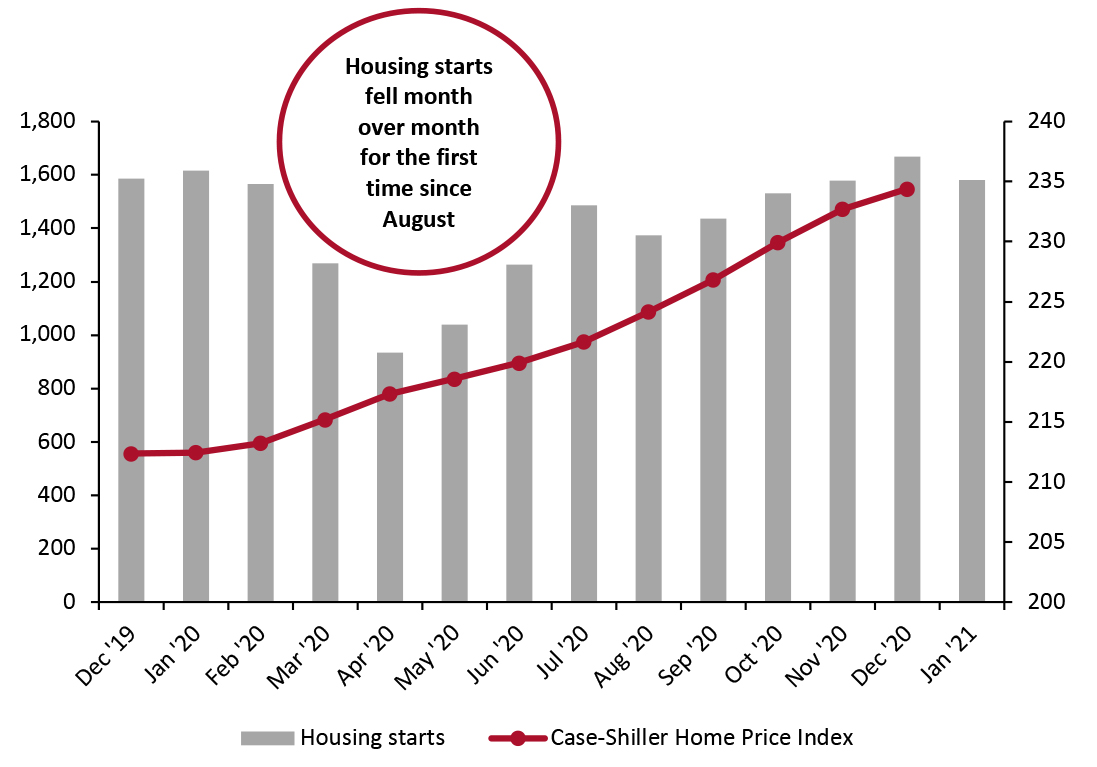
The pandemic-led boom in the housing market may finally be slowing, as housing starts fell by 2.3% month over month in January 2021, and the rate of price increases slowed in December 2020 (the last month for which data were available). While housing starts were up more than 5% year over year in December, they were down 6.0% in January, likely indicating that consumers’ flight from cities is largely over.
Source: US Energy Information Administration[/caption]
During much of the pandemic, low gas prices have helped consumers afford to spend more on alternative products. Normally, such a sharp increase in gas prices would have substantial effects on consumers’ abilities to spend on other products. However, with consumers still driving far less than pre-pandemic, the drag of high gas prices on retail sales is likely to be underwhelming.
Implications
The rise in the savings rate, coupled with underwhelming consumer confidence, indicates that in the short term, consumers are not going back to their pre-pandemic spending habits. The good news for retailers is that most of the money consumers are saving is coming out of their usual expenditures on services and experiences, not goods. In fact, keeping the savings rate high for now may actually be beneficial for retailers in the long run: Consumers are spending well on retail goods as they have few spending alternatives, but as more avenues of opportunity open over the spring and summer, retailers will face stiffer competition for the dollars of consumers. High savings now will translate to more spending firepower once the crisis is under control, increasing the amount of money to go around to both service providers and retailers in a more competitive economic landscape in the future.
Housing
The pandemic-led boom in the housing market may finally be slowing, as housing starts fell by 2.3% month over month in January 2021, and the rate of price increases slowed in December 2020 (the last month for which data were available). While housing starts were up more than 5% year over year in December, they were down 6.0% in January, likely indicating that consumers’ flight from cities is largely over.
Figure 10. Housing Starts (Left Axis) and Case-Shiller US Home Price Index (Right Axis) [caption id="attachment_124183" align="aligncenter" width="725"]
 Source: HUD/US Census Bureau[/caption]
However, the housing market appears to be in good shape thanks to low interest rates (the Federal Funds rate remained below 0.1% this month at 0.09%) and rising prices. Despite growing at a slightly slower rate in December than in previous months, home prices were up 10.4% year over year, according to data from S&P.
Implications
Despite housing starts faltering, home prices remain high and growing, which should continue to boost spending among home-owning consumers, especially when combined with the continued strong performance of the stock market.
However, the slowdown in housing starts as pandemic-driven moves fade into the past mean that home improvement and other home-related categories are likely to see smaller revenue growth in the coming months than they did over the course of much of 2020, when a combination of frequent housing starts and homebound consumers helped sales skyrocket.
Source: HUD/US Census Bureau[/caption]
However, the housing market appears to be in good shape thanks to low interest rates (the Federal Funds rate remained below 0.1% this month at 0.09%) and rising prices. Despite growing at a slightly slower rate in December than in previous months, home prices were up 10.4% year over year, according to data from S&P.
Implications
Despite housing starts faltering, home prices remain high and growing, which should continue to boost spending among home-owning consumers, especially when combined with the continued strong performance of the stock market.
However, the slowdown in housing starts as pandemic-driven moves fade into the past mean that home improvement and other home-related categories are likely to see smaller revenue growth in the coming months than they did over the course of much of 2020, when a combination of frequent housing starts and homebound consumers helped sales skyrocket.
What We Think
Exceptionally strong January retail sales were likely due in large part to the issuance of a new round of stimulus checks, so we do not expect February or March to see such high performance. Implications for Brands/Retailers- Retailers must expect a large portion of the population who remain unemployed or out of the labor force to continue to be particularly cost conscious, especially if a third round of stimulus continues to be delayed.
- High savings rates are bad news for short-term spending, but brands and retailers can take solace in the fact that most savings are coming from spending diverted away from services and experiences.
- Brands and retailers should begin looking ahead to a retail world post vaccine, where they will again have to compete with experiences and services for the attention of consumers.