
albert Chan
Introduction
Modern retailers face increasing competition from e-commerce companies, which leverage their data-centric nature to offer greater convenience and a long tail of products and services to consumers.
While physical retailers are embracing analytics more than ever before, there is substantial headroom to apply more data in developing solutions to common retail problems, especially execution. However, there are challenges for retailers in implementing a data-driven decision-making model:
- Usability—Many retailers distribute their data to employees in the form of reports, which are often too complex to understand, are vulnerable to personal and political biases and may be difficult to connect to their daily decisions.
- Capacity—Today’s retail employees are more pressed for time than ever before and very few have the capacity to learn new analytical techniques, collect data from disparate sources or interpret raw data into what is needed to make a decision.
- Labor—Labor, the highest expense for retailers, is stretched thin. Less advanced data analysis tools lack the ability to prioritize tasks. Such prioritization is essential for creating the best, unique consumer journey to ensure customers come back again.
- Lack of accountability—There is limited accountability for using data in decision-making and frequently no way of tracking if data was used in the process or not.
These execution issues can negatively impact a company’s revenues and efficiency, as well as customer satisfaction, causing a ripple effect throughout the organization.
Prescriptive analytics can help solve the above challenges by providing an unambiguous explanation of the issue to be solved plus the action to be taken, both of which are directed to the appropriate responder in plain, clear text. Prescriptive analytics also includes a feedback loop to verify that each task was completed and to assess the effectiveness of the action, so that processes can be improved upon in the future.
The use of prescriptive analytics offers opportunities for companies to boost revenues and increase their efficiency, among other benefits. Retailers implementing prescriptive analytics have seen a 10–15-basis-point increase in margin, in addition to improvements in inventory accuracy, labor productivity, operational efficiency and much more, all within a six-month timeframe, according to data from Zebra Technologies.
Current Retail Challenges
Retailers today face the challenge of offering a great customer experience while driving revenue growth and managing costs, productivity and labor. They also face a number of challenges that can negatively impact efficiency and increase costs—such as misallocated labor and inventory, noncompliance, fraud and other issues that lead to a loss of sales and reduced margins (see Figure 1).
[caption id="attachment_112483" align="aligncenter" width="700"]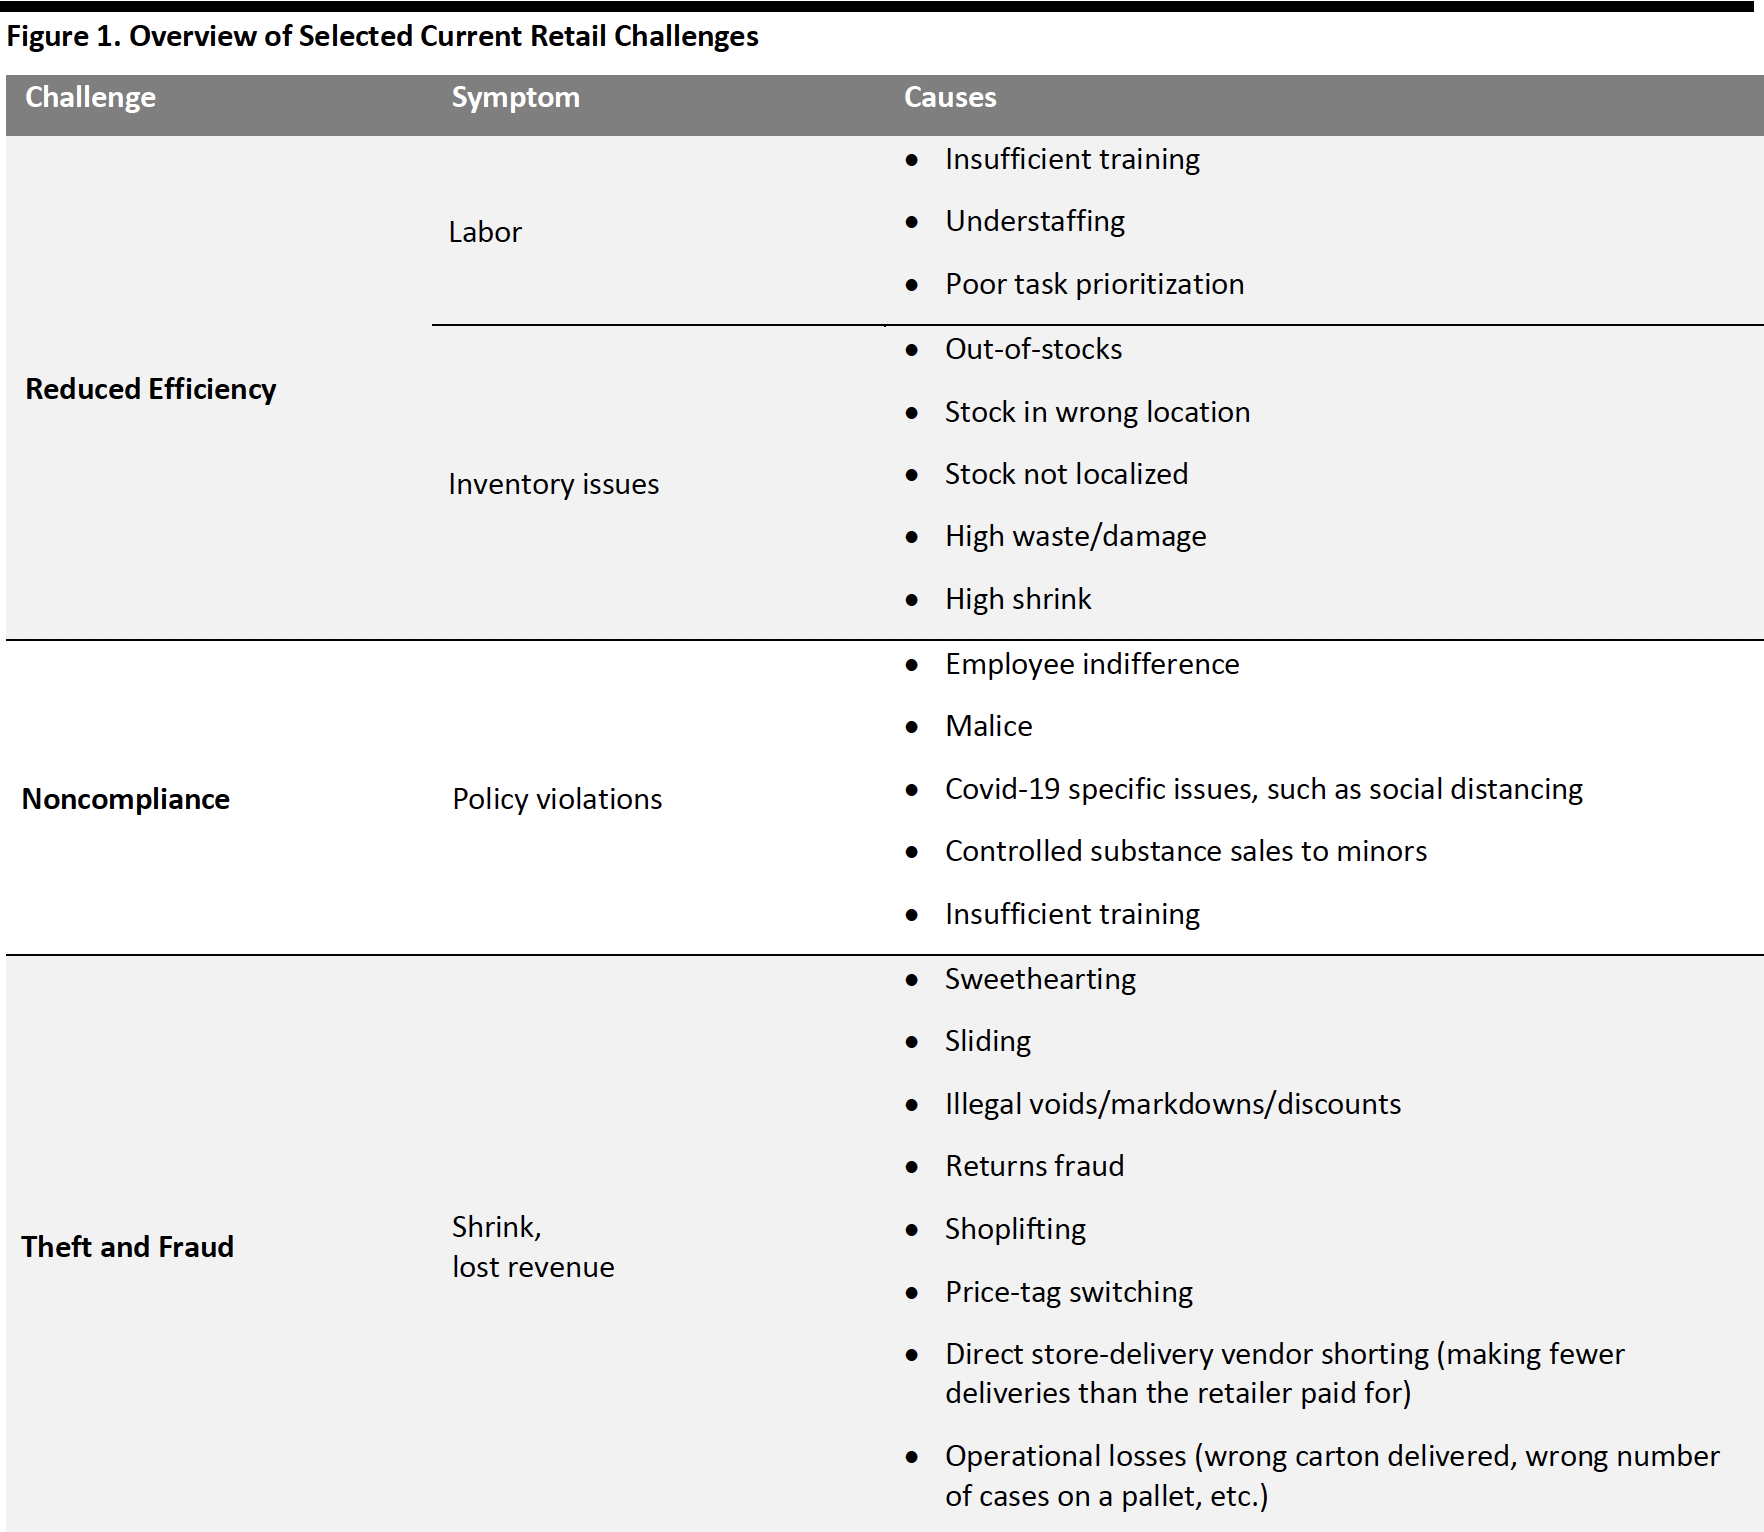 Source: Coresight Research[/caption]
Reduced Efficiency
There are several factors that can reduce efficiency in a physical store:
- Labor—Labor is often one of the largest expenses for a retailer. Having the right amount of labor at the right time and focused on the right tasks is critical not only for maintaining profits but also for ensuring a positive customer experience. Shortages in labor caused by illness, insufficient training and even understaffing can reduce efficiency and erode profits.
- Inventory issues—Challenges such as out-of-stocks, overstocks and suboptimal assortments reduce efficiency and hurt revenues and margins.
o Out-of-stocks: Empty shelves and missing inventory can disappoint customers, leading them to switch to another retailer.
o Stock in the wrong location: Improperly deployed inventory may sell poorly and need to be heavily discounted or transferred to another location.
o Stock not sufficiently localized: Inventory that does not resonate with the store’s demographic will have to be relocated or discounted.
o High shrink: Unusually high shrink on an item is an indicator of other issues, such as mis-shipments, theft or fraud.
o Inventory inaccuracy: Product that a retailer’s system “thinks” is available when it actually is not is called phantom inventory and can strike a crippling blow to the customer experience.
o Other issues: The location of product within the store, in addition to its quality and appearance, can affect its salability.
Noncompliance
Retail employees fail to obey rules for a variety of reasons, which can arise from malicious or non-malicious intent. Malicious noncompliance includes dismissing rules or not taking them seriously. For example, if a store employee does not check customer identification when selling tobacco or alcohol, this could endanger the company’s business license. Other examples of malicious noncompliance include punching in early for a shift, improperly marking down product or mishandling product, resulting in damage.
Non-malicious noncompliance includes negligence or situations when the employee does not have a clear understanding of company policies. For example, an employee evading protocols to get things done faster is not necessarily malicious, but it hurts efficiency nonetheless. Employees also need to ensure that their shelf arrangements (realograms) align with planograms, which detail the products that must be placed in specific locations on the shelf. A large portion of trade promotional funds between CPG manufacturers and retailers are at risk due to misalignment of realograms with the agreed-upon planograms.
Non-malicious noncompliance can also result from the misexecution of external protocols, not just the retailer’s. In certain states, for example, reverse logistics of hazardous materials needs to be handled differently than others. Even shampoo is considered a hazardous material and is monitored by some states’ officials. This complexity creates a strong risk of noncompliance.
Theft and Fraud
Unfortunately, various types of theft and fraud exist that create a number of issues for retailers. The National Retail Federation (NRF) estimates that theft, fraud and other forms of shrink amounted to $50.6 billion in 2018, up 8% from the prior year and representing 1.38% of retail sales.
[caption id="attachment_112484" align="aligncenter" width="550"]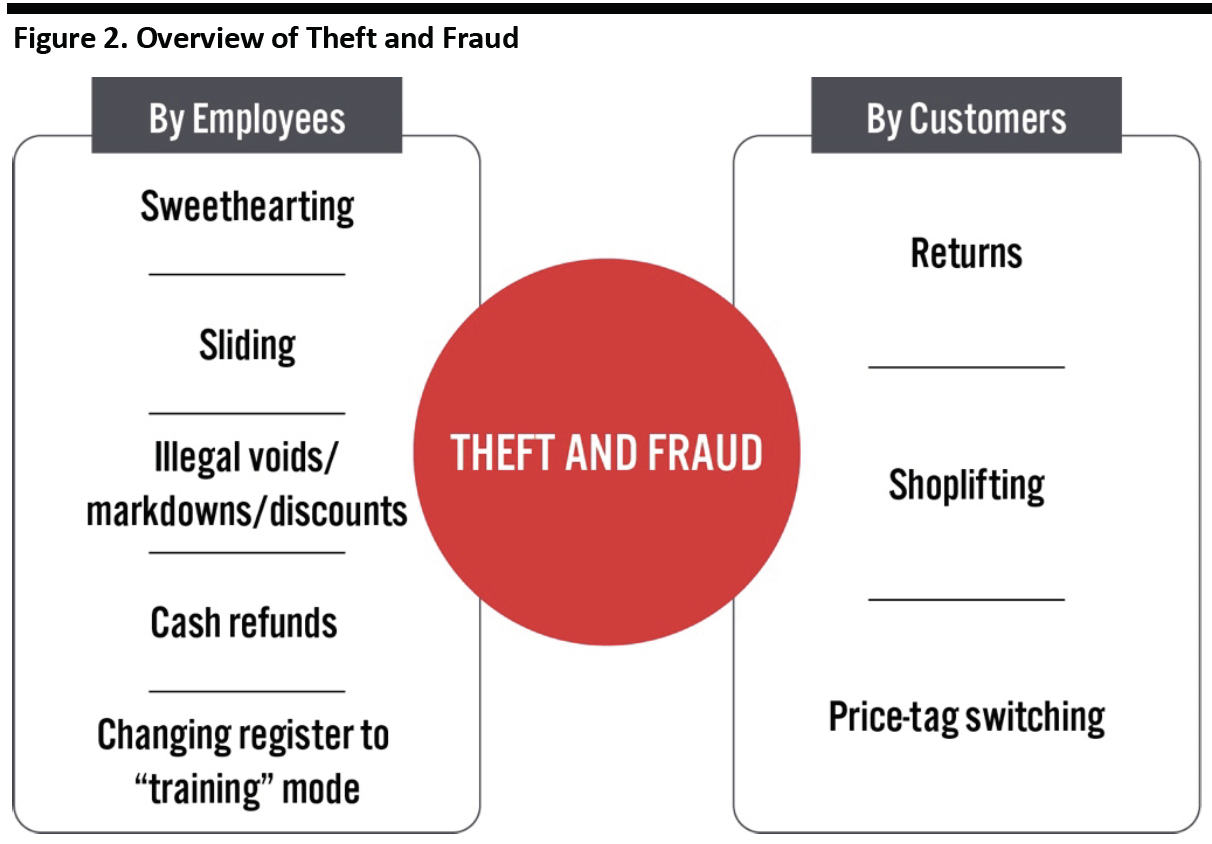 Source: Coresight Research[/caption]
By Employees
- Sweethearting: Store employees provide product for free or at a reduced cost to friends and family.
- Sliding: The cashier slides a product over the scanner while discreetly covering the barcode—a fraudulent means of providing product at no cost to the customer that is difficult to detect through a security camera.
- Illegal voids/markdowns/discounts: Cashiers find ways to apply discounts to ineligible product. In one scenario, a sales associate might scan the product and quickly void the transaction while still giving the merchandise to the customer. In another, the associate marks down ineligible items by removing clearance tags from discounted items and improperly attaching them to non-discounted merchandise or by manually entering a different price without scanning the item.
- Cash refunds: This is when a store associate leverages cash receipts from earlier in the day or week to “refund” the merchandise to a store’s inventory, getting the cash back.
- Changing register to “training” mode: While customers shop and pay for the inventory, a register in training mode can conduct customer transactions without linking them to the cash in the drawer. This leaves the associate free to pocket the cash.
By Customers
- Returns: Returns fraud takes many forms. One example is a customer taking an item off the shelf and bringing it to the returns counter in an attempt to get store credit as a non-receipted return. Another type of fraud consists of buying a product legitimately and returning a cheaper product for credit on the premium product. Between getting the refund and reselling the premium product at its full value, the perpetrator makes a substantial profit.
- Shoplifting: This type of theft consists of taking items from the shelf and walking out of the store with them in outright theft.
- Price-tag switching: Thieves may tamper with an item’s price tag to obtain a lower price or attempt to return a sale item at full price at a later time.
What Is Holding Retailers Back?
There are several reasons why retailers are unable to adequately address labor inefficiencies, noncompliance, theft and fraud. Retailers may not be collecting, or correctly interpreting, the data they possess. Alternatively, they may rely on understanding issues via reports, which are static, are prone to bias and lack a mechanism for enforcing compliance.
Lack of Data Collection and/or Analysis
Retailers may not be leveraging the appropriate data to mitigate reduced efficiency and fraud. Data may be available but not collected, or the data may not be digitalized—i.e., converted into digital data that can be processed by software.
There is a variety of data available to retailers that can be analyzed to address the challenges they face:
- Event-driven data, which is generated when a meaningful event occurs in the store
- Customer data, including purchase history and customer preferences
- Supply chain location data as products transition through the supply chain to the warehouse and the store
- Product location data on inventory within the store
- Text data mined from product reviews and social media
- Video data, including customer traffic counts, which can provide information on inventory and customer movements within the store
For the data to be useful, it first must be collected and analyzed, and the insights generated from that analysis must be accurate and actionable.
Focus on Reports
In some cases, retailers are using some or all of the aforementioned data sources in standard reporting, but many issues still exist:
- Lengthy—Reports can present reams of data without a clear roadmap as to which analysis and actions are the most important.
- Information only—Reports are simply summaries of data. The value of reporting depends on the willingness and ability of the recipient to read and understand a report, as well as translate the data into actionable insights.
- Bias—Each person that reads a report has preconceived notions and biases, and so is likely to interpret the data based on their personal experiences and circumstances. A report’s findings can easily be twisted and used to deflect blame onto others for a perceived inefficiency or failure.
- Unmonitored compliance—Reports do not inherently contain mechanisms that verify if the recipient actually read, understood and/or acted on it.
- Static—Reports lack a direct feedback loop to measure the effectiveness of the completed task, nor the ability to “learn” best practices to improve their efficacy over time.
The image below illustrates how one graph in a report can launch a variety of interpretations and defensive reactions among employees.
[caption id="attachment_112485" align="aligncenter" width="550"]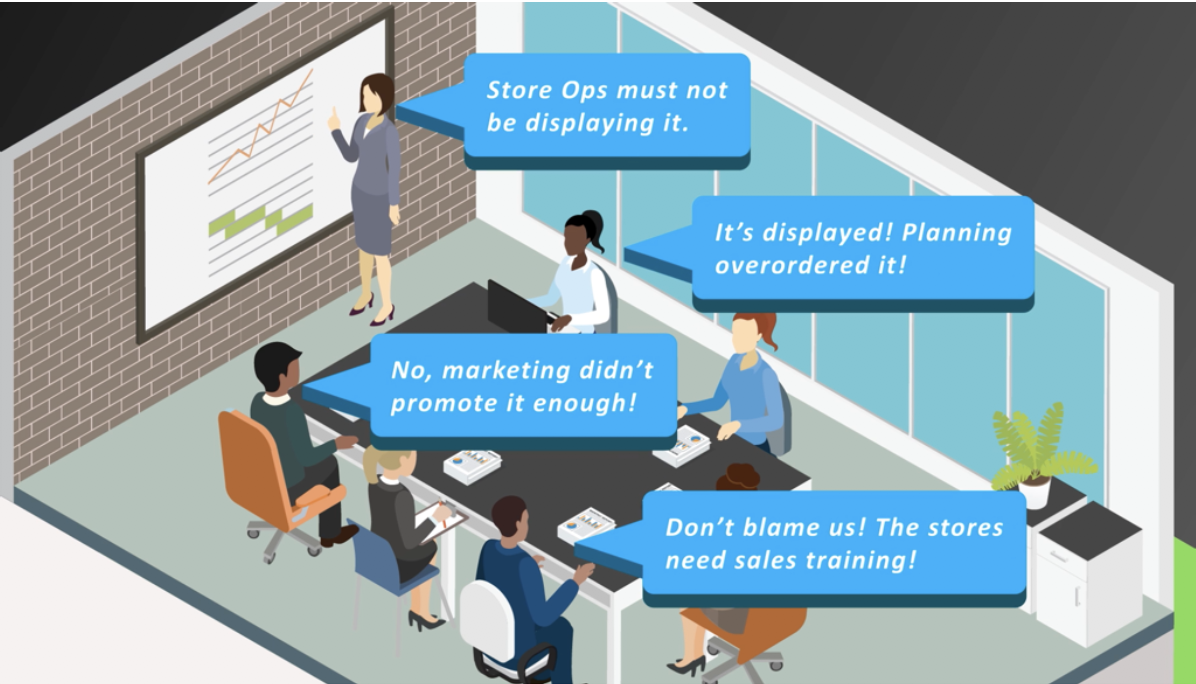 Source: Zebra Technologies[/caption]
An overreliance on static reporting can also result in inaction, causing retailers to miss opportunities to increase revenues and realize operational efficiencies. The image below illustrates how a reliance on reports can result in the sales associate guessing the proper corrective action.
[caption id="attachment_112486" align="aligncenter" width="550"]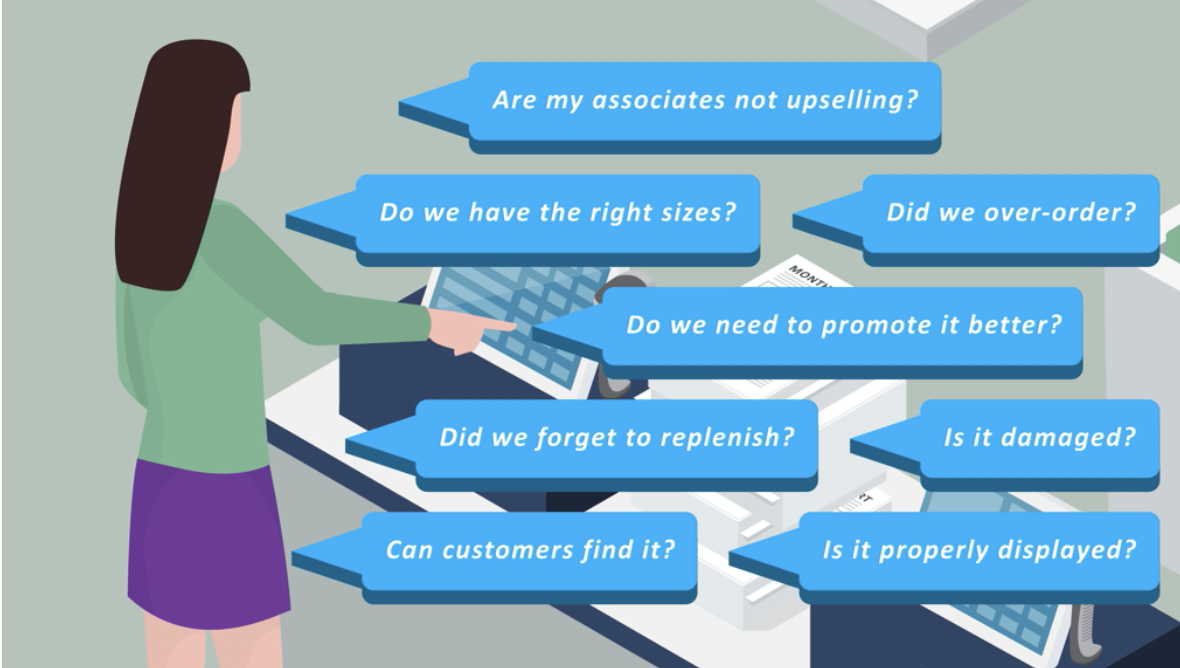 Source: Zebra Technologies[/caption]
Prescriptive Analytics Enables Prompt Action and Completion
Prescriptive analytics addresses many of the challenges discussed above and offers many advantages over report-based predictive analytics. For example, it provides retailers with recommendations for actions to take based on the available data, ensuring that users better understand and interpret the data—removing much of the bias and risk of inaction associated with reports.
Predictive vs. Prescriptive Analytics
While both predictive and prescriptive analytics use similar techniques, the latter takes data analysis one step further by “prescribing” actions to a relevant stakeholder to achieve a desirable outcome.
[caption id="attachment_112487" align="aligncenter" width="550"]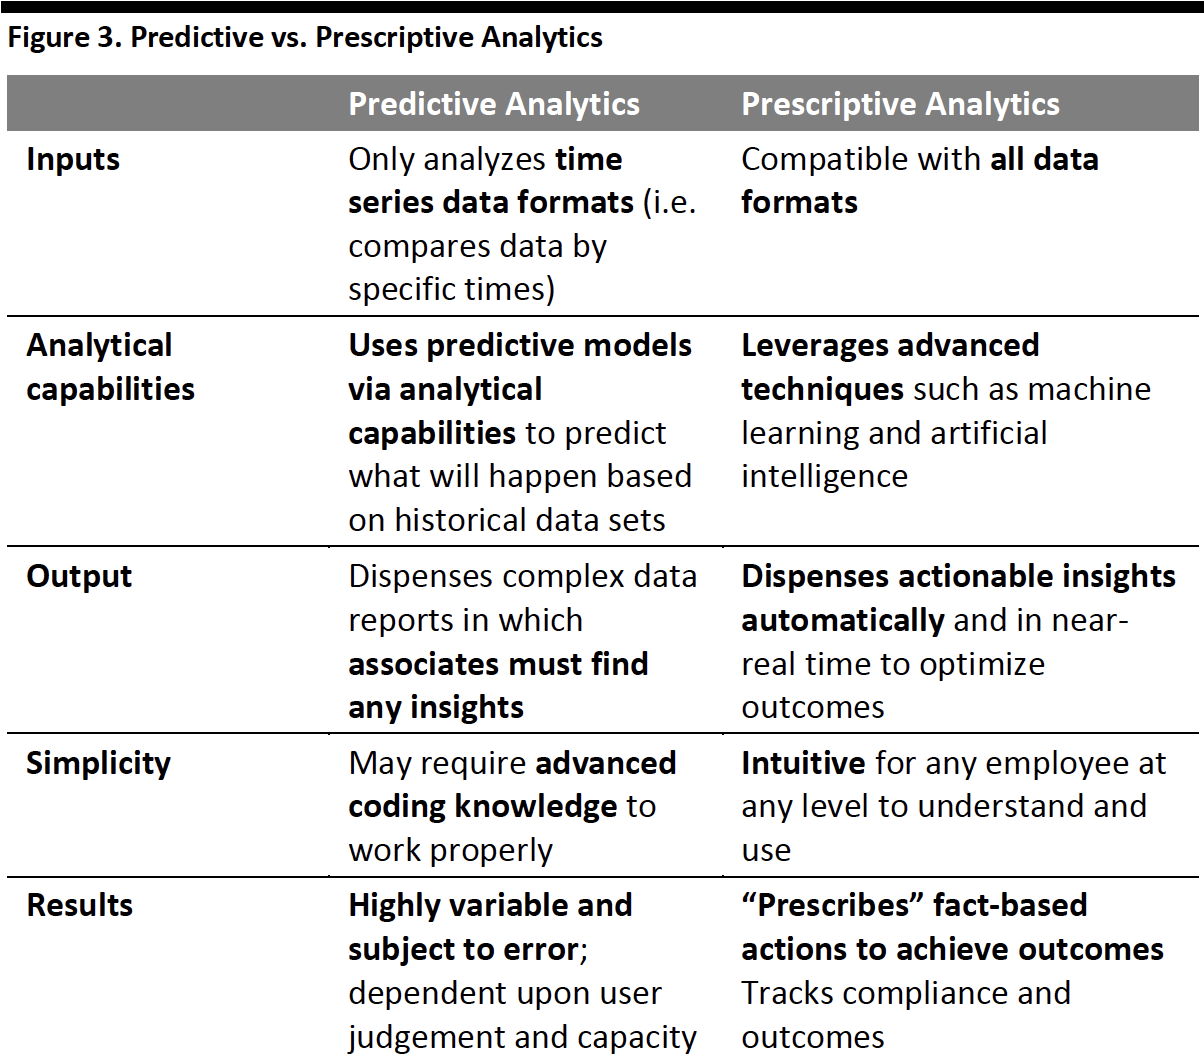 Source: Coresight Research[/caption]
The three parts of a typical prescriptive analytics response to a typical sales shortfall are illustrated in the image below.
[caption id="attachment_112488" align="aligncenter" width="700"]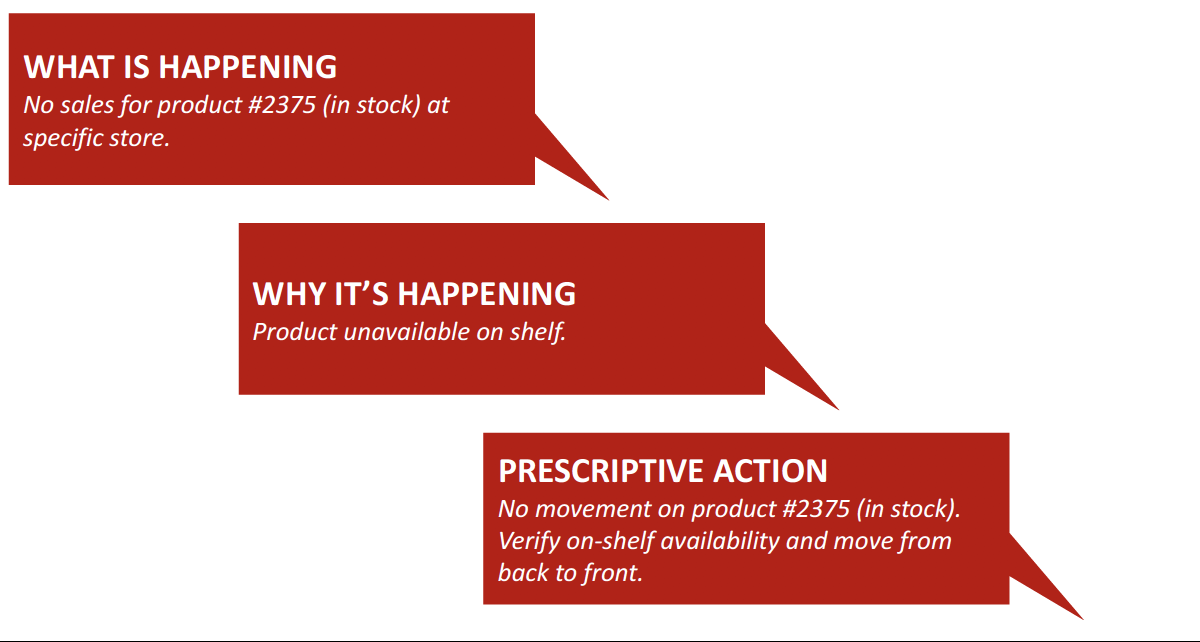 Source: Zebra Technologies[/caption]
Prescriptive analytics platforms also determine the financial impact of the issues to be resolved and prioritize them to achieve the best results.
Benefits of Prescriptive Analytics in Retail
By leveraging prescriptive analytics to inform decision-making, retailers can realize the following benefits:
- Accountability—Whereas reports provide no guarantee that the task was actually completed, prescriptive analytics platforms require the associate to confirm that the task was carried out, which increases accountability. In addition, a workflow function checks the data to verify that the issue was resolved. This prevents “pencil whipping.”
- Smart Tasking—Smart tasks are the product of data analysis; they are assigned to store employees because of specific data behaviors and their priority. For example, prescriptive analytics might detect a drop-off in shampoo sales because there is no more product on the shelf despite there being inventory in the back room; an employee would be directed to restock the shampoo section. Because it is based on data analysis, restocking the shampoo is considered a smart task.
- Plain-Text Directives—Static reports that lack prescribed actions are open to many possible interpretations. For example, trucks arriving at stores with inventory not matching what was packed at the warehouse is hardly a conclusive fact. The warehouse staff or the delivery staff could easily point the finger of blame at the other. In contrast, prescriptive analytics issues unambiguous actions and messages in plain text, such as: “To Asset Protection Manager: Trucks #3, 8 and 11 made unauthorized stops en route to destination and arrived with items missing. Interview drivers.” These types of directives create a single version of the truth and offer corrective actions, thus minimizing uncertainty or debates around the facts of a situation.
- Near Real-Time Alerts—Predictive analytics reports are issued on a routine basis, whether daily, weekly, monthly, or quarterly. They can miss a situation in which small daily financial losses are not detected until the regular report is generated, by which time the losses can have become significant. Prescriptive analytics, on the other hand, continuously searches for opportunities and issues actions in near-real time for fast results. For example, an employee stealing a pack of cigarettes a day could add up to losses in the hundreds of dollars by the time the retailer runs a monthly shrink report. Prescriptive analytics could have quickly identified discrepancies in inventory and provided actions to determine the cause of the problem and prevent it from escalating.
- Internet of Things (IoT) Alerts—Prescriptive analytics links with IoT through aisle-patrolling robots and shelf cameras to gather and leverage significantly more data. Combining these multiple types of data increases “true positive” rates (i.e. actual, genuine cases instead of false alarms) on smart tasking.
These benefits aim to:
- Cut through the noise and bias;
- Find the right interpretation of the data;
- Determine the appropriate corrective action;
- Send the corrective action to the right person; and
- Send the action at the right time.
The above benefits are also able to create opportunities to improve a wide variety of metrics, as illustrated in the figure below.
[caption id="attachment_112489" align="aligncenter" width="700"]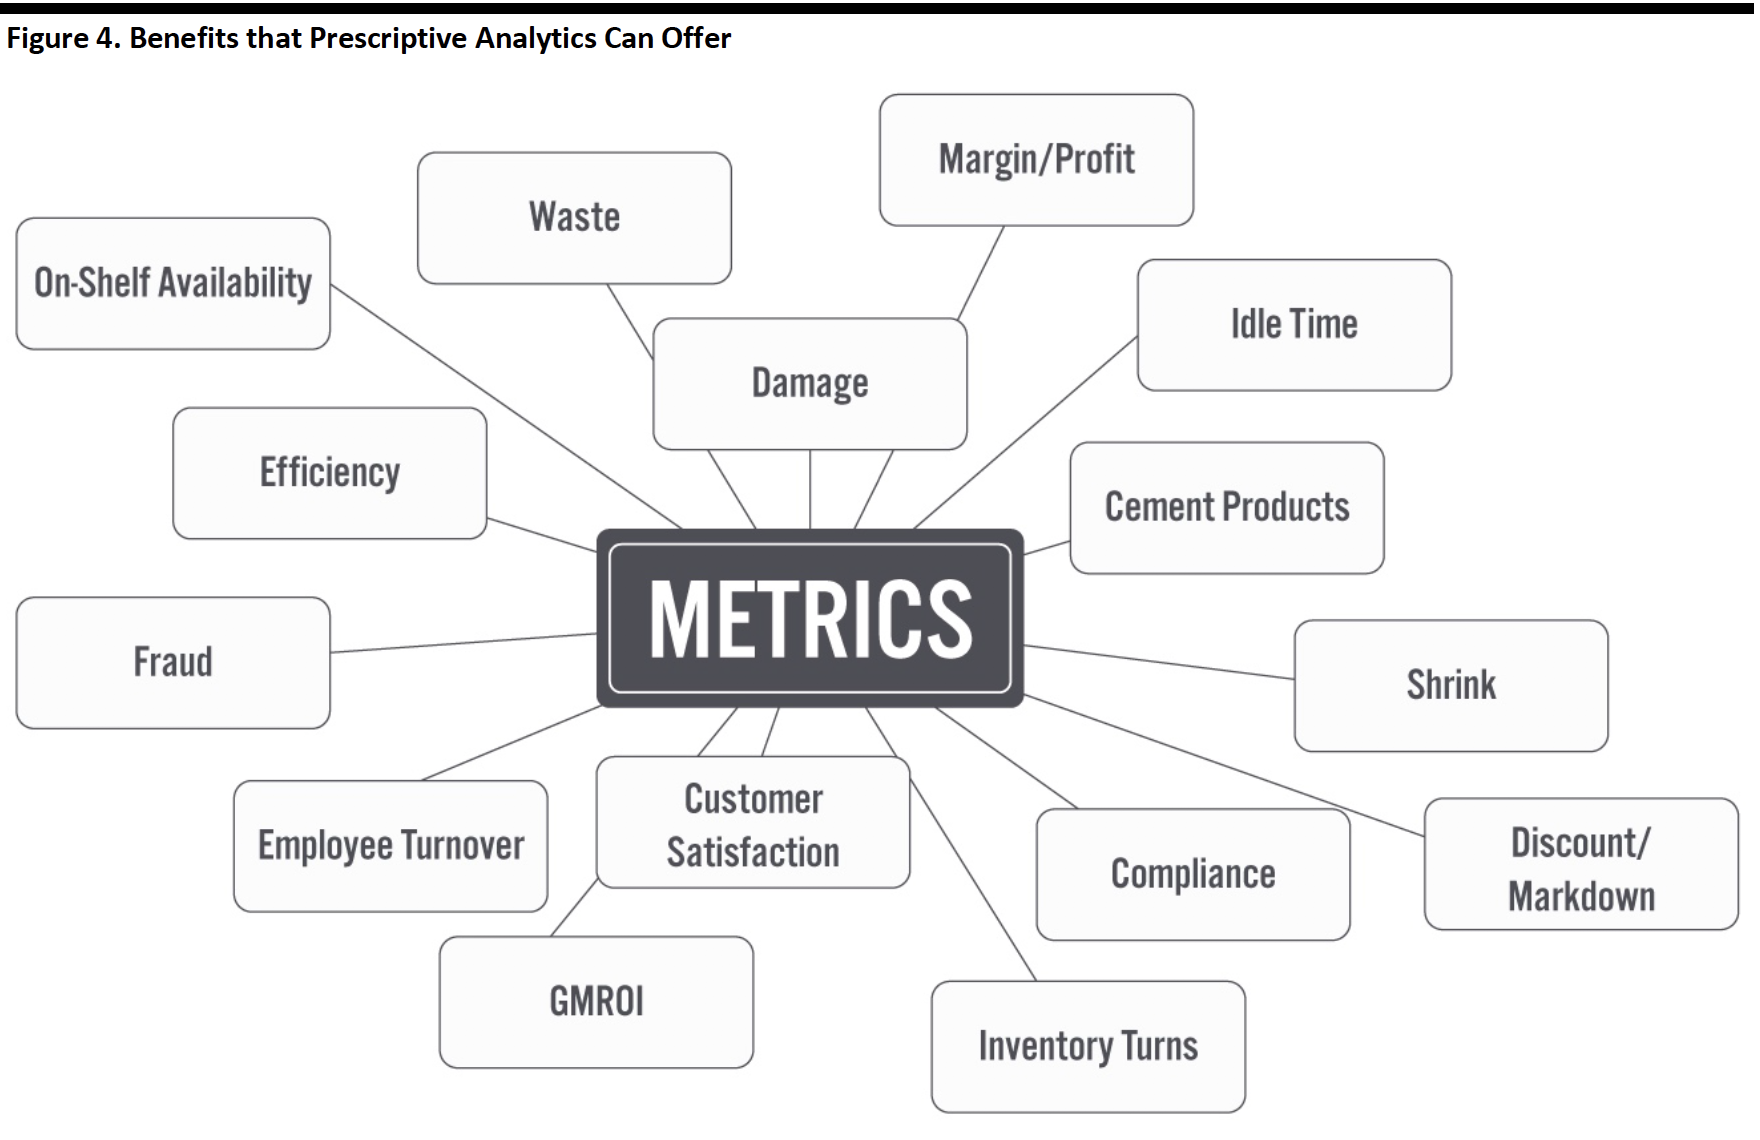 Source: Zebra Technologies[/caption]
In addition, there are many business functions within a retailer that can benefit from prescriptive analytics, as shown in the image below.
[caption id="attachment_112490" align="aligncenter" width="700"]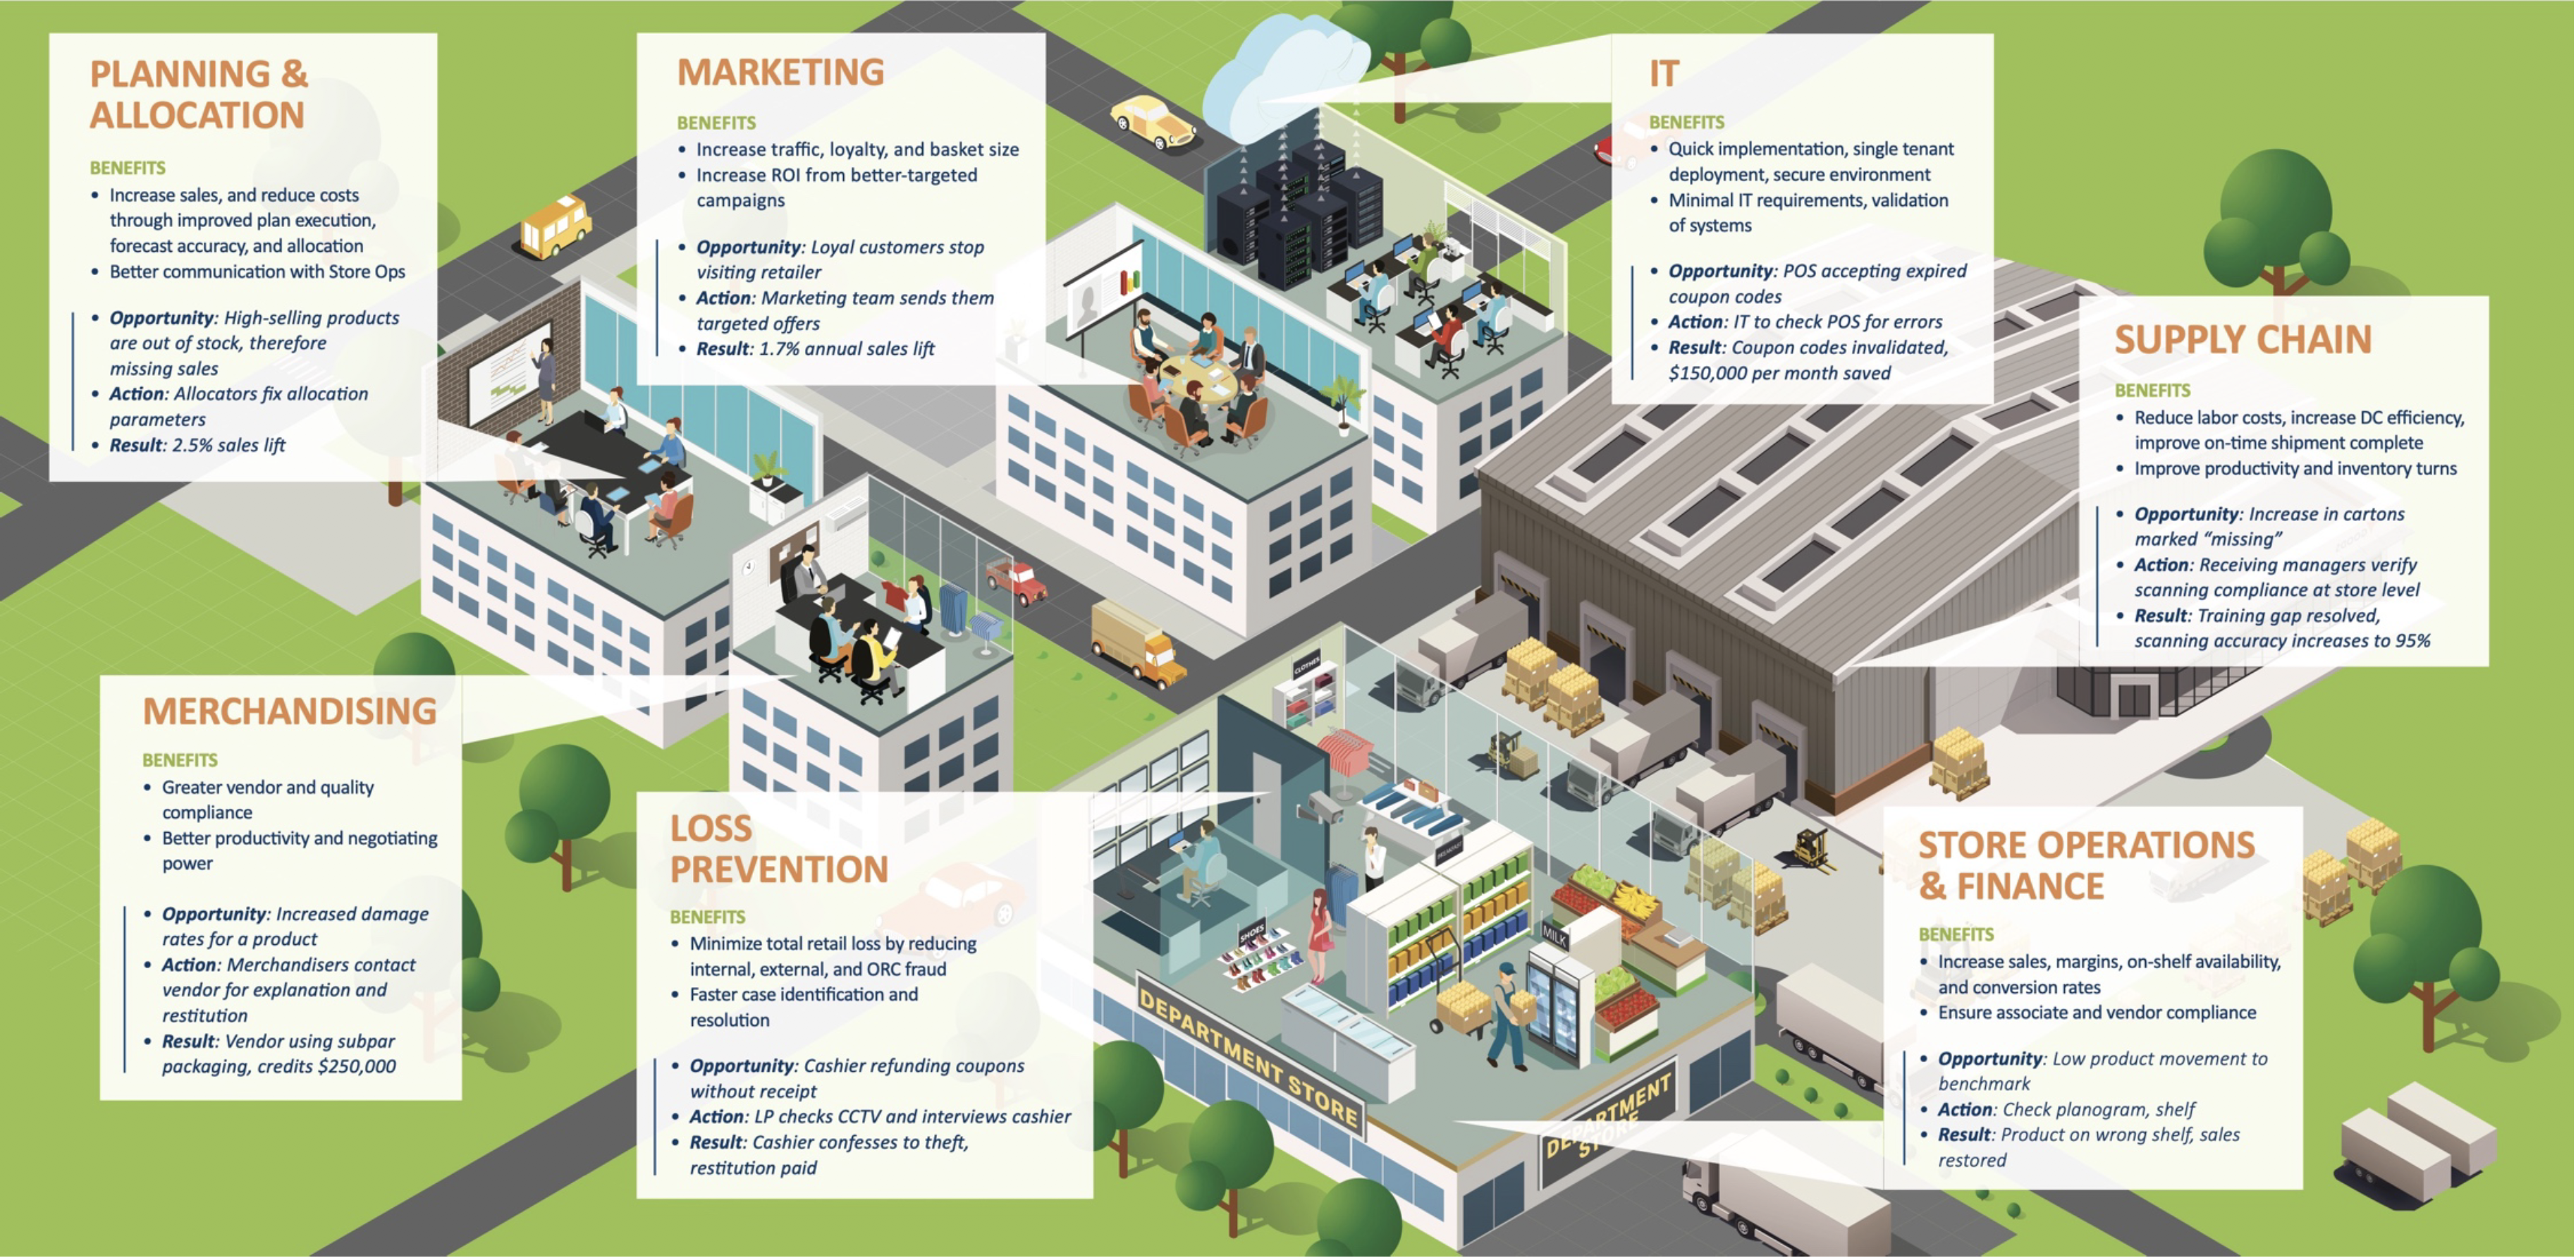 Source: Zebra Technologies[/caption]
How Does Prescriptive Analytics Determine What Is Happening?
Prescriptive analytics leverages five core capabilities that incorporate machine learning to determine corrective actions (see Figure 5).
[caption id="attachment_112491" align="aligncenter" width="550"]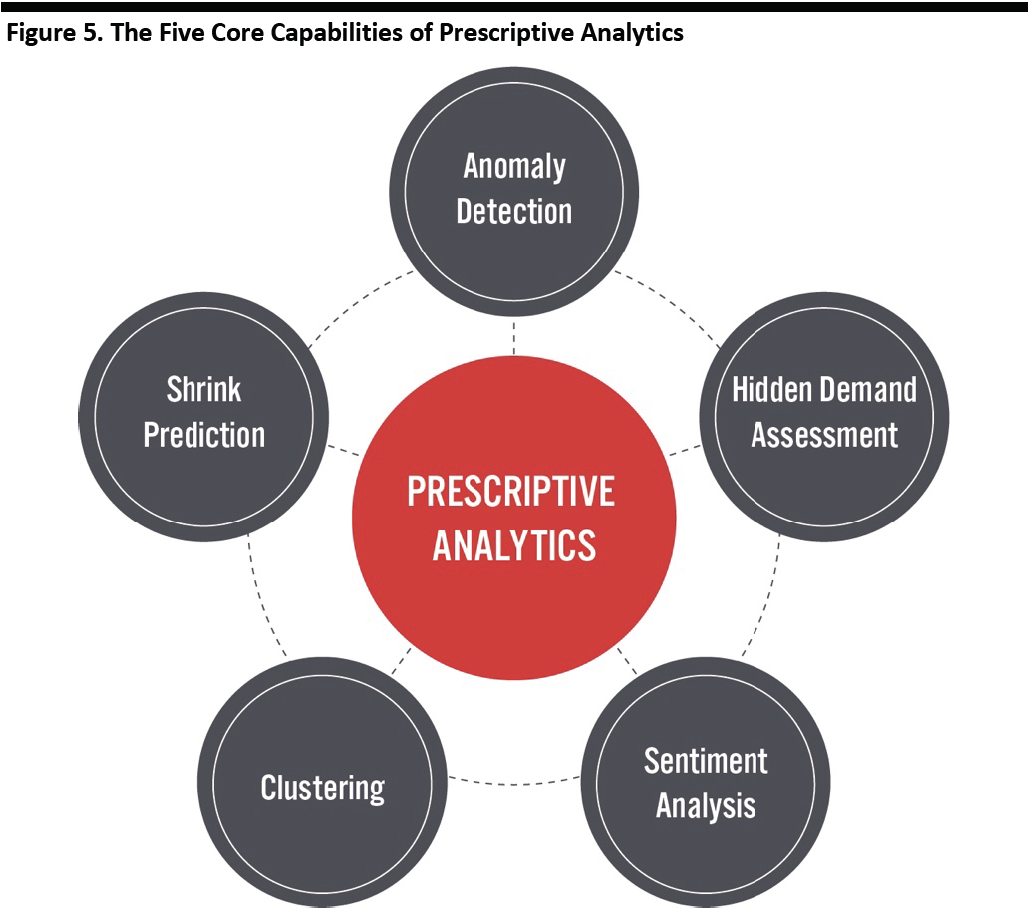 Source: Coresight Research[/caption]
Below, we discuss these core capabilities.
1) Anomaly Detection
Prescriptive analytics platforms scan performance across a wide variety of retail metrics, such as the cashier scanning rate, to determine an average or baseline. They then detect when actual performance deviates from those baselines, which creates an opportunity to make a correction. Examples of issues that anomaly detection can identify include the following:
- Labor inefficiencies—when associates are not performing the tasks assigned to them at all or within a reasonable timeframe
- Fraud—committed by employees or customers
- Inventory inaccuracies—when the amount of inventory and/or its location are incorrect
- Logistics opportunities and bottlenecks—including unusual delays within the supply chain
- Noncompliance—when rules, standard operating procedures and policies are not followed
- Promotion execution issues—when tasks are not executed according to agreed promotion plans
2) Hidden Demand Assessment
Hidden demand represents revenues that the retailer could have collected but did not, primarily due to a product not being on the shelf or not “shiny” and “inviting” (i.e. not in a sellable condition). For example, if it takes an employee two hours to restock a given product, the platform can calculate the resulting lost sales. In another example, if an employee closes a store early, missing out on several hundred dollars’ worth of revenue, this would be detected by the platform.
3) Sentiment Analysis
Data from product or store reviews on websites can be mined to distill key themes of interest to consumers and manufacturers, such as customer satisfaction, pricing and product quality. This capability can also detect the sentiment or intent of a review—whether it is positive or negative—when reviews lack numerical ratings. This textual information is translated into a score that retailers can use to determine where improvement is needed, such as in pricing, quality or in the performance of specific stores.
4) Clustering
Prescriptive analytics also uses clustering techniques to understand customer behavior and identify abnormalities by:
- Aggregating customers/employees/stores/districts with similar behavior profiles, consumption patterns, returns, traffic, demand assortment and demographics;
- Grouping these profiles together to determine benchmark averages for specific behaviors, such as sales, average transaction rates or number of damaged products; and
- Identifying behavior that is inconsistent with the benchmarks to generate a message that describes the opportunity (i.e., what has happened) and the prescriptive action (i.e., what needs to be done about it).
5) Shrink Prediction
Shrink represents the loss of inventory due to a variety of factors, including theft, damage, expiration and cashier error. Prescriptive analytics can analyze historical data to predict where the greatest amounts of shrink are likely to occur. One or two products can represent as much as 30% of a retailer’s total annual shrink, and corrective actions can be focused on these products. If done proactively, you can reduce the risk of shrink significantly.
Sector Overview
Prescriptive analytics represents the third phase and culmination of the business-analytics category, which also includes descriptive (i.e., what happened?) and predictive analytics (i.e., what will happen?) and works in concert with those two techniques.
Given the benefits of predictive analytics, the sector is expected to see strong growth. The global market for predictive and prescriptive analytics is estimated to grow at a 22.5% CAGR during 2019–2025E, according to market research firm Mordor Intelligence. This puts the market at just shy of $10 billion in 2020; we estimate that the prescriptive analytics segment of the market represents about 13% of this figure, or about $1.3 billion.
[caption id="attachment_112492" align="aligncenter" width="550"]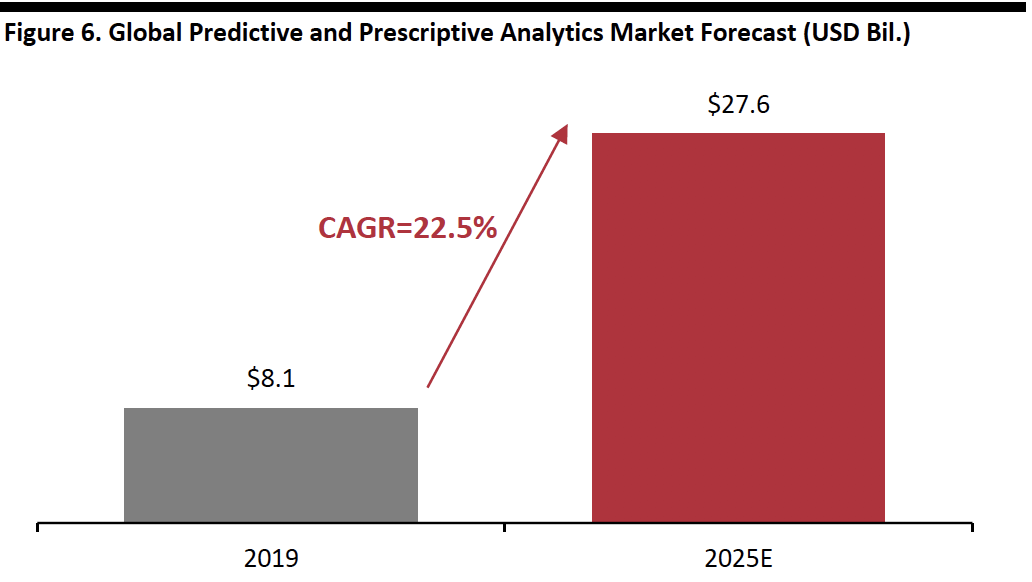 Source: Mordor Intelligence[/caption]
Market drivers include the following:
- Demand from enterprises seeking to improve revenues and productivity with automated solutions
- The increasing power of statistical and technical methods to support data-driven business decisions
- Retailers in particular seeking to identify and retain customers through personalized service offerings, perform real-time inventory planning and risk mitigation and achieve results in real time
Conclusion
Retailers can implement prescriptive analytics to increase revenues and customer satisfaction and improve efficiency, which improves margins and working capital. Specifically, prescriptive analytics cuts through the ambiguity of data to issue clear actions to be completed in real time, which helps retailers to improve their management of labor and inventory, even helping them to reduce fraud. Additional benefits include improving inventory accuracy and labor productivity, which can be achieved within a short timeframe such as six months.