Nitheesh NH
A $45 BILLION SECTOR
As we have noted many times before, US retailers at the high end and in the budget segment have outperformed in recent years, while those in the middle have been squeezed. It is what we have characterized as the Weinswig Hourglass model of retail.
One notable aspect of this trend has been growth in the dollar-store segment. In this report, we analyze the sector’s growth, with a focus on the share these retailers have carved out in grocery and the headwinds they now face in this category.
Our analysis focuses on the five biggest dollar-store chains in the US: Dollar General, Dollar Tree, Family Dollar (which was acquired by Dollar Tree in 2015), Fred’s and 99 Cents Only. Of these, only Dollar Tree sells items at a fixed, $1 price; 99 Cents Only sells mainly at 99.99 cents, but includes some higher-priced items, while the others sell at variable prices. We do not include other chains such as Five Below in our analysis here, as they are either minor players in the segment or less clearly defined as dollar stores.
[caption id="attachment_92132" align="aligncenter" width="717"] Source: shutterstock[/caption]
DOLLAR-STORE SECTOR GROWS 31% IN FOUR YEARS
Here are our top-line takeaways on the sector:
Source: shutterstock[/caption]
DOLLAR-STORE SECTOR GROWS 31% IN FOUR YEARS
Here are our top-line takeaways on the sector:
 FY17 estimates are based on consensus estimates for Dollar General, Dollar Tree, Family Dollar and Fred’s, and on trailing-12-months data for 99 Cents Only
(no consensus available).
Source: S&P Capital IQ/Fung Global Retail & Technology[/caption] Dollar General and Dollar Tree dominate the sector. Dollar Tree completed its acquisition of Family Dollar in early July 2015; even with the acquisition, Dollar Tree still lags Dollar General fractionally. Fred’s is a borderline dollar store, given that it has a substantial pharmacy operation. In fiscal 2016, pharmacy contributed half of total revenues for Fred’s. [caption id="attachment_92136" align="aligncenter" width="720"]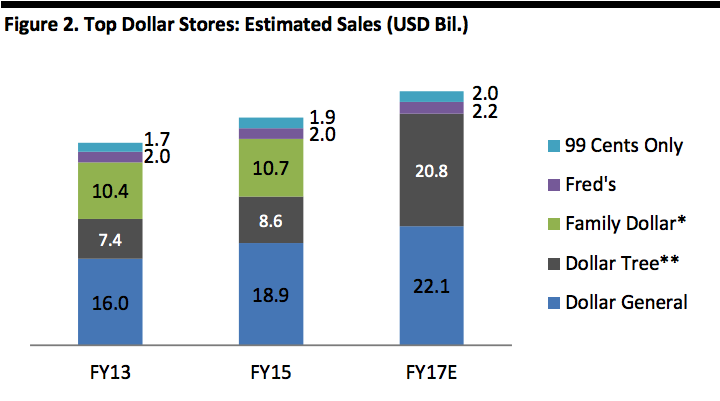 FY17 estimates are based on consensus estimates for Dollar General, Dollar Tree, Family Dollar (including within Dollar Tree after acquisition) and Fred’s, and on trailing-12-months data for 99 Cents Only (no consensus available). Dollar Tree includes a small element of revenue from Canada, where the company operated 225 stores as of January 2016.
*Estimated for FY15.
**Includes Family Dollar in FY17E.
Source: S&P Capital IQ/Fung Global Retail & Technology[/caption] Store portfolio expansion has underpinned growth in the sector: over five years, the major chains grew their combined total store base by 20.9%, to 27,476. This compares to the abovementioned 31% increase in sales at these five retailers over the same period. In July 2016, Dollar General acquired 41 former Walmart Express stores. [caption id="attachment_92138" align="aligncenter" width="720"]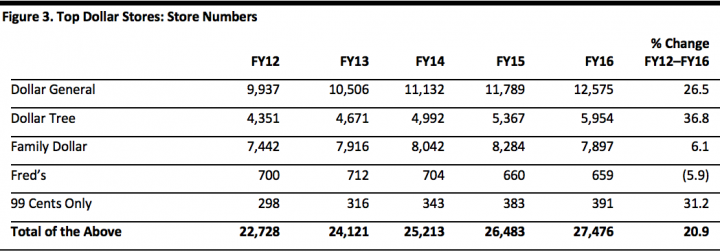 Fiscal years ended January
Source: Company reports[/caption] AMERICANS BUY $29 BILLION OF GROCERIES FROM DOLLAR STORES In calendar year 2015, Americans spent $1.2 trillion on core grocery categories across all retail channels. This included in-home food and beverages, household cleaning products, household paper products, personal care products, and tobacco. We estimate that US shoppers spent some $29.4 billion, or 2.4% of the total, on grocery categories at the major dollar-store chains in fiscal 2016. That total will rise by 5.9%, to $31.1 billion, in the current fiscal year, we estimate. The dollar stores’ share of total grocery spend has been creeping up, but the sector remains a niche channel, and will account for only an estimated 2.5% of total core grocery spend this year. [caption id="attachment_92139" align="aligncenter" width="724"] Source: shutterstock[/caption]
[caption id="attachment_92140" align="aligncenter" width="720"]
Source: shutterstock[/caption]
[caption id="attachment_92140" align="aligncenter" width="720"]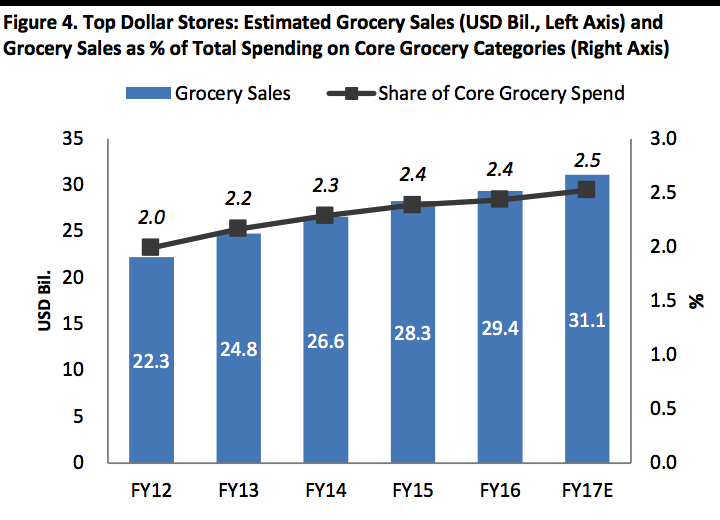 Core grocery categories are defined as in-home food and beverages, household cleaning products, household paper products, personal care products, and tobacco.
Source: Company reports/US Bureau of Economic Analysis/Fung Global Retail & Technology[/caption] To put these figures in context, the graph below shows Euromonitor International’s estimates for grocery sales made through various types of grocery stores in 2015 (the company does not consider dollar stores to be grocery stores). Our analysis suggests that dollar stores are a bigger grocery channel than convenience stores, and that they are roughly twice as big as discounters such as Aldi. [caption id="attachment_92141" align="aligncenter" width="720"]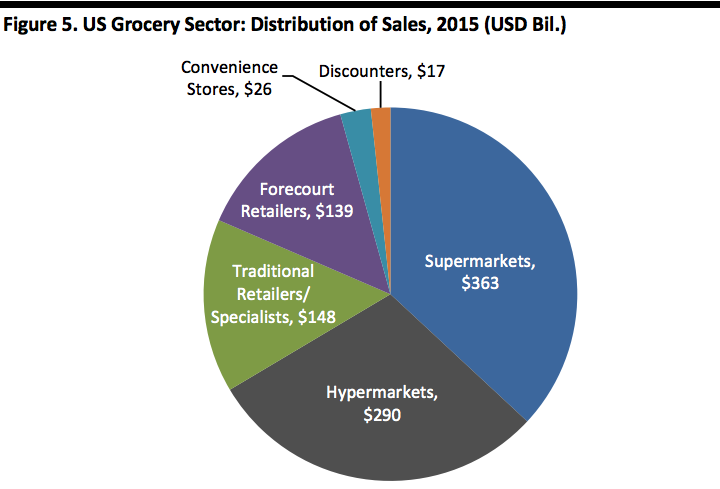 Data are for retailers selling “predominantly groceries” and exclude dollar stores.
Source: Euromonitor International/Fung Global Retail & Technology[/caption] We estimate that, in fiscal 2016, some 66% of all sales at the major dollar stores were in grocery categories—or “consumables,” as most of the retailers categorize them. This includes food, beverages, household cleaning products, beauty and personal care products, and (where relevant) tobacco. Dollar General sees the highest contribution from these categories, while the proportion at Fred’s is pushed down by its sizable pharmacy operation. [caption id="attachment_92142" align="aligncenter" width="722"]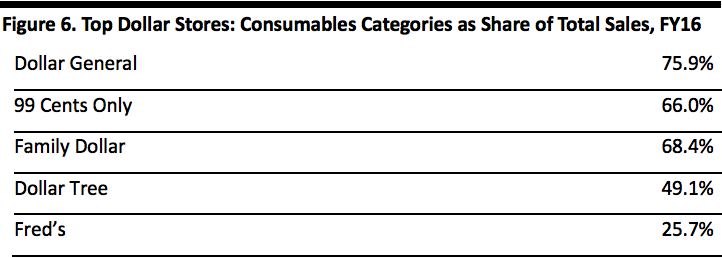 Source: Company reports[/caption]
DOLLAR STORES FACE CHALLENGES IN GROCERY
Despite their success in carving out share in the grocery category, dollar stores face three near-term challenges:
1.Food-Price Deflation
US food prices have fallen, impacting revenues in all grocery channels. In July 2016 (latest reported), total food at home prices were down 1.6% year over year according to the US Bureau of Labor Statistics. Declining US exports have pushed down domestic prices of fresh-food categories such as beef and poultry, while a surplus has depressed dairy prices. Egg prices have slumped following an August 2015 price peak due to a shortage.
[caption id="attachment_92143" align="aligncenter" width="720"]
Source: Company reports[/caption]
DOLLAR STORES FACE CHALLENGES IN GROCERY
Despite their success in carving out share in the grocery category, dollar stores face three near-term challenges:
1.Food-Price Deflation
US food prices have fallen, impacting revenues in all grocery channels. In July 2016 (latest reported), total food at home prices were down 1.6% year over year according to the US Bureau of Labor Statistics. Declining US exports have pushed down domestic prices of fresh-food categories such as beef and poultry, while a surplus has depressed dairy prices. Egg prices have slumped following an August 2015 price peak due to a shortage.
[caption id="attachment_92143" align="aligncenter" width="720"] Source: shutterstock[/caption]
The data below are for a six-month period to July.
[caption id="attachment_92144" align="aligncenter" width="720"]
Source: shutterstock[/caption]
The data below are for a six-month period to July.
[caption id="attachment_92144" align="aligncenter" width="720"]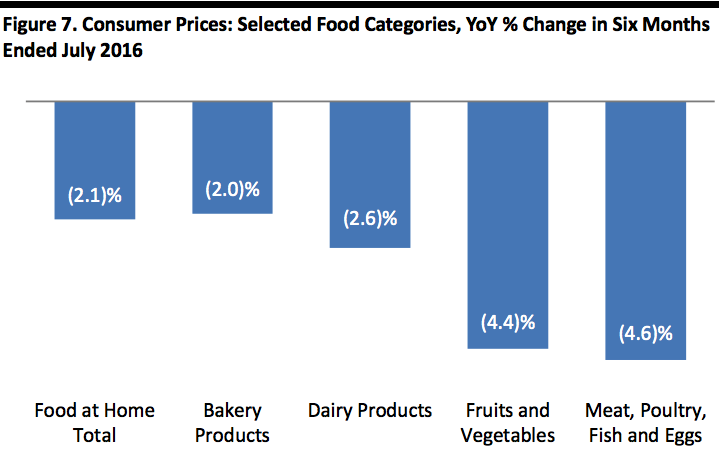 Source: US Bureau of Labor Statistics[/caption]
2.Strong Competition
Walmart is providing stronger competition on price. In Walmart’s first-quarter conference call, management noted that improved cost control had given it “increased confidence” to launch a new phase of price investment across its US stores ahead of plan. “Over time, we intend to lower prices further in a deliberate, strategic way,” the company said in May.
In Walmart’s second-quarter conference call, in August, management noted that it “continued to implement a multiyear strategy of incremental price investment in the US business” and that it is “pleased with the initial results” of this investment.
In Dollar General’s recent second-quarter results call, the company’s CEO remarked that there had “been some competition heating some things up” but that his company has “some of the lowest [prices] in the marketplace…
nearly being at parity with mass [merchants], 20% on average lower than grocery [stores] and 40%-plus lower every day than drug [stores] on the shelf.”
The strengthening of the dollar and the decline in some commodity prices are likely to prove tailwinds to Walmart’s price investment plan. That, in turn, will mean tougher competition for the company’s price-focused rivals.
3.SNAP Cut Back
In 2016, between 500,000 and 1 million of America’s poorest citizens will face disqualification from the Supplemental Nutrition Assistance Program (SNAP), which was formerly known as the Food Stamp Program. A raft of states are reintroducing a three-month limit on SNAP benefits for unemployed adults who are not disabled or raising children; this follows the suspension of the three-month limit in many areas in the wake of the Great Recession.
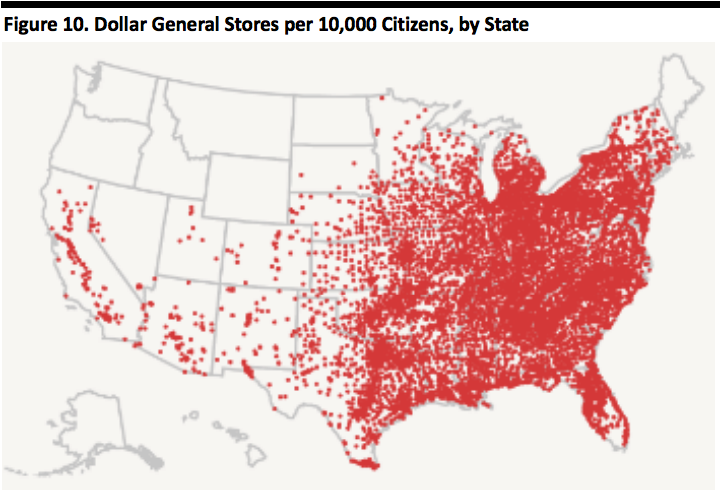
The maps below show dollar-store density by state and those states that are reintroducing SNAP time limits this year. The data suggest a substantial overlap in the southeastern states.
[caption id="attachment_92145" align="aligncenter" width="719"]
Source: US Bureau of Labor Statistics[/caption]
2.Strong Competition
Walmart is providing stronger competition on price. In Walmart’s first-quarter conference call, management noted that improved cost control had given it “increased confidence” to launch a new phase of price investment across its US stores ahead of plan. “Over time, we intend to lower prices further in a deliberate, strategic way,” the company said in May.
In Walmart’s second-quarter conference call, in August, management noted that it “continued to implement a multiyear strategy of incremental price investment in the US business” and that it is “pleased with the initial results” of this investment.
In Dollar General’s recent second-quarter results call, the company’s CEO remarked that there had “been some competition heating some things up” but that his company has “some of the lowest [prices] in the marketplace…
nearly being at parity with mass [merchants], 20% on average lower than grocery [stores] and 40%-plus lower every day than drug [stores] on the shelf.”
The strengthening of the dollar and the decline in some commodity prices are likely to prove tailwinds to Walmart’s price investment plan. That, in turn, will mean tougher competition for the company’s price-focused rivals.
3.SNAP Cut Back
In 2016, between 500,000 and 1 million of America’s poorest citizens will face disqualification from the Supplemental Nutrition Assistance Program (SNAP), which was formerly known as the Food Stamp Program. A raft of states are reintroducing a three-month limit on SNAP benefits for unemployed adults who are not disabled or raising children; this follows the suspension of the three-month limit in many areas in the wake of the Great Recession.
The maps below show dollar-store density by state and those states that are reintroducing SNAP time limits this year. The data suggest a substantial overlap in the southeastern states.
[caption id="attachment_92145" align="aligncenter" width="719"]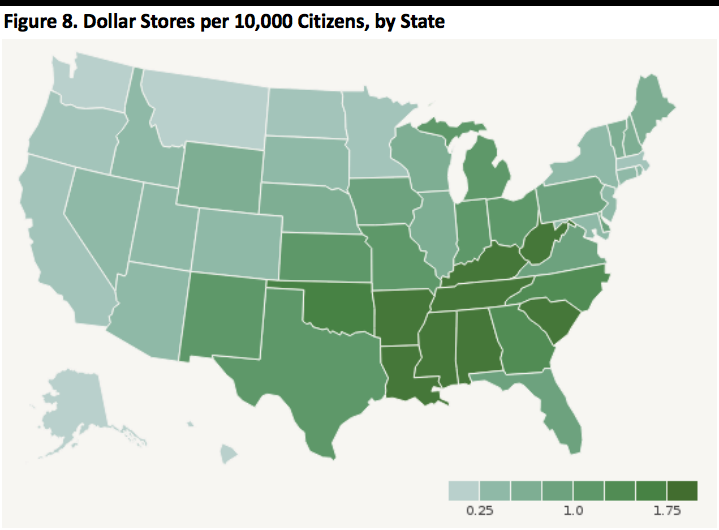 Source: Retale[/caption]
[caption id="attachment_92146" align="aligncenter" width="720"]
Source: Retale[/caption]
[caption id="attachment_92146" align="aligncenter" width="720"]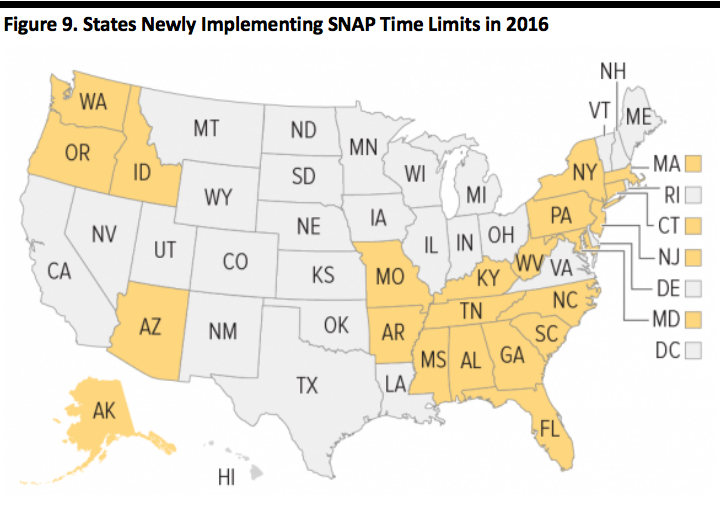 Source: Center on Budget and Policy Priorities[/caption]
Dollar General appears to be taking the most significant hit from changes to the SNAP program. In its recent second-quarter results, Dollar General noted the detrimental impact of a reduction in SNAP participation rates and in the program’s benefit levels. On the company’s second-quarter conference call, CEO Todd Vasos remarked:
Source: Center on Budget and Policy Priorities[/caption]
Dollar General appears to be taking the most significant hit from changes to the SNAP program. In its recent second-quarter results, Dollar General noted the detrimental impact of a reduction in SNAP participation rates and in the program’s benefit levels. On the company’s second-quarter conference call, CEO Todd Vasos remarked:
 Source: Retale[/caption]
[caption id="attachment_92148" align="aligncenter" width="720"]
Source: Retale[/caption]
[caption id="attachment_92148" align="aligncenter" width="720"]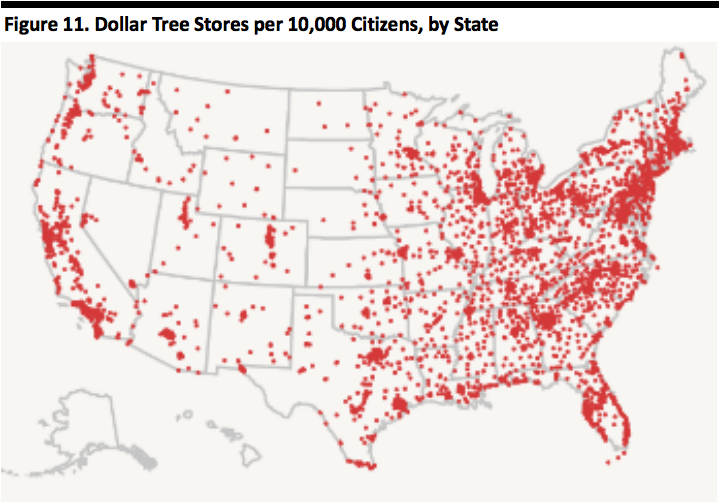 Source: Retale[/caption]
LATEST RESULTS REFLECT TOUGHER TRADING
As we noted above, sector growth has slowed considerably in the current fiscal year, and recent performance has been mixed. The table below shows the top five dollar-store chains’ latest reported revenue growth rates.
[caption id="attachment_92149" align="aligncenter" width="719"]
Source: Retale[/caption]
LATEST RESULTS REFLECT TOUGHER TRADING
As we noted above, sector growth has slowed considerably in the current fiscal year, and recent performance has been mixed. The table below shows the top five dollar-store chains’ latest reported revenue growth rates.
[caption id="attachment_92149" align="aligncenter" width="719"]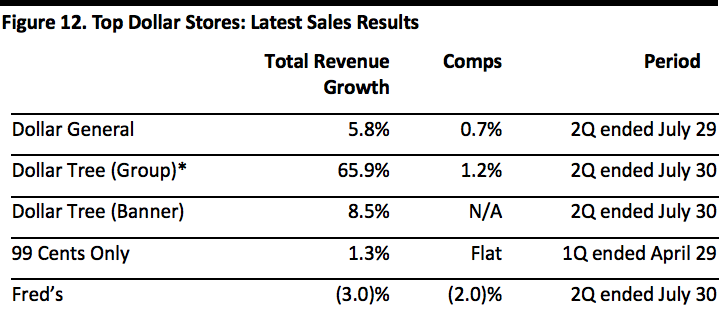 *Including Family Dollar, which was acquired during 2Q15. Comps are at constant currency.
Source: Company reports[/caption] Below, we summarize the recent performance of the leading two dollar-store groups. Dollar General Dollar General reported second-quarter 2016 net sales of $5.4 billion, up 5.8% year over year but below the consensus estimate of $5.50 billion. Comps climbed by 0.7% on higher transaction values, which were partially offset by a decline in traffic. The consumables category (i.e., grocery) remained positive. Management commented that same-store sales missed expectations due to retail food deflation and a reduction in SNAP participation rates and benefit levels, and that unseasonably mild spring weather and an intensified competitive environment in certain regions of the country also had an effect. Management noted, too, that retail prices were down about 8% for milk and more than 50% for eggs, the company’s two biggest sellers within perishables. The company estimates that this price deflation, together with SNAP changes, negatively affected same-store sales for the quarter by approximately 60–70 basis points. To counteract these headwinds, the company plans to take aggressive action across merchandising and store operations to help drive same-store sales, and says that it will continue to exercise discipline in operational expenses. Dollar Tree and Family Dollar In the second quarter, Dollar Tree’s group revenues were $5.0 billion, below the $5.08 billion consensus estimate and compared to $3.0 billion in the year-ago quarter, which included only four weeks of Family Dollar operations. Same-store sales were up 1.2% in constant currency, driven by higher customer count and average ticket. In the Dollar Tree segment, the top-performing categories included party supplies, snacks and beverages, and toys and household products. Sales in discretionary categories outpaced those of consumables. In response to Dollar General’s comments about SNAP, management at Family Dollar noted that its food-stamp penetration rate is relatively low, at under 5%, and that the rate is higher at Family Dollar than at Dollar Tree. KEY TAKEAWAYS
Source: shutterstock[/caption]
DOLLAR-STORE SECTOR GROWS 31% IN FOUR YEARS
Here are our top-line takeaways on the sector:
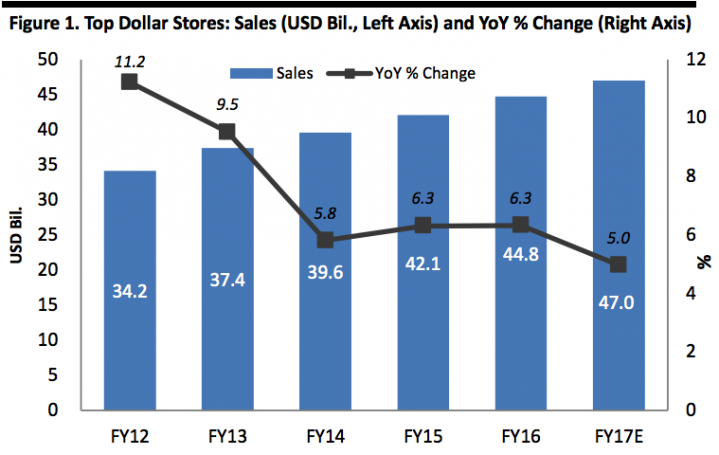
- This fiscal year, we expect the top five US dollar-store chains to turn over some $47 billion. Our estimates are based principally on consensus estimates from S&P Capital IQ. Throughout this report, fiscal years refer to years ending January.
- Our analysis shows that the top five dollar-store chains grew sales by 31% between fiscal years 2012 and 2016, from $34 billion to $45 billion.
- Annual sector growth has been slowing, however, from 11.2% in fiscal 2012 to an estimated 5.0% in fiscal 2017.
FY17 estimates are based on consensus estimates for Dollar General, Dollar Tree, Family Dollar and Fred’s, and on trailing-12-months data for 99 Cents Only(no consensus available).
Source: S&P Capital IQ/Fung Global Retail & Technology[/caption] Dollar General and Dollar Tree dominate the sector. Dollar Tree completed its acquisition of Family Dollar in early July 2015; even with the acquisition, Dollar Tree still lags Dollar General fractionally. Fred’s is a borderline dollar store, given that it has a substantial pharmacy operation. In fiscal 2016, pharmacy contributed half of total revenues for Fred’s. [caption id="attachment_92136" align="aligncenter" width="720"]
FY17 estimates are based on consensus estimates for Dollar General, Dollar Tree, Family Dollar (including within Dollar Tree after acquisition) and Fred’s, and on trailing-12-months data for 99 Cents Only (no consensus available). Dollar Tree includes a small element of revenue from Canada, where the company operated 225 stores as of January 2016.*Estimated for FY15.
**Includes Family Dollar in FY17E.
Source: S&P Capital IQ/Fung Global Retail & Technology[/caption] Store portfolio expansion has underpinned growth in the sector: over five years, the major chains grew their combined total store base by 20.9%, to 27,476. This compares to the abovementioned 31% increase in sales at these five retailers over the same period. In July 2016, Dollar General acquired 41 former Walmart Express stores. [caption id="attachment_92138" align="aligncenter" width="720"]
Fiscal years ended JanuarySource: Company reports[/caption] AMERICANS BUY $29 BILLION OF GROCERIES FROM DOLLAR STORES In calendar year 2015, Americans spent $1.2 trillion on core grocery categories across all retail channels. This included in-home food and beverages, household cleaning products, household paper products, personal care products, and tobacco. We estimate that US shoppers spent some $29.4 billion, or 2.4% of the total, on grocery categories at the major dollar-store chains in fiscal 2016. That total will rise by 5.9%, to $31.1 billion, in the current fiscal year, we estimate. The dollar stores’ share of total grocery spend has been creeping up, but the sector remains a niche channel, and will account for only an estimated 2.5% of total core grocery spend this year. [caption id="attachment_92139" align="aligncenter" width="724"]
Source: shutterstock[/caption]
[caption id="attachment_92140" align="aligncenter" width="720"] Core grocery categories are defined as in-home food and beverages, household cleaning products, household paper products, personal care products, and tobacco.Source: Company reports/US Bureau of Economic Analysis/Fung Global Retail & Technology[/caption] To put these figures in context, the graph below shows Euromonitor International’s estimates for grocery sales made through various types of grocery stores in 2015 (the company does not consider dollar stores to be grocery stores). Our analysis suggests that dollar stores are a bigger grocery channel than convenience stores, and that they are roughly twice as big as discounters such as Aldi. [caption id="attachment_92141" align="aligncenter" width="720"]
Data are for retailers selling “predominantly groceries” and exclude dollar stores.Source: Euromonitor International/Fung Global Retail & Technology[/caption] We estimate that, in fiscal 2016, some 66% of all sales at the major dollar stores were in grocery categories—or “consumables,” as most of the retailers categorize them. This includes food, beverages, household cleaning products, beauty and personal care products, and (where relevant) tobacco. Dollar General sees the highest contribution from these categories, while the proportion at Fred’s is pushed down by its sizable pharmacy operation. [caption id="attachment_92142" align="aligncenter" width="722"]
Source: Company reports[/caption]
DOLLAR STORES FACE CHALLENGES IN GROCERY
Despite their success in carving out share in the grocery category, dollar stores face three near-term challenges:
1.Food-Price Deflation
US food prices have fallen, impacting revenues in all grocery channels. In July 2016 (latest reported), total food at home prices were down 1.6% year over year according to the US Bureau of Labor Statistics. Declining US exports have pushed down domestic prices of fresh-food categories such as beef and poultry, while a surplus has depressed dairy prices. Egg prices have slumped following an August 2015 price peak due to a shortage.
[caption id="attachment_92143" align="aligncenter" width="720"] Source: shutterstock[/caption]
The data below are for a six-month period to July.
[caption id="attachment_92144" align="aligncenter" width="720"] Source: US Bureau of Labor Statistics[/caption]
2.Strong Competition
Walmart is providing stronger competition on price. In Walmart’s first-quarter conference call, management noted that improved cost control had given it “increased confidence” to launch a new phase of price investment across its US stores ahead of plan. “Over time, we intend to lower prices further in a deliberate, strategic way,” the company said in May.
In Walmart’s second-quarter conference call, in August, management noted that it “continued to implement a multiyear strategy of incremental price investment in the US business” and that it is “pleased with the initial results” of this investment.
In Dollar General’s recent second-quarter results call, the company’s CEO remarked that there had “been some competition heating some things up” but that his company has “some of the lowest [prices] in the marketplace…
nearly being at parity with mass [merchants], 20% on average lower than grocery [stores] and 40%-plus lower every day than drug [stores] on the shelf.”
The strengthening of the dollar and the decline in some commodity prices are likely to prove tailwinds to Walmart’s price investment plan. That, in turn, will mean tougher competition for the company’s price-focused rivals.
3.SNAP Cut Back
In 2016, between 500,000 and 1 million of America’s poorest citizens will face disqualification from the Supplemental Nutrition Assistance Program (SNAP), which was formerly known as the Food Stamp Program. A raft of states are reintroducing a three-month limit on SNAP benefits for unemployed adults who are not disabled or raising children; this follows the suspension of the three-month limit in many areas in the wake of the Great Recession.
The maps below show dollar-store density by state and those states that are reintroducing SNAP time limits this year. The data suggest a substantial overlap in the southeastern states.
[caption id="attachment_92145" align="aligncenter" width="719"] Source: Retale[/caption]
[caption id="attachment_92146" align="aligncenter" width="720"] Source: Center on Budget and Policy Priorities[/caption]
Dollar General appears to be taking the most significant hit from changes to the SNAP program. In its recent second-quarter results, Dollar General noted the detrimental impact of a reduction in SNAP participation rates and in the program’s benefit levels. On the company’s second-quarter conference call, CEO Todd Vasos remarked:
“The headwind of SNAP for us really was a big deal. And…our core consumer continues to be under a lot of pressure because rents are accelerating. Healthcare is accelerating on her at a very, very rapid clip. And now you couple that in upwards of 20 states where they have reduced or eliminated the SNAP benefit, and it has really put a toll on her. That SNAP benefit reduction and/or elimination happened in April.…That was the kickoff, and you could see it immediately in the numbers.”
In response to Dollar General’s comments about SNAP, management at Family Dollar noted that its own food-stamp penetration is relatively small, at under 5%, and that the rate is higher at Family Dollar than at Dollar Tree. These remarks suggest that SNAP is of greater significance to retailers that are not tied to a fixed, $1 price point, as Dollar Tree is. Dollar Tree’s greater insulation is also likely partially due to its more dispersed store network relative to the other major chains, as highlighted by the maps below. [caption id="attachment_92147" align="aligncenter" width="720"] Source: Retale[/caption]
[caption id="attachment_92148" align="aligncenter" width="720"] Source: Retale[/caption]
LATEST RESULTS REFLECT TOUGHER TRADING
As we noted above, sector growth has slowed considerably in the current fiscal year, and recent performance has been mixed. The table below shows the top five dollar-store chains’ latest reported revenue growth rates.
[caption id="attachment_92149" align="aligncenter" width="719"] *Including Family Dollar, which was acquired during 2Q15. Comps are at constant currency.Source: Company reports[/caption] Below, we summarize the recent performance of the leading two dollar-store groups. Dollar General Dollar General reported second-quarter 2016 net sales of $5.4 billion, up 5.8% year over year but below the consensus estimate of $5.50 billion. Comps climbed by 0.7% on higher transaction values, which were partially offset by a decline in traffic. The consumables category (i.e., grocery) remained positive. Management commented that same-store sales missed expectations due to retail food deflation and a reduction in SNAP participation rates and benefit levels, and that unseasonably mild spring weather and an intensified competitive environment in certain regions of the country also had an effect. Management noted, too, that retail prices were down about 8% for milk and more than 50% for eggs, the company’s two biggest sellers within perishables. The company estimates that this price deflation, together with SNAP changes, negatively affected same-store sales for the quarter by approximately 60–70 basis points. To counteract these headwinds, the company plans to take aggressive action across merchandising and store operations to help drive same-store sales, and says that it will continue to exercise discipline in operational expenses. Dollar Tree and Family Dollar In the second quarter, Dollar Tree’s group revenues were $5.0 billion, below the $5.08 billion consensus estimate and compared to $3.0 billion in the year-ago quarter, which included only four weeks of Family Dollar operations. Same-store sales were up 1.2% in constant currency, driven by higher customer count and average ticket. In the Dollar Tree segment, the top-performing categories included party supplies, snacks and beverages, and toys and household products. Sales in discretionary categories outpaced those of consumables. In response to Dollar General’s comments about SNAP, management at Family Dollar noted that its food-stamp penetration rate is relatively low, at under 5%, and that the rate is higher at Family Dollar than at Dollar Tree. KEY TAKEAWAYS
- The dollar-store sector has been a beneficiary of the postrecession boom in discount retail. The top five chains have grown their store numbers by 21% and their sales by 31% in the five years through fiscal 2016.
- Despite this growth, the sector remains somewhat niche in grocery, accounting for only an estimated 2.5% of core grocery spending in the US this year. Around two-thirds of dollar-store sector sales are in grocery categories.
- The sector is facing three near-term headwinds: food-price deflation, intensified competition on grocery prices from Walmart and cutbacks to SNAP programs. The latter change is affecting some retailers more than others.
- Beyond these short-terms competitive pressures, there is little reason to think dollar-store growth cannot be sustained. For instance, the market leader, Dollar General, is planning for 6%–8% growth in its square footage in each of the current and next fiscal years; this is equivalent to 900 new Dollar General stores this year and 1,000 next year.
- In short, we expect the sector to continue to gain share in grocery.