Source: Company reports/Fung Global Retail & Technology
2Q16 RESULTS
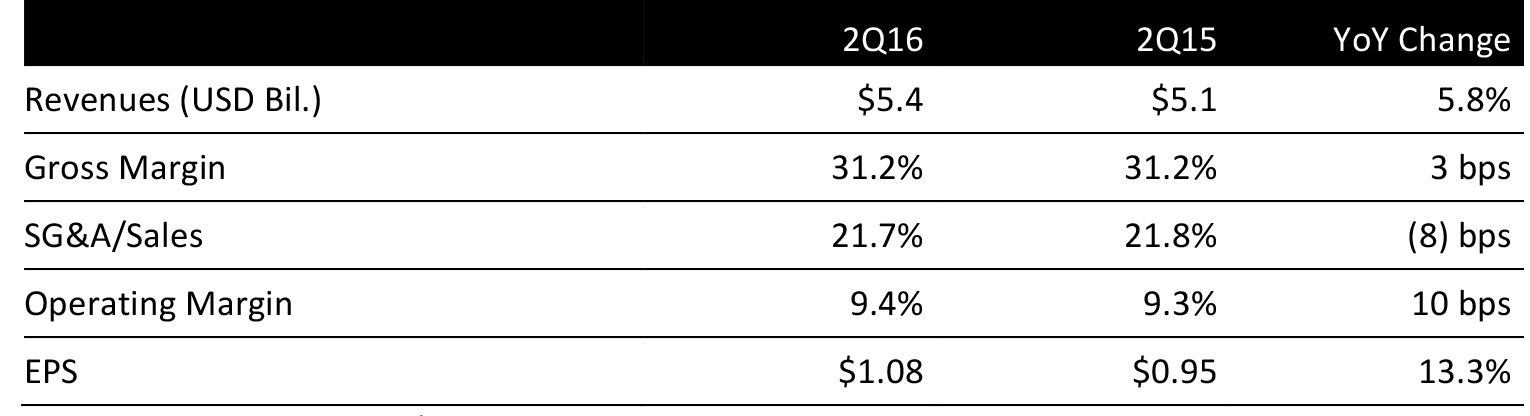
Dollar General reported 2Q16 net sales of $5.4 billion, up 5.8% and below the consensus estimate of $5.50 billion.
Comps declined by 0.7% on higher transaction values offset by a decline in traffic. Positive results in the consumables category and flat results in the seasonal category were offset by negative results in the apparel and home categories. The sales increase was helped by sales from new stores but offset by sales from closed stores.
The gross margin was 31.2% in the second quarter of 2016, up three basis points from the year-ago quarter, owing to higher initial inventory markups and lower transportation costs, partially offset by higher markdowns, a greater proportion of sales of consumables, which have a lower margin than non-consumables, and higher inventory shrink.
SG&A was 21.7% of revenues in the quarter, compared to 21.8% in the year-ago quarter, a decrease of eight basis points, due to lower administrative payroll, advertising, and incentive compensation expenses, partially offset by higher retail labor and occupancy costs, which grew faster than sales.
In the quarter, profitability benefited from a decrease in the effective income tax rate to 36.8% from 38.0% in the year-ago quarter, primarily due to the recognition of additional amounts of the Work Opportunity Tax Credit (WOTC) in the quarter.
EPS was $1.08, below the $1.09 consensus estimate.
Detail from the Quarter
Management commented same-store sales missed expectations because of retail food deflation and a reduction in both Supplemental Nutrition Assistance Program (SNAP) participation rates and benefit levels, unseasonably mild spring weather, and an intensified competitive environment in certain regions of the country. For key perishable items, retail prices were down about 8% for milk and more than 50% for eggs, the company’s two largest products within perishables. The company estimates this negatively affected same-store sales for the quarter by approximately 60–70 basis points. To counteract this headwind, management plans to take aggressive action across merchandising and store operations to help drive same-store sales, and will continue to use discipline in SG&A spending.
At the end of the quarter, total inventories were $3.27 billion, compared to $3.03 billion a year ago, an increase of 1.6% per store.
Management reiterated its commitment to grow market share by increasing both units and traffic, and will invest to meet that objective. Specifically, management is making aggressive pricing, labor and marketing investments to increase same-store sales and market share, and will seek to maintain affordability, value and convenience. Management’s primary focus is on consumable categories to drive traffic and units.
For example, management has made retail price reductions of 10%, on average, on about 450 of the company’s best-selling stock keeping units (SKUs) across 2,200 stores; this represents nearly 17% of its store base. At the same time, the company is investing and communicating these price breaks to its customers through incremental store signage, ad circulars, digital coupons, e-mail and digital media. Dollar General will also continue to monitor pricing actions and assess opportunities for ongoing preemptive moves to enhance its competitive positioning.
Management reiterated its long-term operating priorities:
- Drive profitable sales
- Capture growth opportunities
- Enhance its position as a low-cost operator
- Invest in people as a competitive advantage
Through the first half of 2016, the company made significant progress in expanding space allocation for perishables, health and beauty care items, and party and stationery products. This is being implemented across new stores, relocations and remodels, as well as in mature stores, and is expected to be completed in the third quarter.
Year-to-date, the company has added nearly 21,000 cooler doors to mature stores in order to expand its offering of cold beer, more immediate-consumption items and greater product selection. In addition, more than 7,000 existing stores have received planogram expansions across health and beauty care, party, and stationery, which was completed in the second quarter.
2016 Outlook
During the second half of the year, management has plans across both merchandising and store operations to drive same-store sales while maintaining strict discipline over expenses.
On March 10, the company commented it would only update EPS guidance if EPS is no longer expected to fall within the up 10–15% range provided on that date.
Dollar General maintained guidance for revenue growth of 7%–10% and EPS growth of 10%–15%. Current consensus estimates are for comps up 2.8%, revenues of $22.36 billion (+10%) and EPS of $4.65 (+18%).