 Source: Company reports
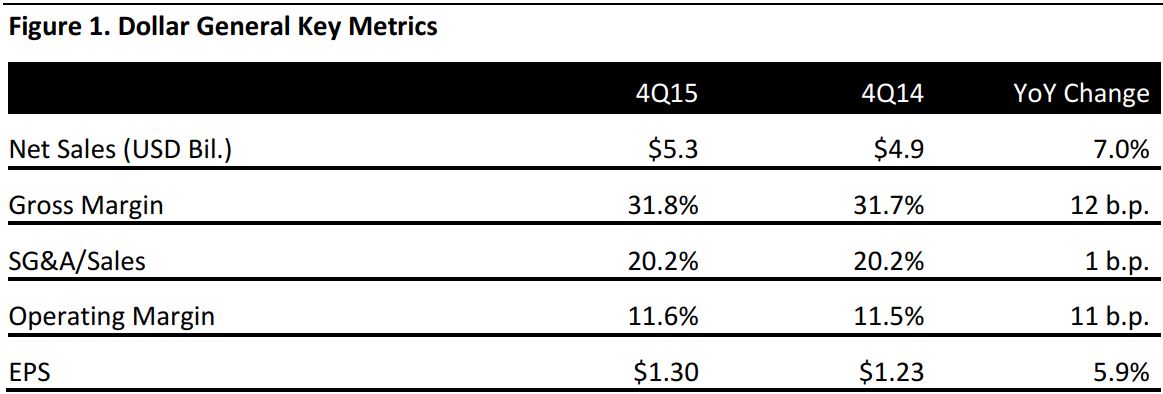
4Q15 RESULTS
The main categories driving Dollar General’s sales increase in the quarter were candy and snacks, perishables, tobacco, and food. In the consumables category, the primary growth drivers were candy and snacks, tobacco and perishables. In the nonconsumables category, growth was more broadly based, and strength in seasonal and home was contrasted by slower growth in apparel.
In the quarter, sales of consumables increased by 7.1% year over year, while sales of seasonal products increased by 7.7%, sales of home products increased by 7.9% and sales of apparel increased by 3.3%, for a total increase of 7.0%.
4Q15 EPS benefited from a retroactive reenactment of the Work Opportunity Tax Credit, which raised EPS by $0.06.
2015 RESULTS
Net sales in 2015 increased by 7.6%, to $20.4 billion, driven by higher sales of candy and snacks, perishables, tobacco, and food. Same-store sales increased by 2.8%, making 2015 the 26th consecutive year in which Dollar General saw same-store sales growth. Drivers of revenue growth were higher customer traffic and higher average transaction amounts due to the refinement of merchandise offerings and increased utilization of store square footage.
In the year, sales of consumables increased by 7.9% versus the prior year, while sales of seasonal products increased by 7.6%, sales of home products increased by 7.0% and sales of apparel increased by 3.3%, for a total increase of 5.8%.
Adjusted EPS, which excludes restructuring expenses, debt refinancing costs and the income tax effect of adjustments, was $3.96, a penny higher than GAAP EPS.
GUIDANCE
Management announced its goal of providing 11%–17% total annual shareholder return per year, comprising EPS growth plus dividends. In 2016, the company plans to return approximately $1.3 billion to shareholders through quarterly dividends and share repurchases.
For 2016, the company expects an increase of 7%–10% in net sales, based on a 6%–8% increase in square footage combined with a 2%–4% increase in same-store sales. This should result in net sales of $21.8–$22.4 billion, in line with the consensus estimate of $22.1 billion.
The company also expects an increase of 10%–15% in EPS, to $4.36–$4.55, in line with the consensus estimate of $4.50.
These figures include the expectation that a 53rd week in the year will contribute approximately 200 basis points to net sales and $0.09 to EPS.
In addition, Dollar General plans to open approximately 900 new stores and relocate or remodel 875 stores in the year.
In 2016, capital expenditures are expected to be $550–$600 million, compared to $505 million in 2015.