Source: Company reports
1Q16 RESULTS
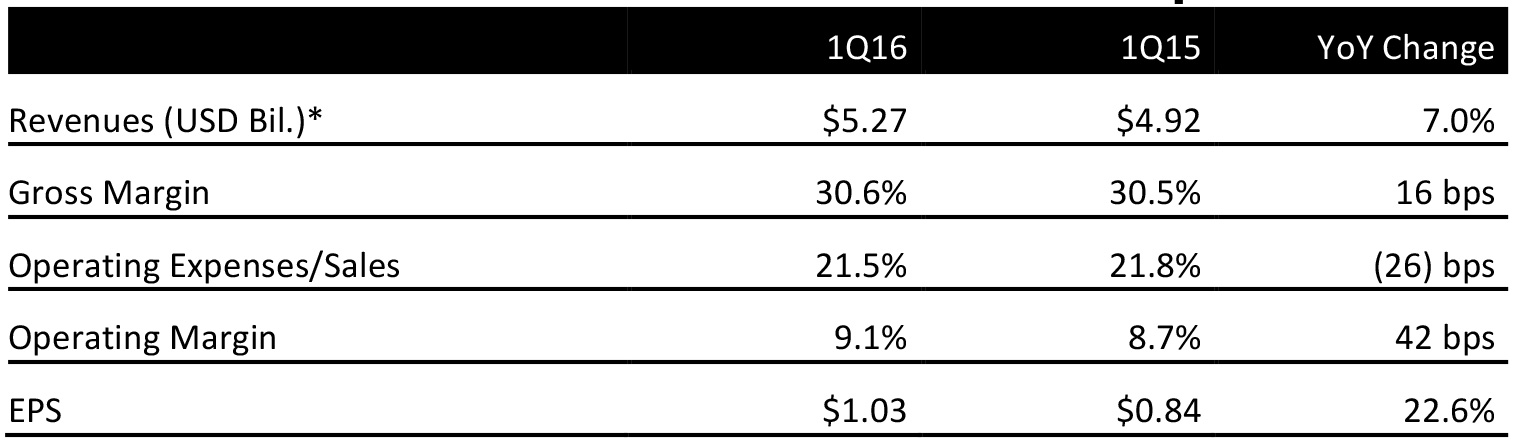
Dollar General reported 1Q16 revenues of $5.27 billion, up 7.0% year over year. For the 33rd consecutive quarter, both customer traffic and average ticket increased year over year.
Comps were up 2.2%, driven by increases in customer traffic and average transaction size as well as by positive growth in consumables and certain nonconsumables categories, such as seasonal and home products.
In the quarter, sales of consumables increased by 7.6% year over year, to $4.04 billion; the primary growth drivers were candy and snacks, tobacco, and perishables. In the nonconsumables category, growth was due to seasonal and home products. Seasonal category sales increased by 6.4%, to $623.9 million; home product sales increased by 6.5%, to $322.8 million; and apparel sales increased by 1.5%, to $279.5 million.
Sales by new stores positively impacted net sales, although the gain was partially offset by the loss of sales from closed stores.
A retroactive reenactment of the Work Opportunity Tax Credit benefited 1Q16 EPS by $0.03.
2016 OUTLOOK
Dollar General did not offer guidance for 2Q16 and also did not revise its previous guidance.
The company plans to return approximately $1.3 billion to shareholders in FY16 through quarterly dividends and share repurchases.
It expects an increase of 7%–10% in net sales in FY16, based on a 6%–8% increase in square footage combined with a 2%–4% increase in same-store sales. This should result in net sales of $21.8–$22.4 billion, in line with the consensus estimate of $22.1 billion.
The company also expects an increase of 10%–15% in EPS, to $4.36–$4.55, in line with the consensus estimate of $4.50.
Dollar General plans to open approximately 900 new stores this year and to remodel or relocate 875 stores. In FY17, the company plans to open about 1,000 stores.
In FY16, capital expenditures are expected to be $550–$600 million, compared to $505 million in 2015.