Nitheesh NH
Introduction
What’s the Story? We discuss the changing dynamics around food retail and foodservice in the US using data sourced from national statistics and our weekly surveys of US consumers. We present four key trends in US consumer behavior. Why It Matters At the start of 2020, many US grocers were bracing for a challenging decade. Restaurants and other foodservice operators were winning sales from grocers by offering an easy alternative to cooking at home. However, the pandemic reversed the momentum in the battle between grocery retailers and foodservice, as restaurants were hit by government-mandated lockdowns, capacity limits and social distancing restrictions. According to the National Restaurant Association, more than 110,000 foodservice establishments closed permanently in the US in 2020. For grocers, meanwhile, the pandemic delivered a sales windfall as consumers pivoted to off-premises consumption and cooked more meals at home. Halfway into 2022, demand for FAFH has largely recovered to its pre-pandemic levels. Retailers must understand how FAH and FAFH dynamics will develop through the rest of the year and beyond in order to adapt to consumers’ new food-spending habits.Dining Out vs. Eating In—Four Key Trends: Coresight Research Analysis
1. Return to On-Premise Consumption Shifts Food Dollars to Foodservice from Retail The pandemic reversed a decade-long trend of market share gravitating from retail to foodservice, which boosted grocery store sales at the expense of restaurants. Figure 1 shows the bifurcation of FAH and FAFH spending, and how the pandemic flipped the market share in favor of food retail in 2020, according to the US Department of Agriculture (USDA). In 2021, the trend reversed again as increased consumer mobility and a willingness to return to pre-pandemic activities shifted food dollars back toward FAFH, underscoring the strength and resilience of demand for restaurants. The gap narrowed in January 2022, when a rise in US cases of the Omicron variant likely benefited at-home consumption. The FAFH share has risen since then and represented 54.4% of total food sales in May. We believe that a continued increase in consumer mobility and a workers’ gradual return to the office will pressure FAH sales in the coming months. Additionally, existing structural factors such as increased demand for experiences over goods will likely contribute to FAFH share gains in 2022 and beyond.Figure 1. Total US Food Spending: FAH vs. FAFH [caption id="attachment_153359" align="aligncenter" width="700"]
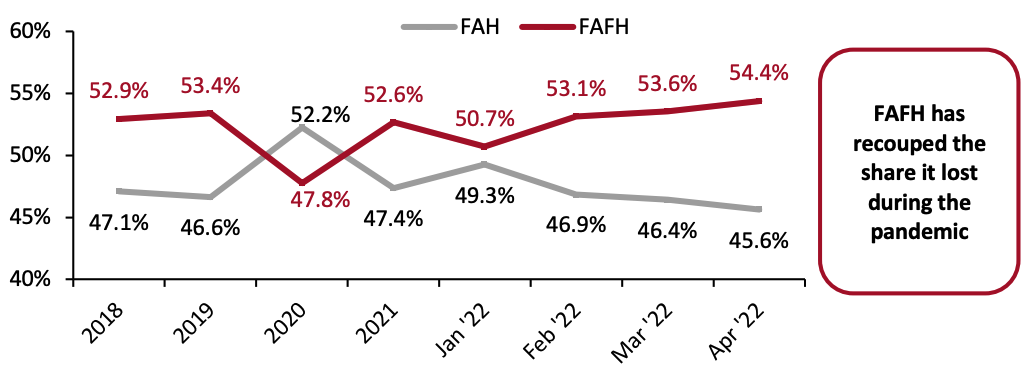 Excludes food furnished, donated, home-produced, and served at educational institutions
Source: USDA/Coresight Research[/caption] 2. FAH Outpaces FAFH for Nine Straight Months Dining out is typically more expensive than eating in, but restaurant meal prices have risen less quickly than the cost of ingredients for making meals at home in the last eight months—a trend that is making eating at restaurants more appealing. FAFH inflation in June increased by 7.7%, while FAH prices rose by 12.2%; June was the ninth consecutive month in which FAH growth was greater than that of FAFH, according to the Bureau of Labor Statistics (BLS). For quick-service restaurants, menu prices rose by 7.4%, while full-service restaurant meal prices increased by 8.9%.
Figure 2. Inflation: FAH vs. FAFH (YoY % Change) [caption id="attachment_153360" align="aligncenter" width="700"]
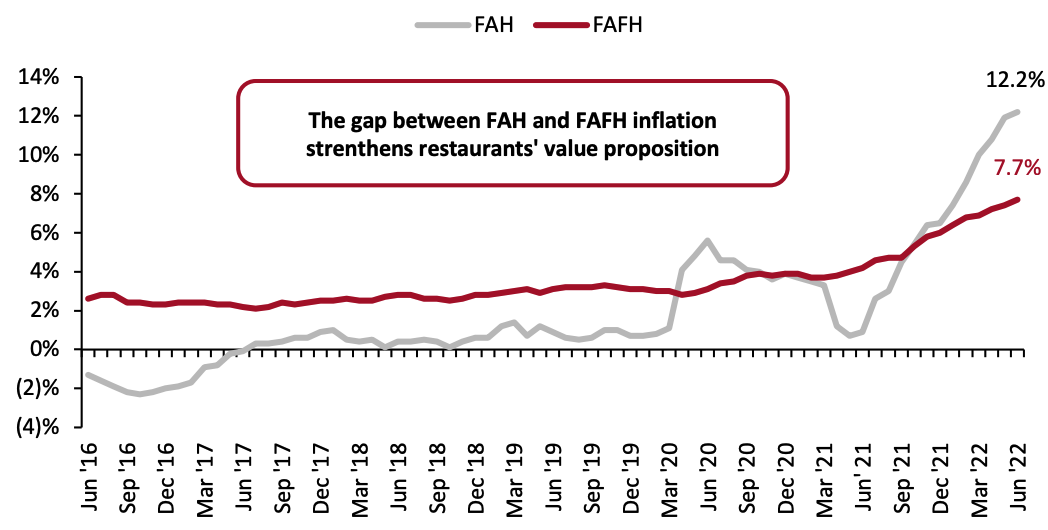 Data are not seasonally adjusted
Source: BLS[/caption] Many restaurant chains have announced incremental menu price increases to combat food price and wage inflation:
- For the quarter ended March 31, 2022, fast-casual restaurant chain Chipotle Mexican Grill reported that it increased menu prices by more than 4% and anticipates that year-over-year price increases for the second quarter will be as high as 12.5%.
- Fast-food restaurant chain Jack in the Box announced in its earnings call for the second quarter ended April 17, 2022, that it expects high-single-digit price increases for the full fiscal year.
- Wendy’s announced in its earnings call for the quarter ended April 3, 2022, that it expects mid- to high-single-digit year-over-year price increases for the full year.
Figure 3. Employee Staffing Levels: YoY % Change [caption id="attachment_153361" align="aligncenter" width="700"]
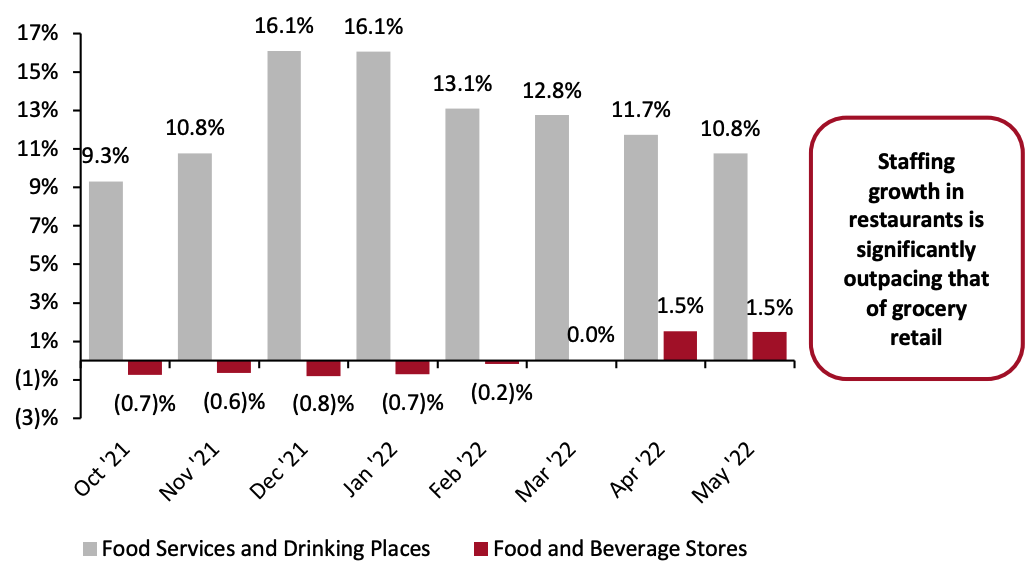 Source: BLS/Coresight Research[/caption]
While restaurant staffing levels overall have continued to improve, there remains upward pressure on wages, with food and drinking places’ average hourly wages reaching $18.32 in April and $18.49 in May 2022 (preliminary data), according to the BLS. However, we note that year-over-year wage growth has weakened for the restaurant industry since the beginning of the year (see Figure 4).
Source: BLS/Coresight Research[/caption]
While restaurant staffing levels overall have continued to improve, there remains upward pressure on wages, with food and drinking places’ average hourly wages reaching $18.32 in April and $18.49 in May 2022 (preliminary data), according to the BLS. However, we note that year-over-year wage growth has weakened for the restaurant industry since the beginning of the year (see Figure 4).
Figure 4. US Average Hourly Earnings: YoY % Change [caption id="attachment_153362" align="aligncenter" width="700"]
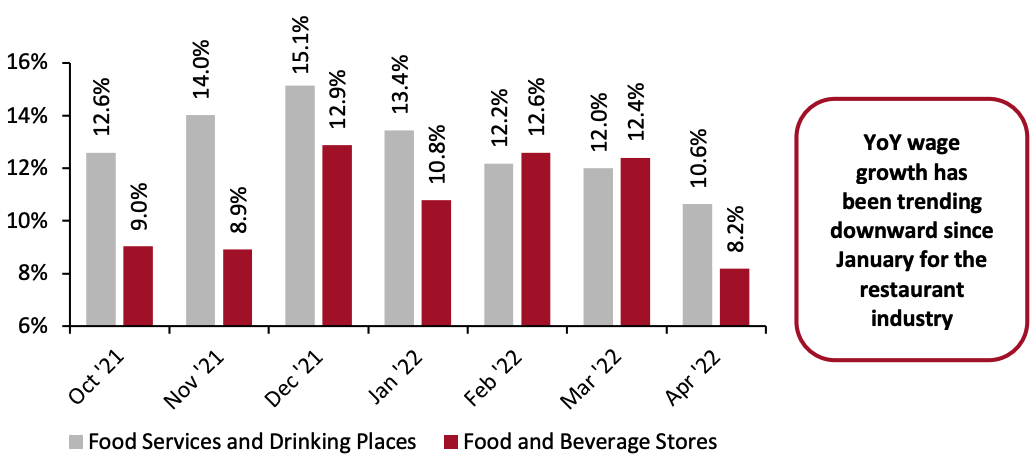 Source: BLS/Coresight Research[/caption]
Labor shortages and wage inflation have a higher impact on restaurants than on supermarkets, given the former are much more labor-intensive businesses. As shown below, labor costs account for a higher component of total expenses than food and ingredient costs for restaurants. Additionally, these labor costs as a percentage of total expenses are much higher than grocery retailers’ SG&A (selling, general and administrative) costs (which mainly comprise wages, employee benefits, rent, depreciation and utilities).
Source: BLS/Coresight Research[/caption]
Labor shortages and wage inflation have a higher impact on restaurants than on supermarkets, given the former are much more labor-intensive businesses. As shown below, labor costs account for a higher component of total expenses than food and ingredient costs for restaurants. Additionally, these labor costs as a percentage of total expenses are much higher than grocery retailers’ SG&A (selling, general and administrative) costs (which mainly comprise wages, employee benefits, rent, depreciation and utilities).
Figure 5. Cost Breakdown of Selected US Restaurant Chains and Grocery Retailers in Their Latest Fiscal Years (% of Total Costs and Expenses) [caption id="attachment_153363" align="aligncenter" width="700"]
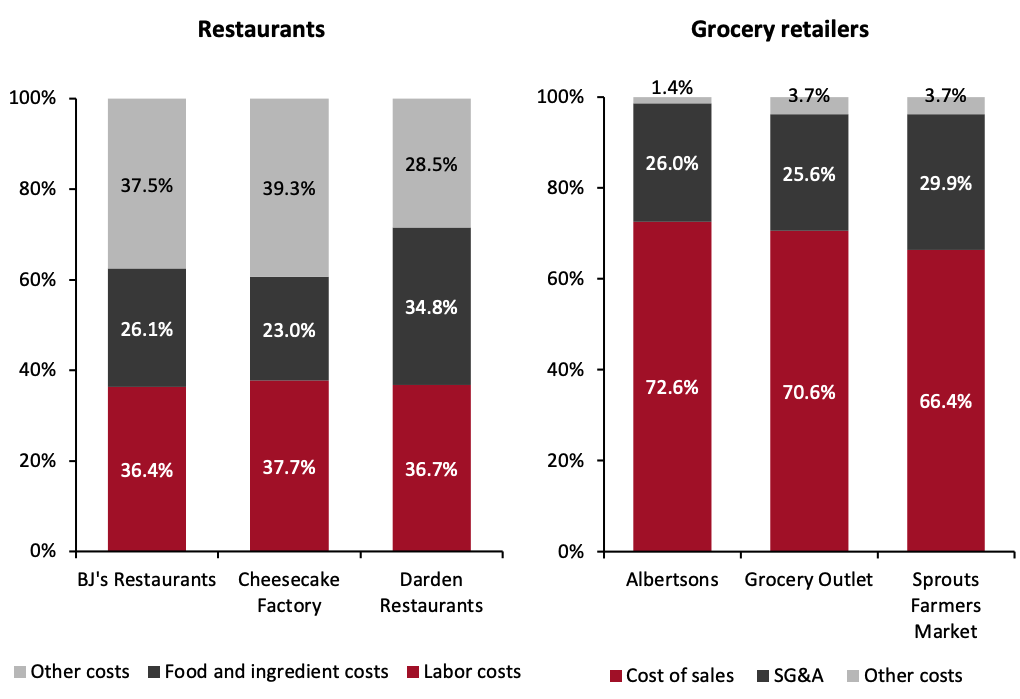 BJ’s Restaurants and Cheesecake Factory’s latest fiscal year ended on December 28, 2021; Darden Restaurants’ latest fiscal year ended on May 29, 2022
Albertsons’ latest fiscal year ended on February 26, 2022; Grocery Outlet’s latest fiscal year ended on January 1, 2022; Spouts Farmers Market’s latest fiscal year ended on January 2, 2022
Source: Company reports/Coresight Research[/caption] We expect the easing of labor costs and improved staffing levels will help restaurants better meet demand over 2022, potentially drawing more share from at-home consumption. 4. In-Store Grocery Shopping and Restaurant Visits Down Since April To gauge the balance between consumers dining out versus those eating in, we turn to our proprietary weekly survey data. Aggregating data to a monthly level, we can see that the proportions of respondents reporting that they have bought food in-store and dined out in the two weeks prior to each survey fell between April and June (see Figure 6). The weakening trend could reflect consumers pushing back against higher prices, as well as a consolidation of trips to restaurants and grocery stores amid all-time-high gas prices. However, we note that heightened caution due to rising Covid-19 cases in May and into June could also have supported the declines. In July, the proportion of respondents that visited restaurants increased slightly—likely due to consumers engaging in social activities amid the peak of summer—although it remains below the April level.
Figure 6. US Consumers: Proportions That Have Visited a Restaurant vs. Bought Food In-Store (% of Respondents) [caption id="attachment_153368" align="aligncenter" width="700"]
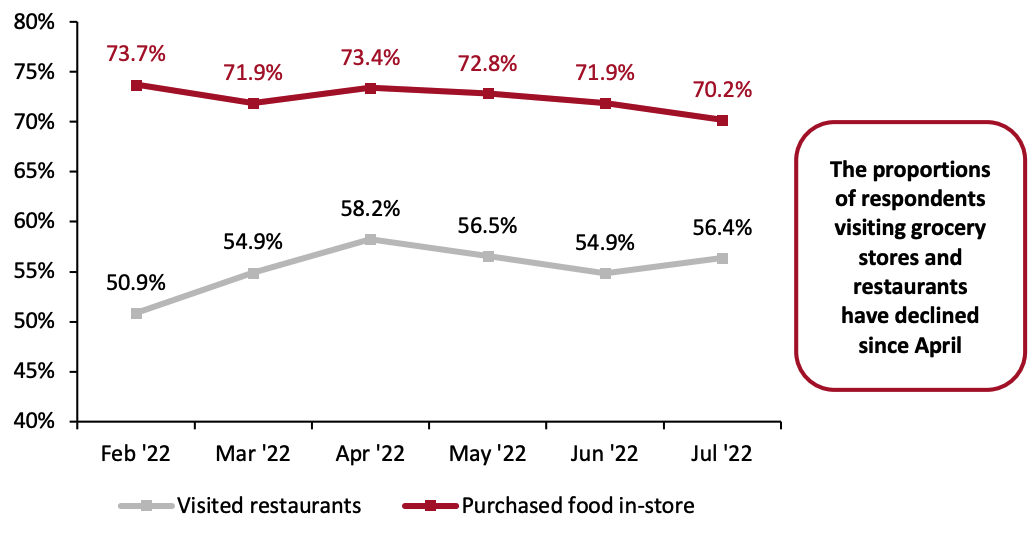 Totals for each month based on combined weekly survey data of the proportions of US consumers that reported visiting a restaurant or purchasing food in-store in the two weeks prior to each survey
Base: US respondents aged 18+
Source: Coresight Research[/caption] In its earnings call for the fiscal year ended February 26, 2022, Albertsons noted that customers are beginning to return to mission-driven shopping behavior, making fewer grocery trips while buying more in each basket—consolidating trips in order to cut down on driving. We expect higher gas prices to similarly increase the average order value at restaurants, with consumers buying more or ordering more expensive items per visit as a trade-off for not making as many visits.
What We Think
FAH prices have risen faster than FAFH prices over the past year, shrinking the cost gap for consumers between dining out and preparing meals at home. This has likely triggered a reverse substitution effect, with some consumers reallocating more of their food spend away from grocery retail and toward restaurants. Given FAFH inflation is still high, we expect them to switch spend to less expensive restaurants and meal options within the restaurant category, with quick-service restaurants better positioned to benefit in the challenging environment. We expect the gap between FAH and FAFH inflation to widen over the course of 2022 as commodity prices (which impact grocery retail more than restaurants) continue to reach new highs, while wage rates and labor shortages (which impact restaurants more than grocery retail) see decelerating cost pressures. Implications for Retailers- Gas prices are hitting historic highs, and consumers are shifting their shopping behaviors accordingly. This may impact both grocery and restaurant traffic as consumers consolidate their trips to save on gas, which may result in consumers shopping or dining more at nearer establishments.
- Grocery retailers can compete for a share of the foodservice pie by developing shopping experiences that match the convenience of out-of-home eating. Retailers can focus on creating meal options that emphasize affordability, nutrition and culinary expertise.