 Source: Company reports
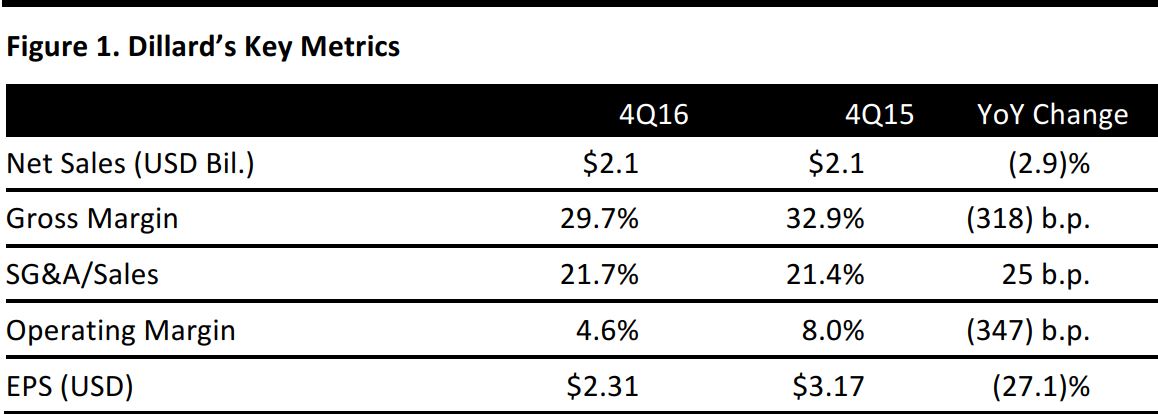
4Q16 Results
Dillard’s reported total 4Q16 revenues of $2.1 billion, down 2.9% from $2.2 billion a year ago.
Management commented that 4Q sales were strongest in the Western region, followed by the Eastern and Central regions, and that sales were soft on the Southern border, particularly in energy-producing regions. Management further commented that sales came in lower than expected in a difficult quarter, and that it strove to control inventory in an unusually competitive environment.
Moreover, higher markdowns adversely affected gross margins.
Gross margin from retail operations declined by 344 basis points year over year due to higher markdowns as a response to weak sales. SG&A was $449.4 million, amounting to 21.7% of sales, compared to 21.4% of sales in the prior year.
The company’s 4Q EPS included a $2.0 million (or $0.06 per share) after-tax gain for the sale of one store location.
During the quarter, the company repurchased 1.6 million Class A shares for $117.5 million.
FY16 Results
Revenues for FY16 were $6.8 billion, down 0.4% from FY15. Total merchandise sales were $6.6 billion, down 1.6% from the prior year, including sales from the company’s construction business, CDI. Excluding CDI, merchandise sales decreased by 2%, and comps also decreased 2%.
Consolidated gross margin was 35.6%, down 144 basis points from the prior year, and gross margin from retail operations declined by 107 basis points. SG&A expense was $1.7 billion, amounting to 25.3% of sales, compared to 25.1% of sales in the prior year. Operating expenses increased by $6.0 million due to higher selling expense, which was partially offset by lower advertising expense.
EPS was $6.91, which included a tax credit of $0.21 per share related to the sale of four store locations, compared to EPS of $7.79 in the prior fiscal year.
During the fiscal year, the company repurchased 5.3 million Class A shares for $500 million.
Inventory remained flat versus a year ago.
Guidance
The company did not offer revenue or earnings guidance, but guided for $250 million of depreciation and amortization (flat year over year), $27 million in rental expense (flat year over year), $61 million in net interest and debt expense (flat year over year), and $150 million in capital expenditures, compared to $166 million in FY15.