Executive Summary
In this report, we bring together data on spending by retail category from the US, the UK, Germany and China, and focus on the share of total retail sales accounted for by various categories. In clothing and footwear:
- Brits allocate a much greater share of retail spending to clothing and footwear than do their peers in the US and Germany, and that share grew in most years up to 2015, according to the UK’s Office for National Statistics (ONS).
- Clothing and footwear captures a smaller share of retail spending in the US than in the other Western markets we consider. The category lost some 76 basis points of share between its 2012 peak and 2016.
- Apparel has been losing share of retail spend in China. Clothing and footwear are semidiscretionary purchases and as shoppers become wealthier, they tend to spend more on discretionary goods. In beauty and personal care:
- Changes over time are much less dramatic in this category than in apparel. Apart from China, the category’s share of all retail sales has remained broadly level in the countries we examined. In food and beverages:
- American consumers dedicate less of their spending to the category than do consumers in the UK and Germany, and the relative share has been falling.
- In the US, the food and beverage category’s share of retail spending fell by 213 basis points between its 2011 peak and 2016. In the UK, the category ceded 269 basis points of retail share between its 2013 peak and 2016.
- Food, beverages and tobacco capture a much larger share of retail sales in China—an estimated 52% in 2016. This share has been steadily diminishing, as is usual in a developing economy.
Introduction
At Fung Global Retail & Technology, we cover the latest retail and consumer trends, from retailers closing stores to shoppers renting fashion. Sometimes, though, it can be worthwhile to go back to basics and take another look at what consumers are doing and how (or if) their spending habits are changing. In this report, we bring together data on spending by retail category from the US, the UK, Germany and China, and focus on the share of total retail sales accounted for by various categories. This analysis allows us to make comparisons of relative share of retail spending over time and between countries.
- We chart medium-term trends in share of retail spending captured by each of the following categories: clothing and footwear; beauty and personal care; and food, beverages and tobacco. These are significant discretionary categories, and two of them have seen considerable changes over recent years: apparel markets have been notably weak in the US and the UK in the recent past, while food has been deflationary in the US and the UK.
- We then provide full breakdowns of retail spending by product category for the US, the UK, Germany and China.
Most published retail data break down retail sales by type of retailer. For this report, we have brought together data on spending by product category and data on total retail sales (excluding automobiles and fuel) to break down retail sales by type of product. Our data are largely sourced from national statistics offices, supplemented by some data, mainly on beauty and personal care sales, from Euromonitor International. We have adjusted where necessary to ensure consistency in inclusion of sales tax. We do not look at nonretail spending, such as spending on services.
Source: Shutterstock
Apparel and Footwear’s Share of Retail Sales
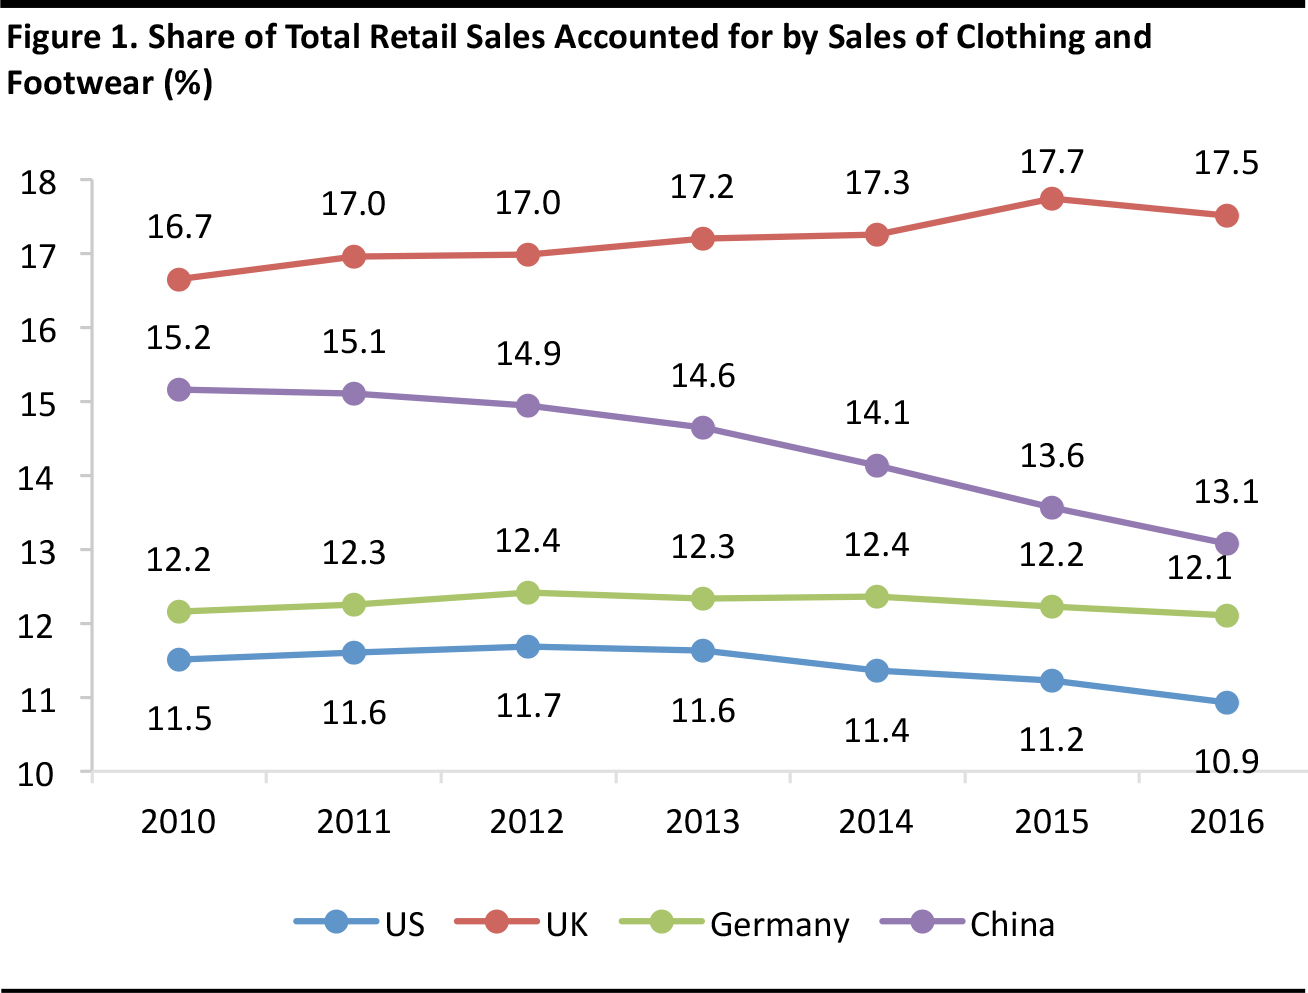
We begin by charting clothing and footwear’s share of total retail sales. The proportion of retail sales accounted for by this category varies by country, but a number of countries have clustered around the 12% mark on this metric. In most of our four focus countries, apparel has lost share of wallet over the past few years.
Source: Shutterstock
We highlight some notable trends in the UK and the US:
- Among our selected countries, the UK is the outlier. Brits allocate a much greater share of retail spending to clothing and footwear than do their peers in the US and Germany, and that share grew in most years up to 2015, according to the UK’s Office for National Statistics (ONS). However, that trend reversed in 2016, when apparel market growth suddenly slowed to a low-single-digit rate, according to the ONS.
- Clothing and footwear captures a smaller share of retail spending in the US than in the other Western markets we consider. The category lost some 58 basis points of share of US retail spending over the review period, and the decline totals 76 basis points when measured from the 2012 peak. However, the decline is only relative: between 2010 and 2016, the US apparel market grew by $63 billion.
- These data suggest that softened demand for apparel in the UK and the US is not simply about consumers switching to spending on leisure services, because the relative declines are observed even when measured only against other retail categories.
In China:
- The relative slump in apparel’s share of all retail sales in China is largely accounted for by growing affluence in the country. Clothing and footwear are semidiscretionary purchases and as shoppers become wealthier, they tend to spend more on discretionary goods.
- Apparel’s share of all retail sales in China is approaching that seen in the US and Germany, which are much more economically developed. We therefore expect this relative decline in China to ease in the near future.

Source: Shutterstock
Source: US Bureau of Economic Analysis/US Census Bureau/ONS/Statistisches Bundesamt/Euromonitor International/Fung Global Retail & Technology
Beauty and Personal Care’s Share of Retail Sales
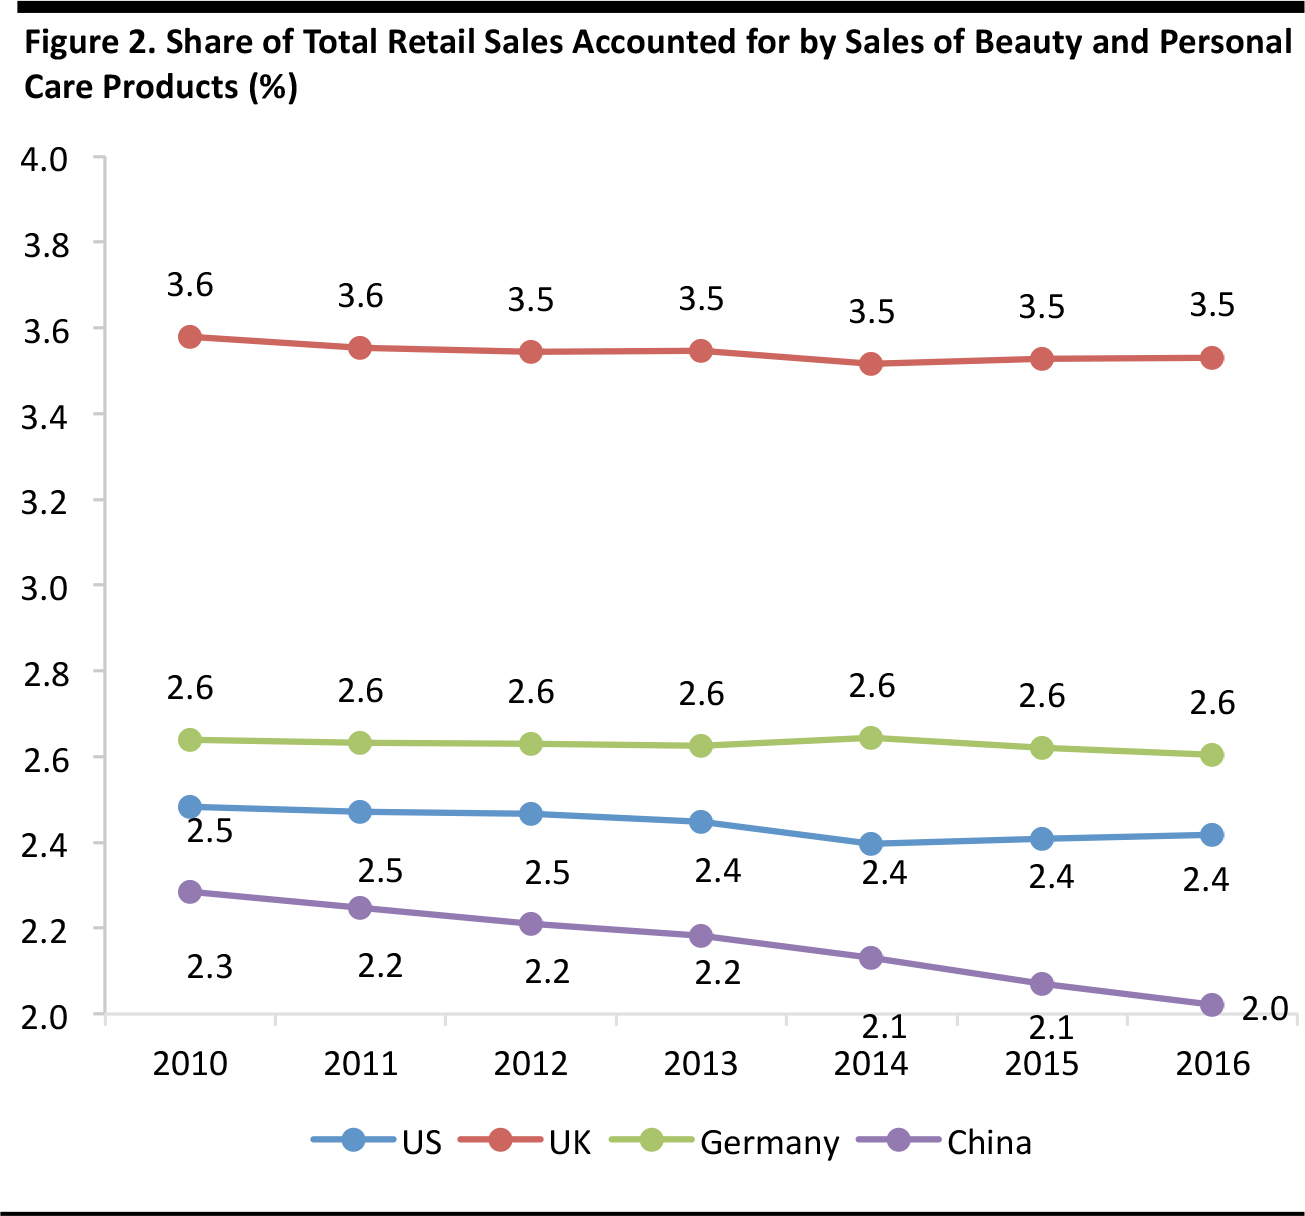
Beauty and personal care products typically account for around 2%–3.5% of total retail sales.
- Changes over time are much less dramatic in this category than in apparel and, apart from China, the category’s share of all retail sales has remained broadly level in the countries we examined, suggesting that the category is relatively resilient.
- The resilience of beauty and personal care in the US further contrasts with the relative decline seen in food and beverages in that country.
- As with apparel, Brits direct notably more of their total retail spending to this category than do shoppers in the other countries we examined.
Source: Euromonitor International/US Census Bureau/ONS/Statistisches Bundesamt/Fung Global Retail & Technology
Food and Beverages’ Share of Retail Sales
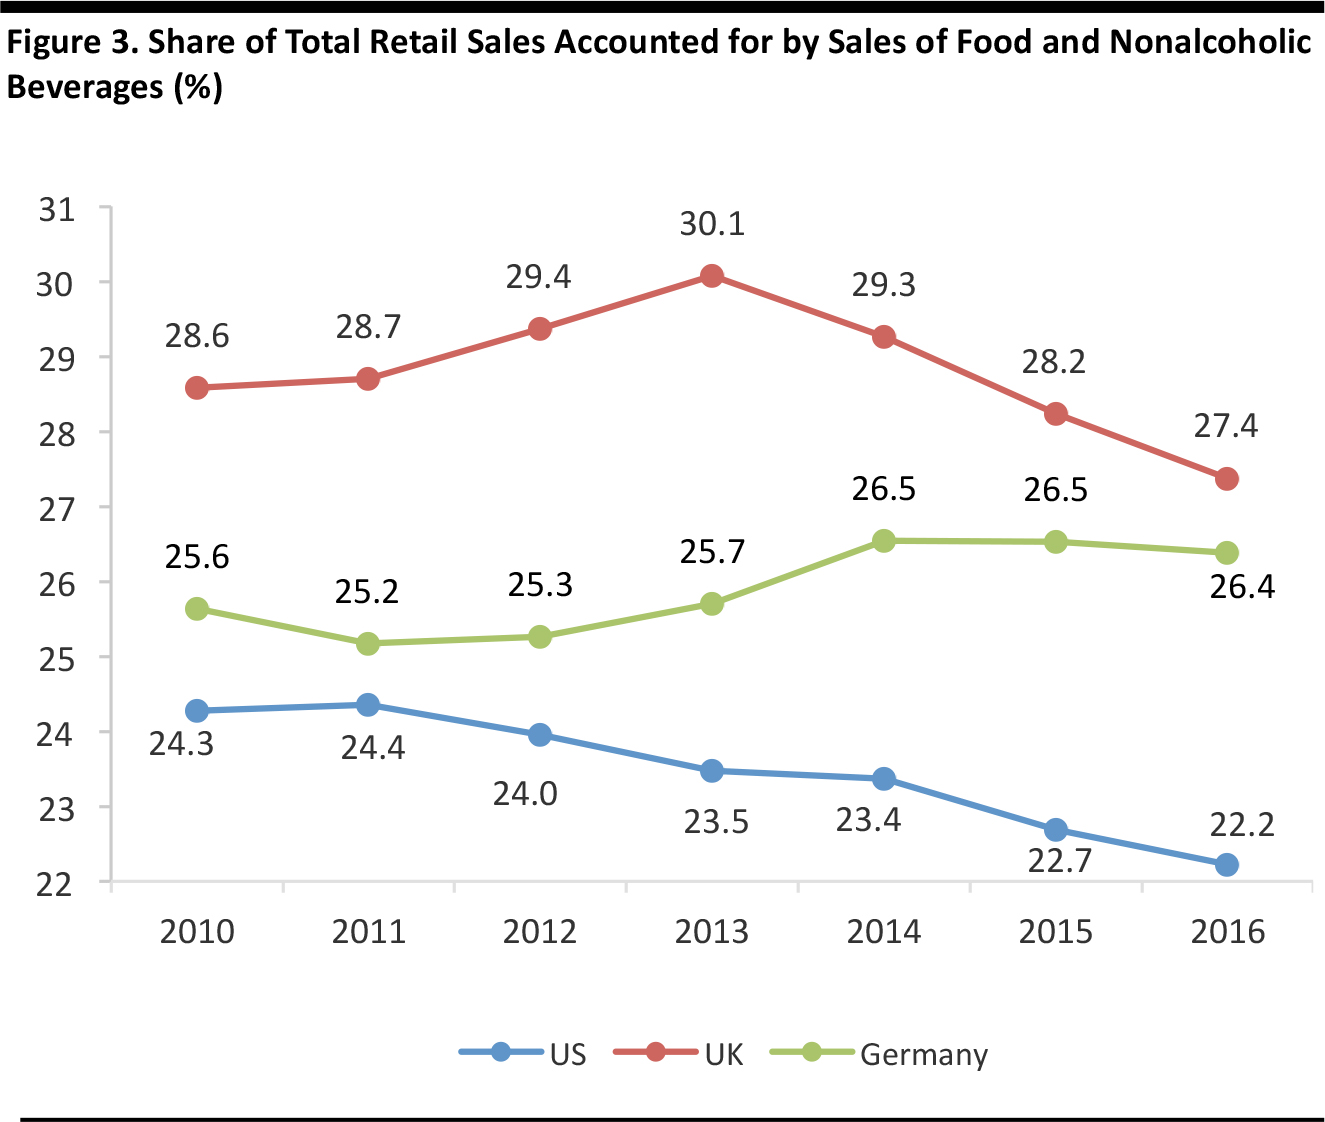
Food and nonalcoholic beverages capture roughly one-quarter of all retail sales, though the category’s share has traditionally been somewhat higher in the UK than in the US and Germany. (We chart the category’s share in China separately below.)
- The picture for food spending in the US is similar to that for apparel: American consumers dedicate less of their spending to the category than do consumers in the UK and Germany, and the relative share has been falling. In the US, the food and beverage category’s share of retail spending fell by 213 basis points between its 2011 peak and 2016. In the UK, the category ceded 269 basis points of retail share between its 2013 peak and 2016.
- The US food market has been deflationary since 2015. However, the category’s relative decline kicked in when US food prices were still rising each year.
- In the UK, the relative decline has been largely a result of supermarket price competition. For instance, food-price deflation was 2.6% in 2015 compared with inflation of 3.8% back in 2013.
- Germany has a stable, low-growth, low-inflation grocery market, where discounters are prominent. Consequently, we see a greater degree of consistency in food’s share of all retail in that country.
Excludes foodservice, i.e., dining out
Source: US Bureau of Economic Analysis/US Census Bureau/ONS/Statistisches Bundesamt/Eurostat/Fung Global Retail & Technology
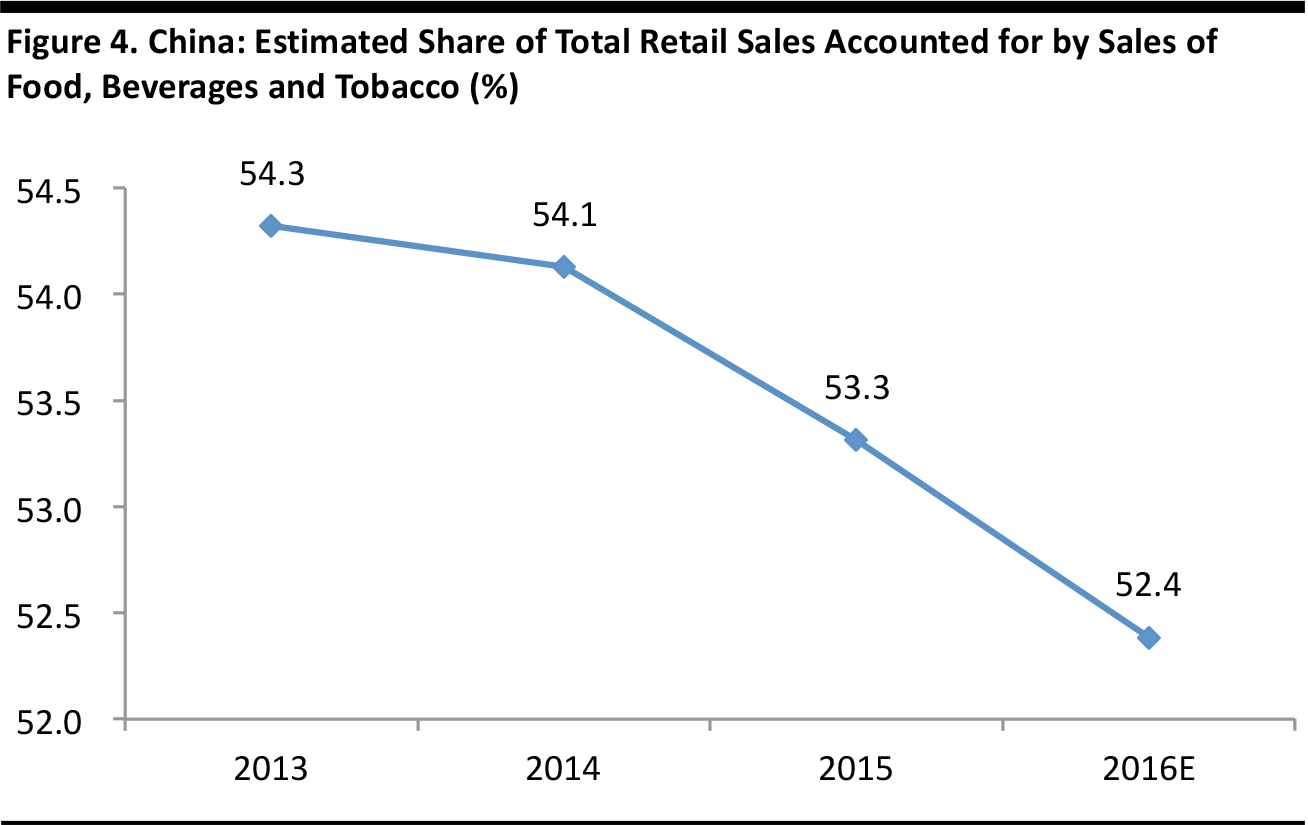
Our data for China include alcoholic beverages and tobacco.
Food, beverages and tobacco capture a much larger—though steadily diminishing—share of retail sales in China, as is usual in a developing economy. We do not have data for years prior to 2013 for China and our figure for 2016 is an estimate: we estimate that Chinese consumers spent ¥8.6 trillion on food, beverages and tobacco in 2016.
Source: National Bureau of Statistics of China/Euromonitor International/Fung Global Retail & Technology
Retail Breakdown in Detail
In this section, we provide breakdowns of retail sales by country, and highlight categories that have grown or lost share of retail sales in each country. For all four of our selected countries, our base is total retail sales excluding sales by foodservice operators, automobile retailers and automotive fuel retailers.
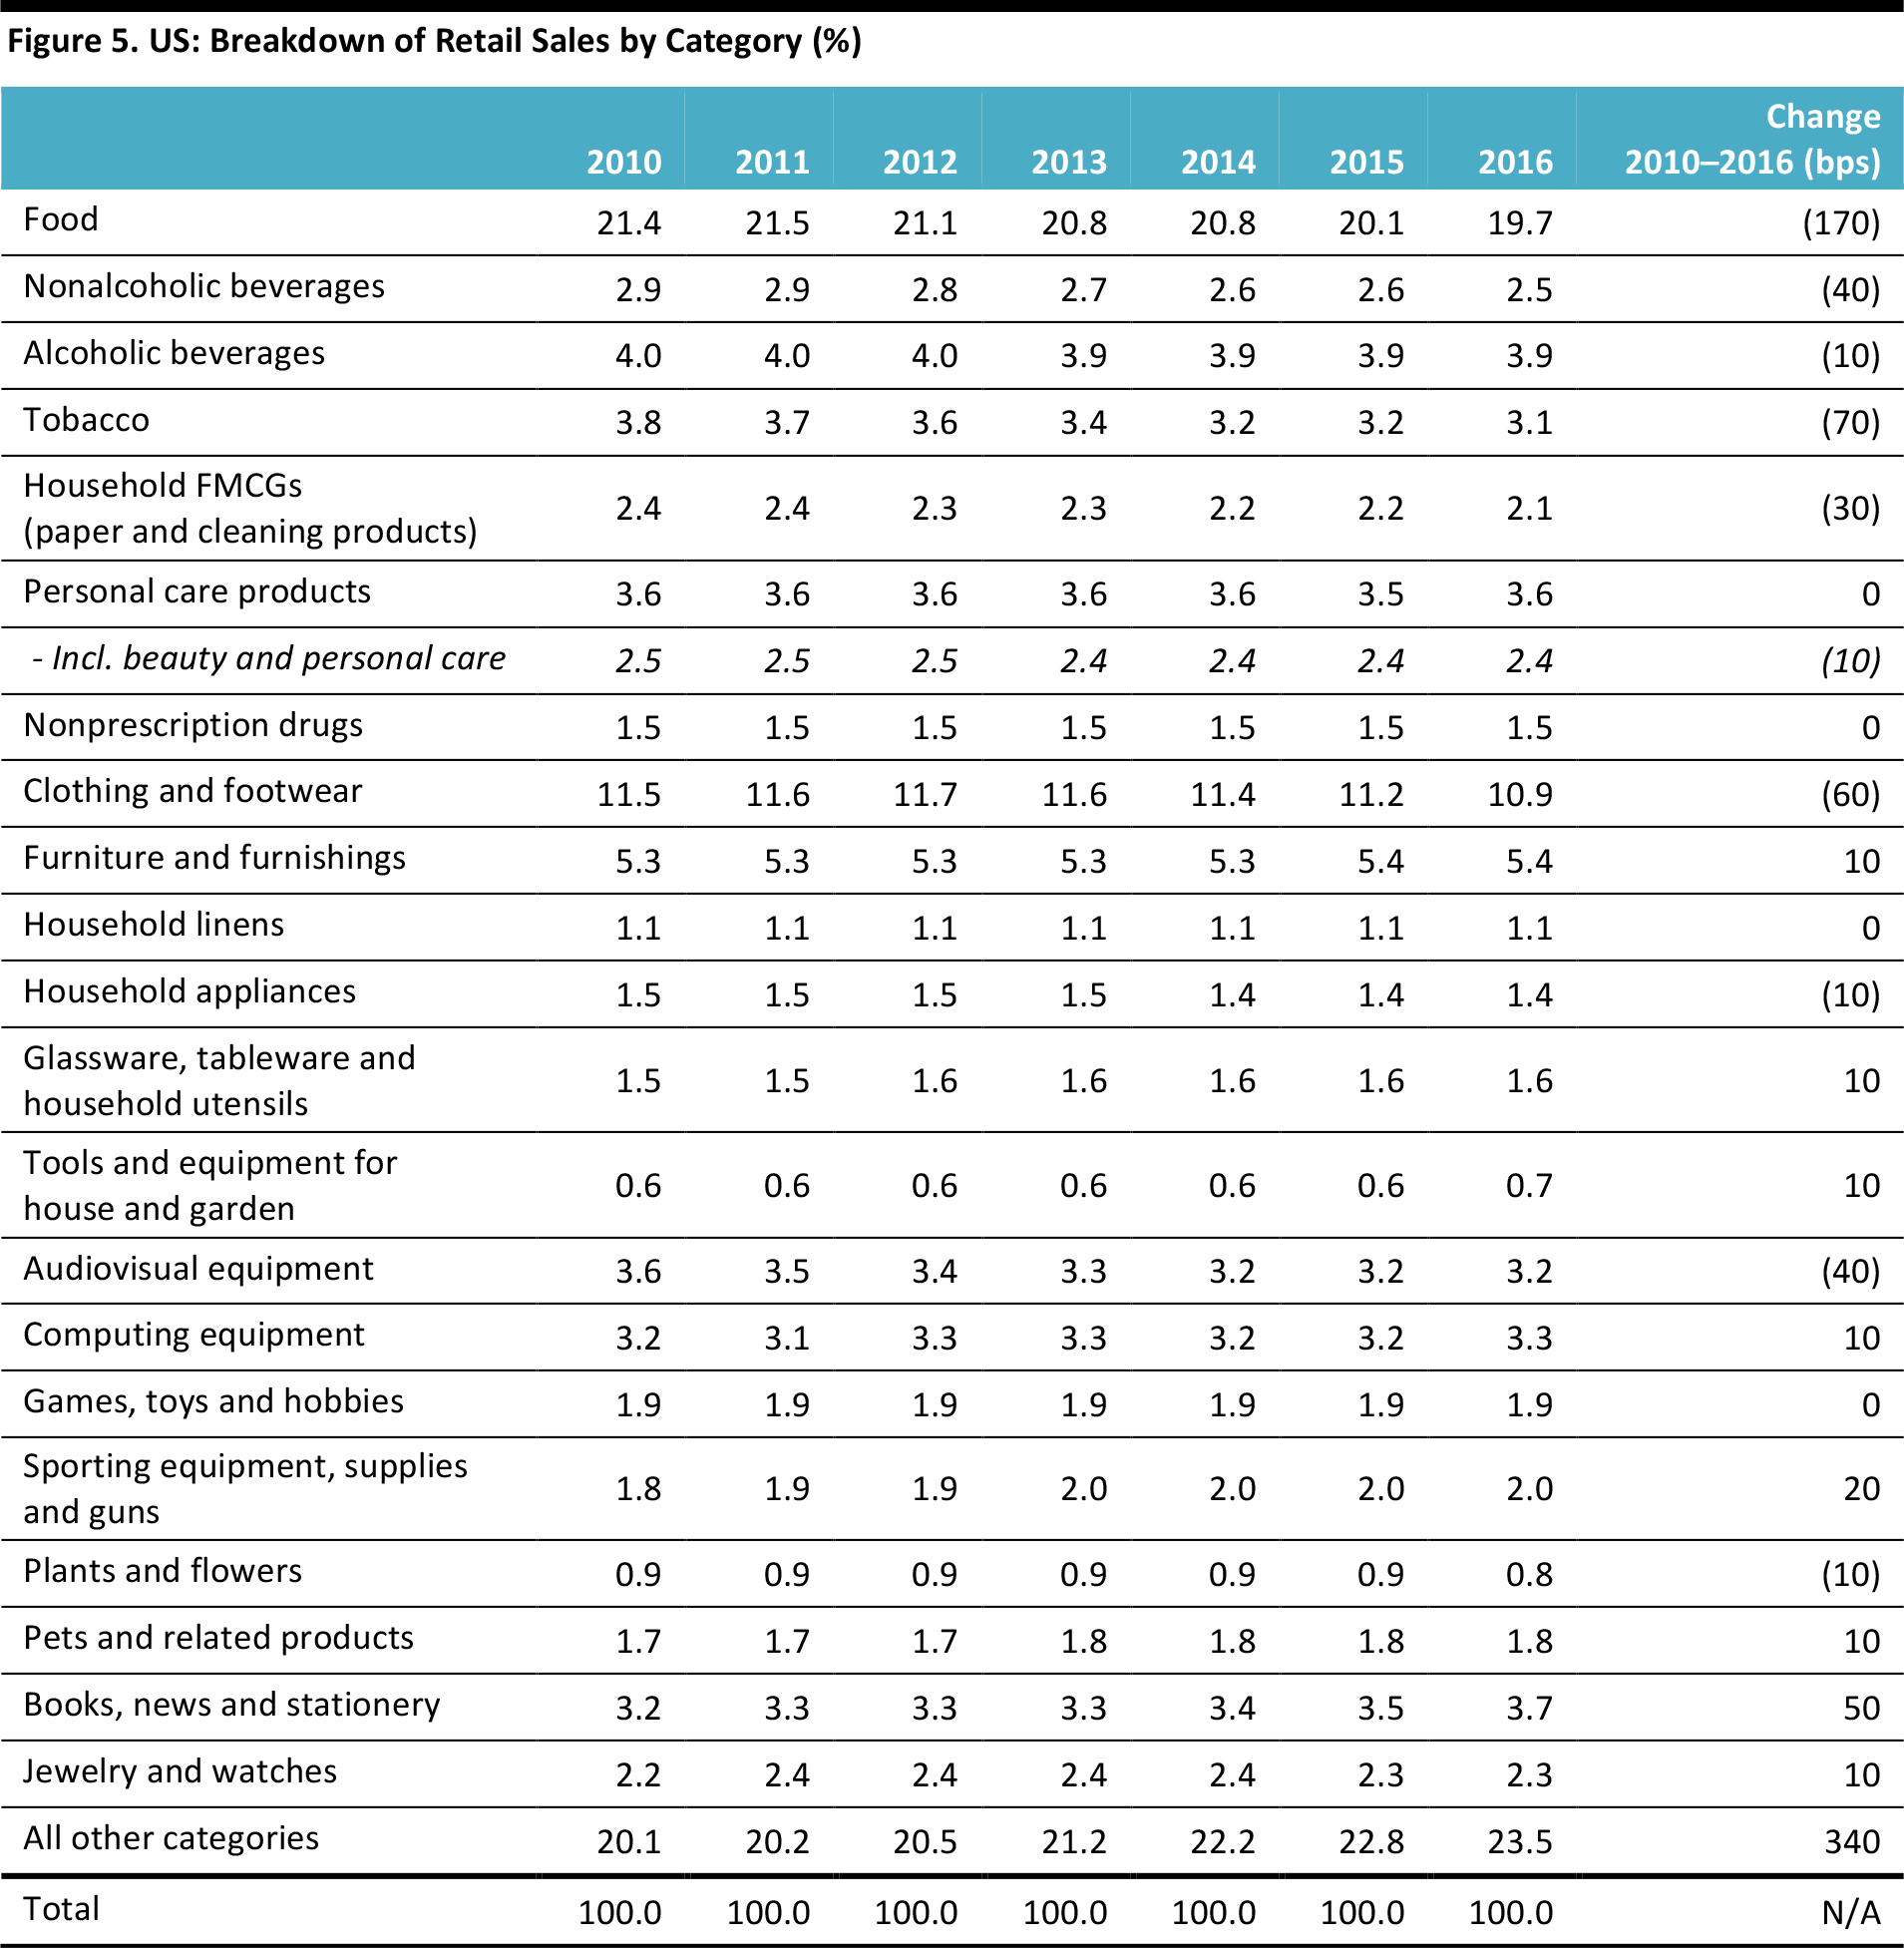
In the US:
- The furniture and furnishings category has grown share of wallet.
- Somewhat counterintuitively, given consumers’ shift toward digital formats, the books, news and stationery category has grown share, according to official data.
- The biggest gainer in the US, however, has been “all other categories,” which makes it difficult to pin down where some retail spending has gone. Moreover, this residual category captures a much higher share of retail sales in the US than in the UK.
- One explanation for this may be that retail sales totals published by the US Census Bureau include some service revenues booked by retailers. So, the residual category may include, for example, healthcare service revenues or foodservice revenues that are generated by retail firms.
Totals may not sum due to rounding.
Source: US Bureau of Economic Analysis/US Census Bureau/Euromonitor International/Fung Global Retail & Technology
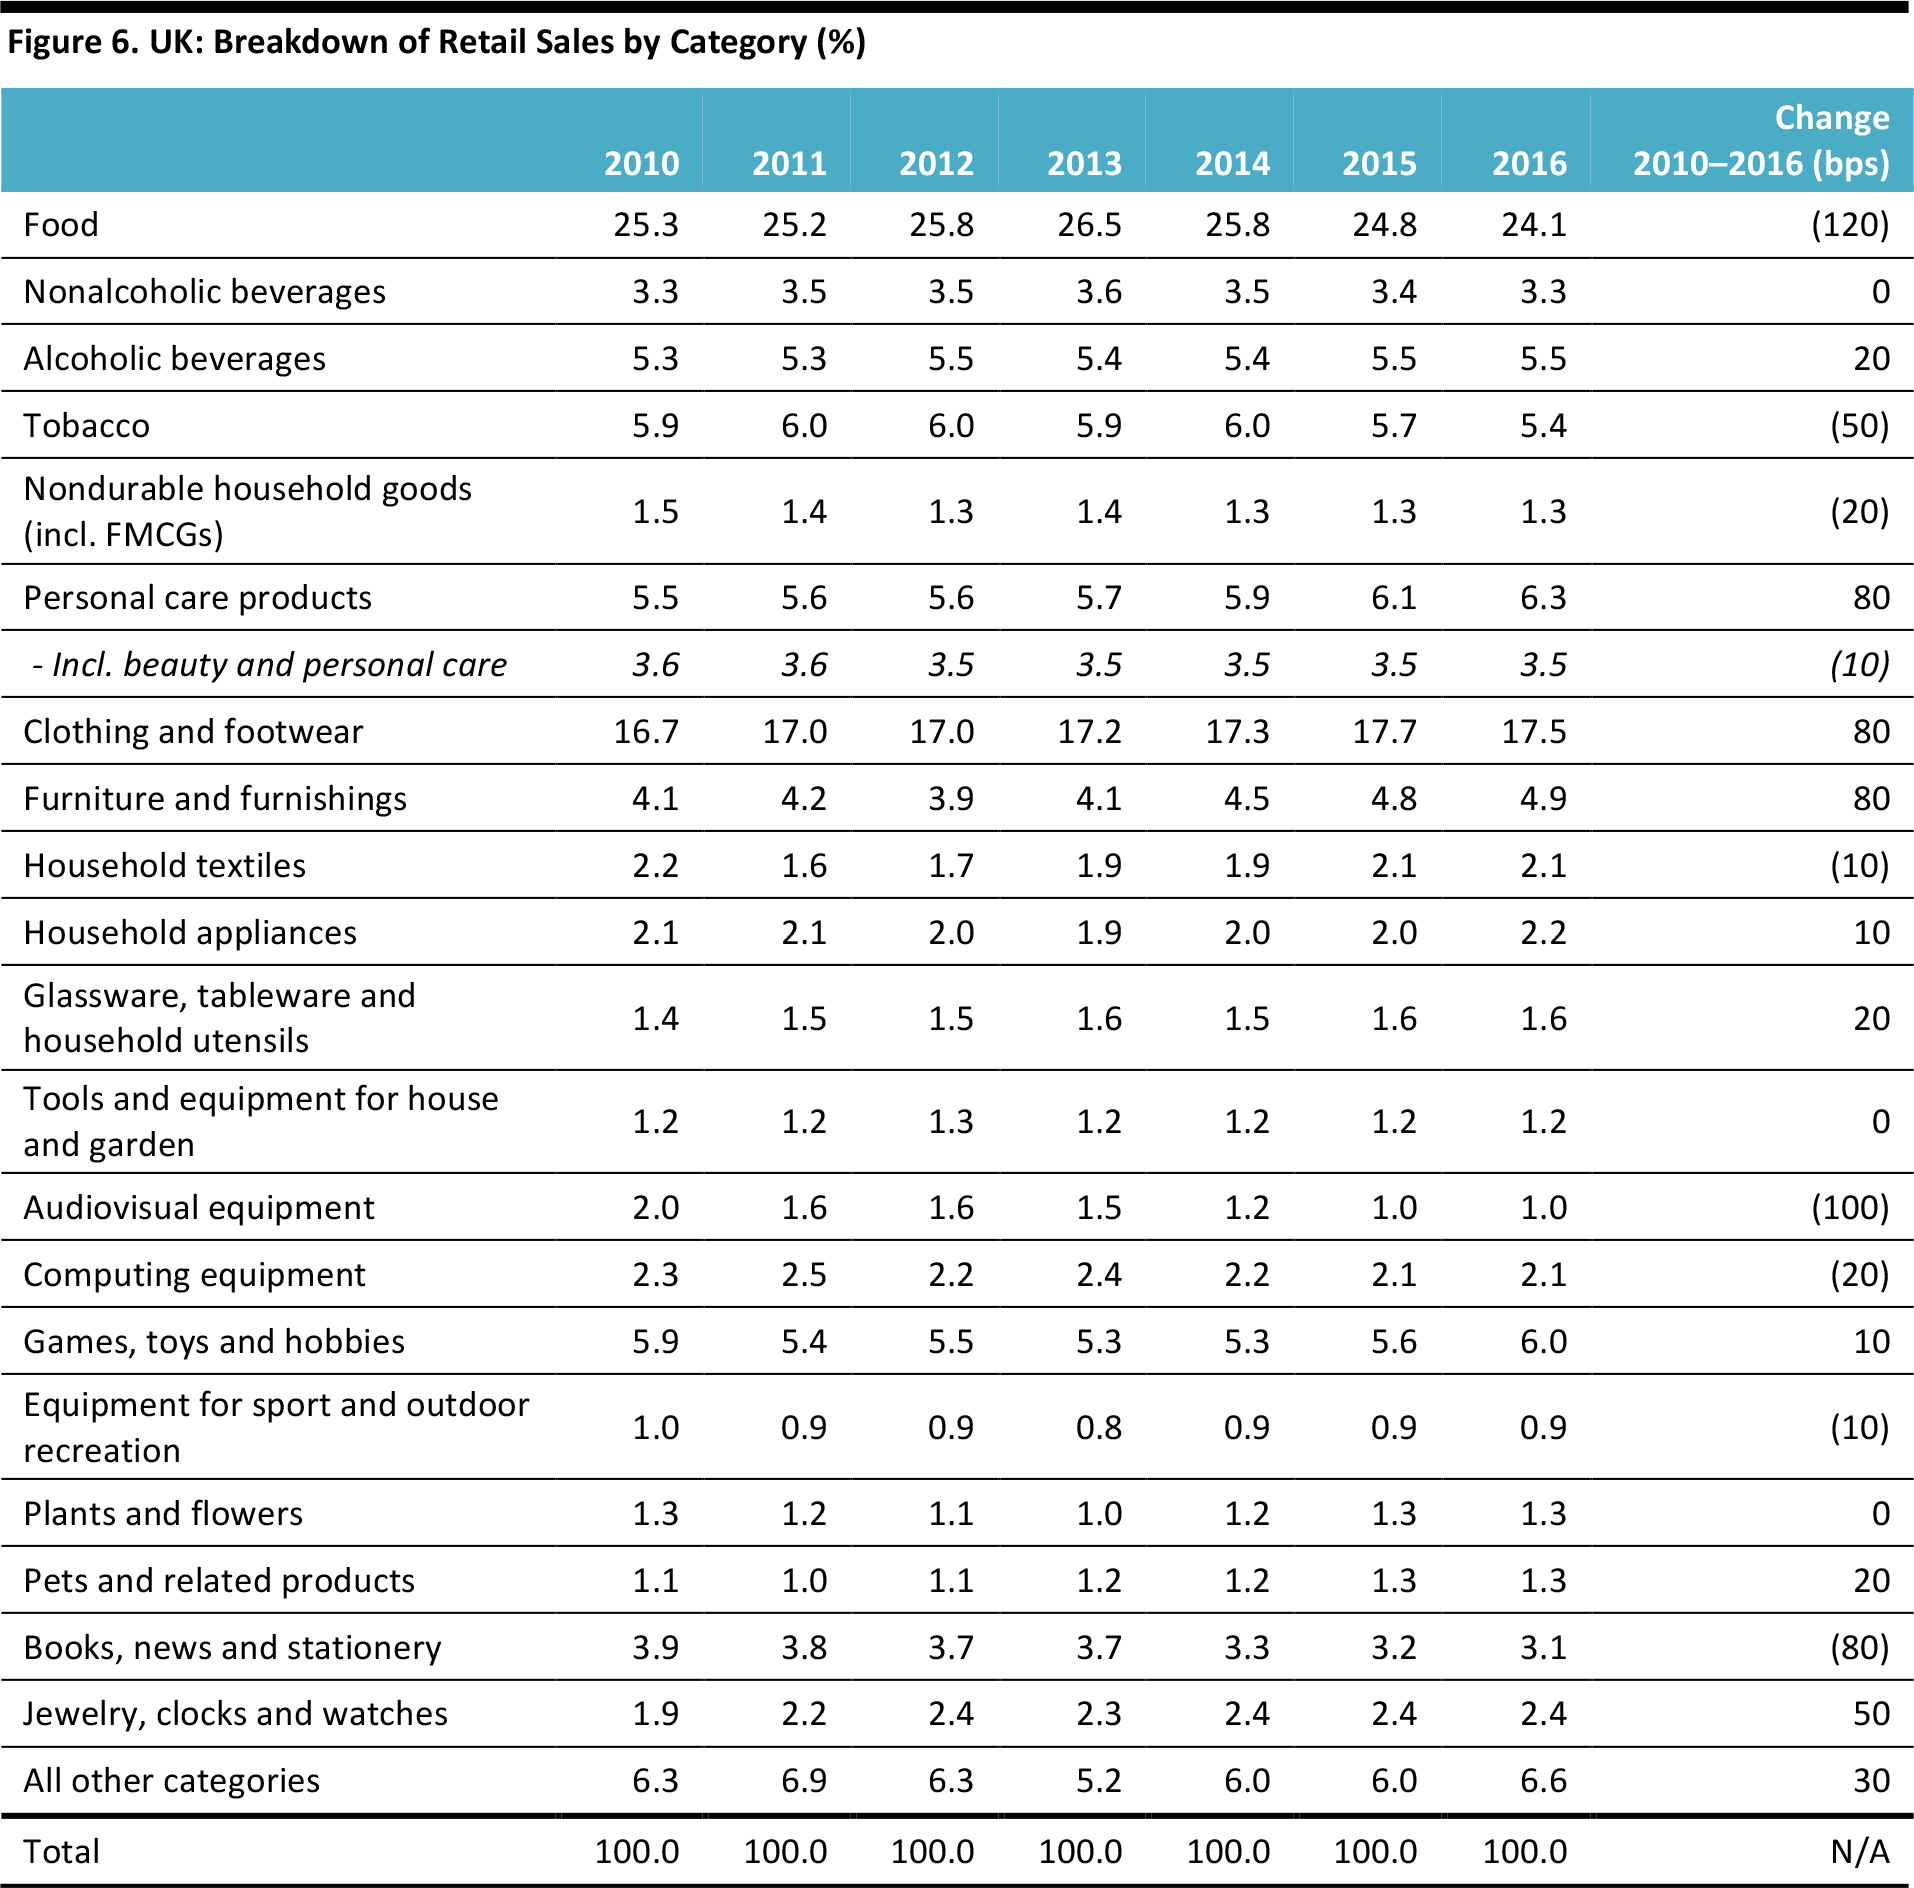
In the UK:
- Alcoholic beverages have bucked the declining trend seen in food and nonalcoholic beverages, despite the fact that alcoholic beverages were deflationary in both 2015 and 2016.
- Furniture and furnishings has been a winning category, building share of retail sales by 80 basis points between 2010 and 2016.
- The games, toys and hobbies category has captured greater share in recent years, likely because consumers have emphasized leisure-time activities.
- Electronics (as categorized by “audiovisual equipment” and “computing equipment”) has seen structural declines in the UK—more so than in the US. Similar structural declines have been seen in the tobacco and books, news and stationery categories.
Totals may not sum due to rounding.
Source: ONS/Euromonitor International/Fung Global Retail & Technology
Our breakdown for Germany is slightly less granular, due to the product categorizations used by the German and European statistics offices.
- Food’s share of all retail sales has grown, and this has coincided with recent incremental shifts away from grocery discounters and toward full-range supermarkets in Germany. This was not an inflation-driven shift, as the Consumer Price Index readings for food were low in the years 2014 through 2016.
- As in the US and the UK, furniture and furnishings has become a slightly more prominent retail category.
- Electronics (represented by “audiovisual, photographic and computing equipment”) has seen steady relative declines, mirroring the trend in the UK.
- Tobacco has proved a more resilient category in Germany than in the US or the UK.
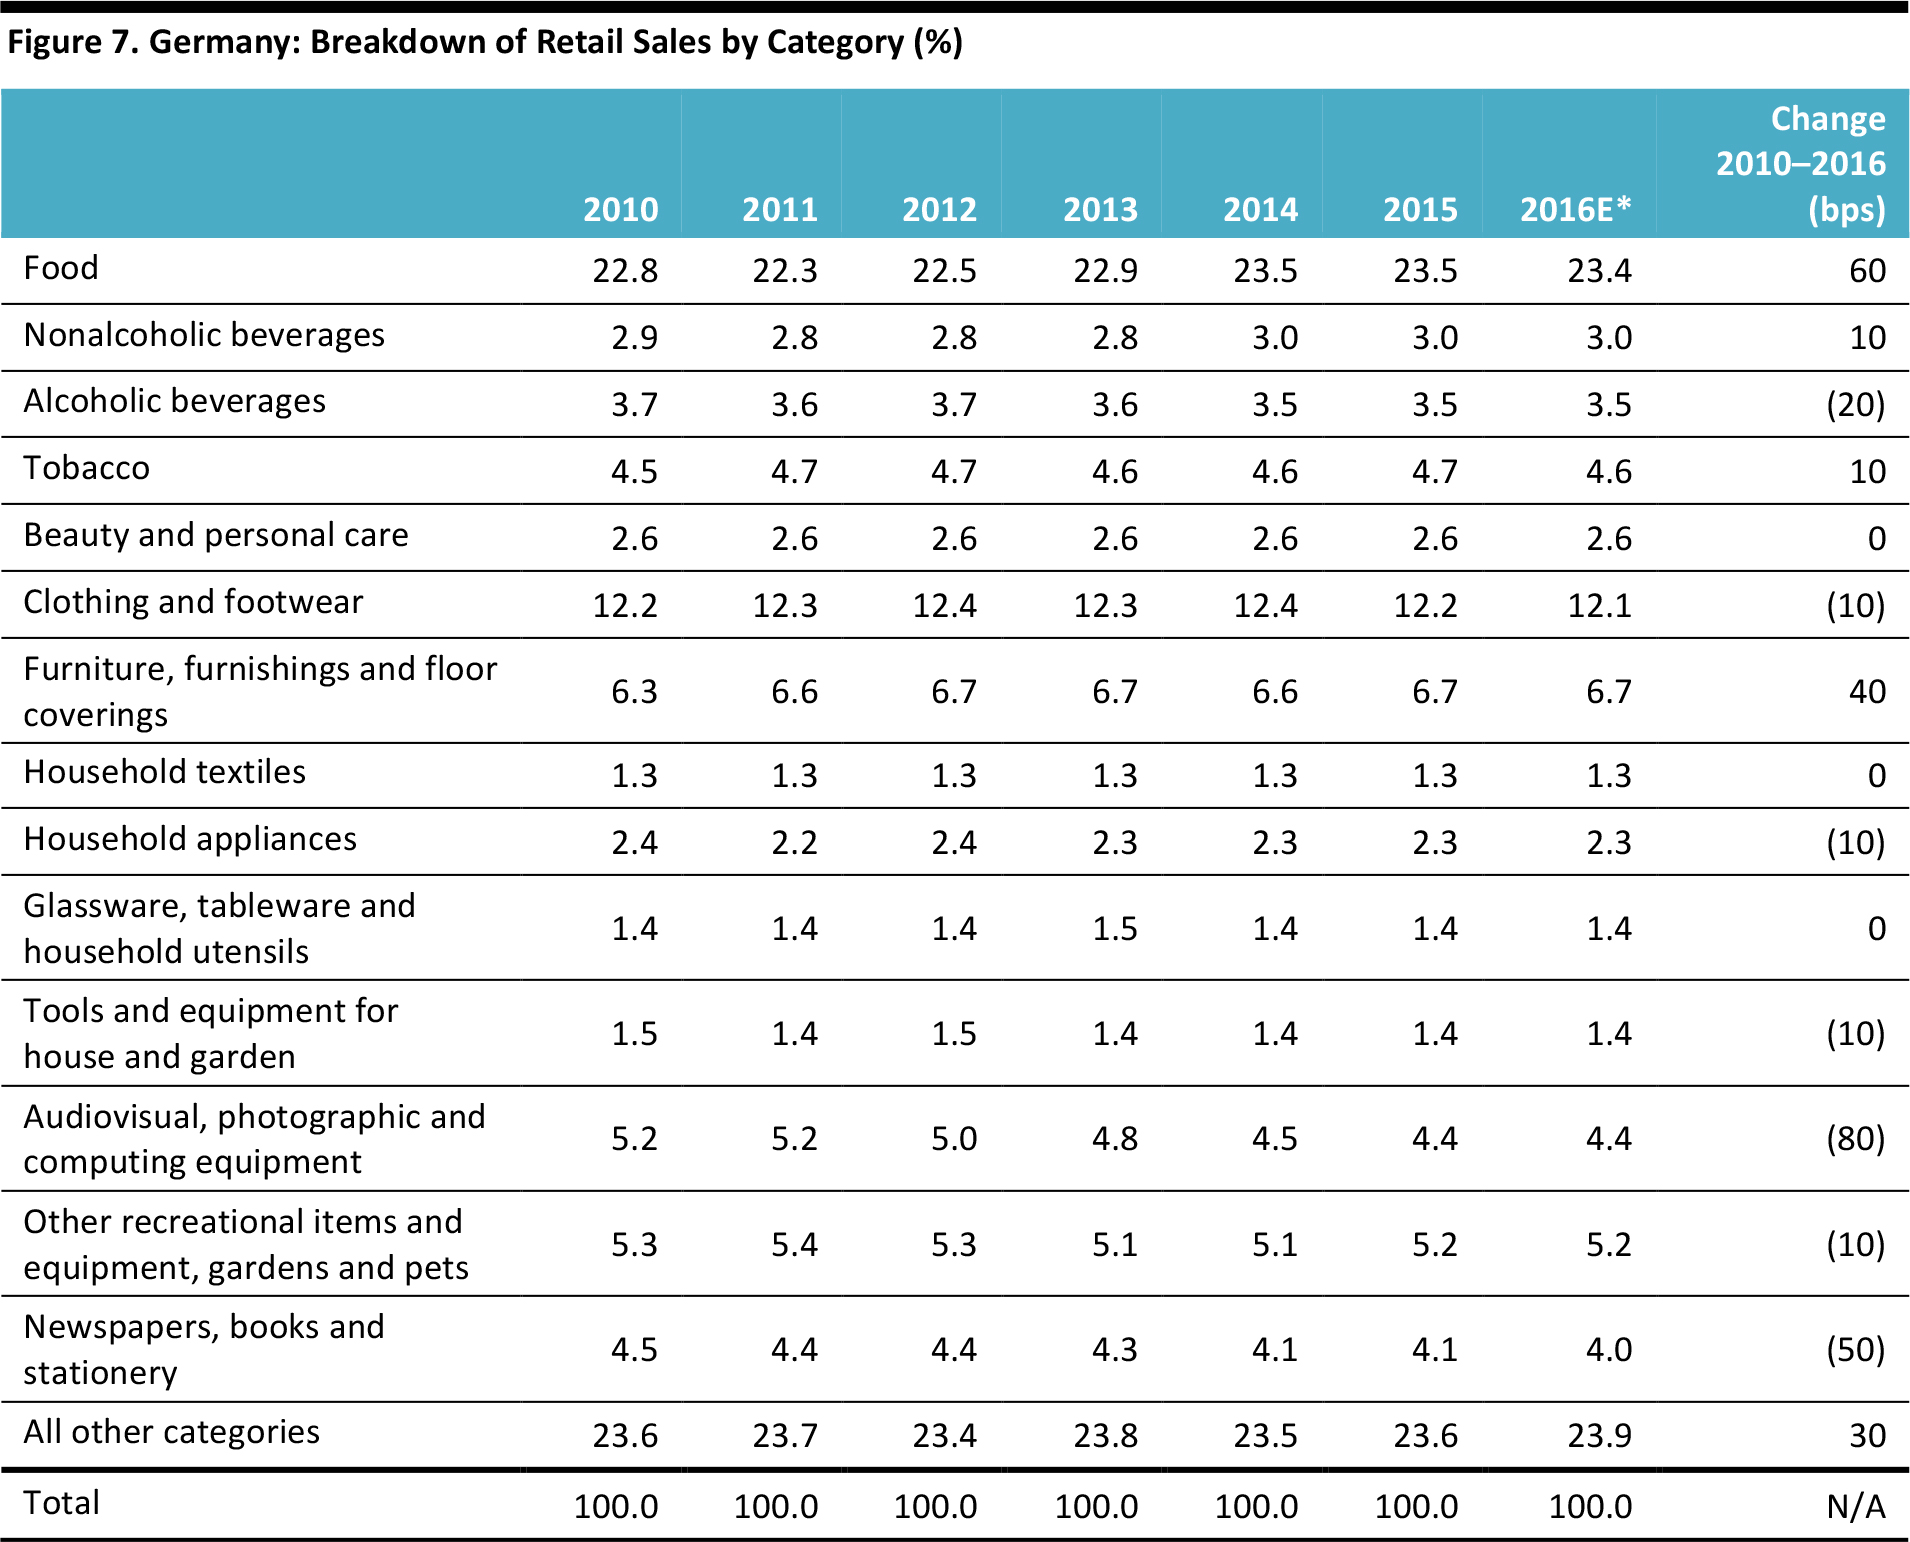
Totals may not sum due to rounding.
*2016 shares are estimated for all categories except beauty and personal care and clothing and footwear.
Source: Statistisches Bundesamt/Eurostat/Euromonitor International/Fung Global Retail & Technology
Our data for China is less granular still. The food, beverages and tobacco category continues to dominate the country’s retail sector. The growth of discretionary retail spending is reflected by the growing share accounted for by “all other categories.”
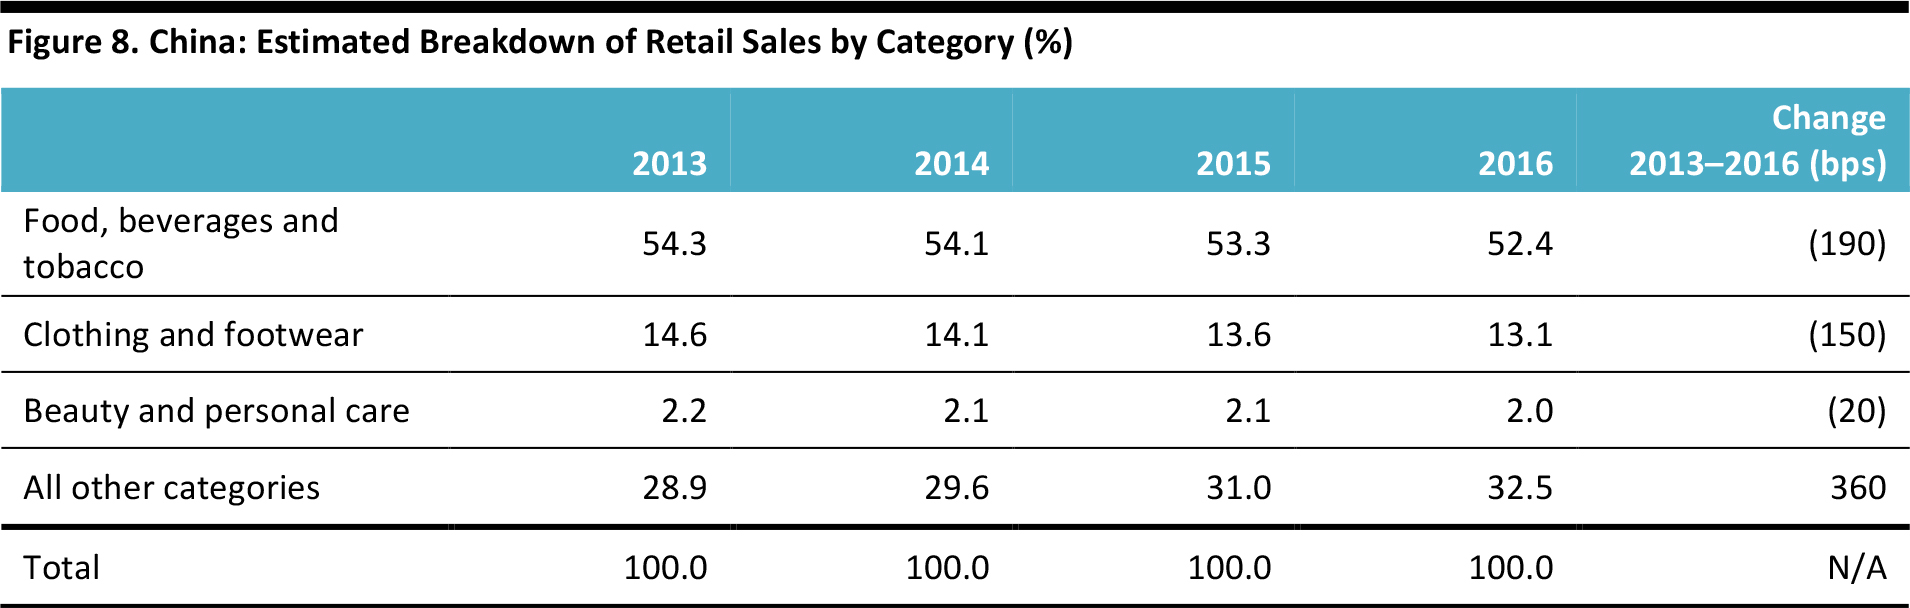
Totals may not sum due to rounding.
Source: National Bureau of Statistics of China/Euromonitor International/Fung Global Retail & Technology
Key Takeaways
- Shifts in consumer spending away from discretionary categories (such as food) and semidiscretionary categories (such as apparel) in favor of discretionary categories are typical in developing economies such as China.
- However, in recent years, we have seen similar trends in the US and the UK. In the US, the food and beverage category’s share of retail spending fell by 213 basis points between 2011 and 2016. In the UK, deflation prompted the category to cede 269 basis points of share between its 2013 peak and 2016.
- Meanwhile, our analysis of apparel spending suggests that weak demand in the category is not simply about consumers switching some of their spending to leisure services, such as vacations and dining out. The clothing and footwear category has seen relative declines in the US even when measured only against retail sales.