Introduction
Few retailers are talked about as much as Amazon—and not just by commentators and analysts, but also by shoppers and journalists. At Fung Global Retail & Technology, we cover this company frequently and in depth.
For this report, we have mined company filings, research databases, consumer surveys and press reports, and we have included our own calculations and estimates in order to present 20 charts that we hope will deepen readers’ understanding of Amazon.
The themes discussed here range from forecast sales and margins through 2022, to average per-capita spend on Amazon by country, to Amazon’s popularity in the womenswear and menswear categories. There are three significant themes that we explore:
- The strengthening of company operating margins from the contribution of Amazon Web Services.
- The growing share of total sales made by third-party sellers on Amazon, which can be presumed to yield higher margins for Amazon than direct retailing.
- The growth in Amazon Prime and the fact that almost half of US consumers now say they have a Prime membership.
We provide links to further relevant reports from our global team of analysts at the end of this report.
Source: amazon.com
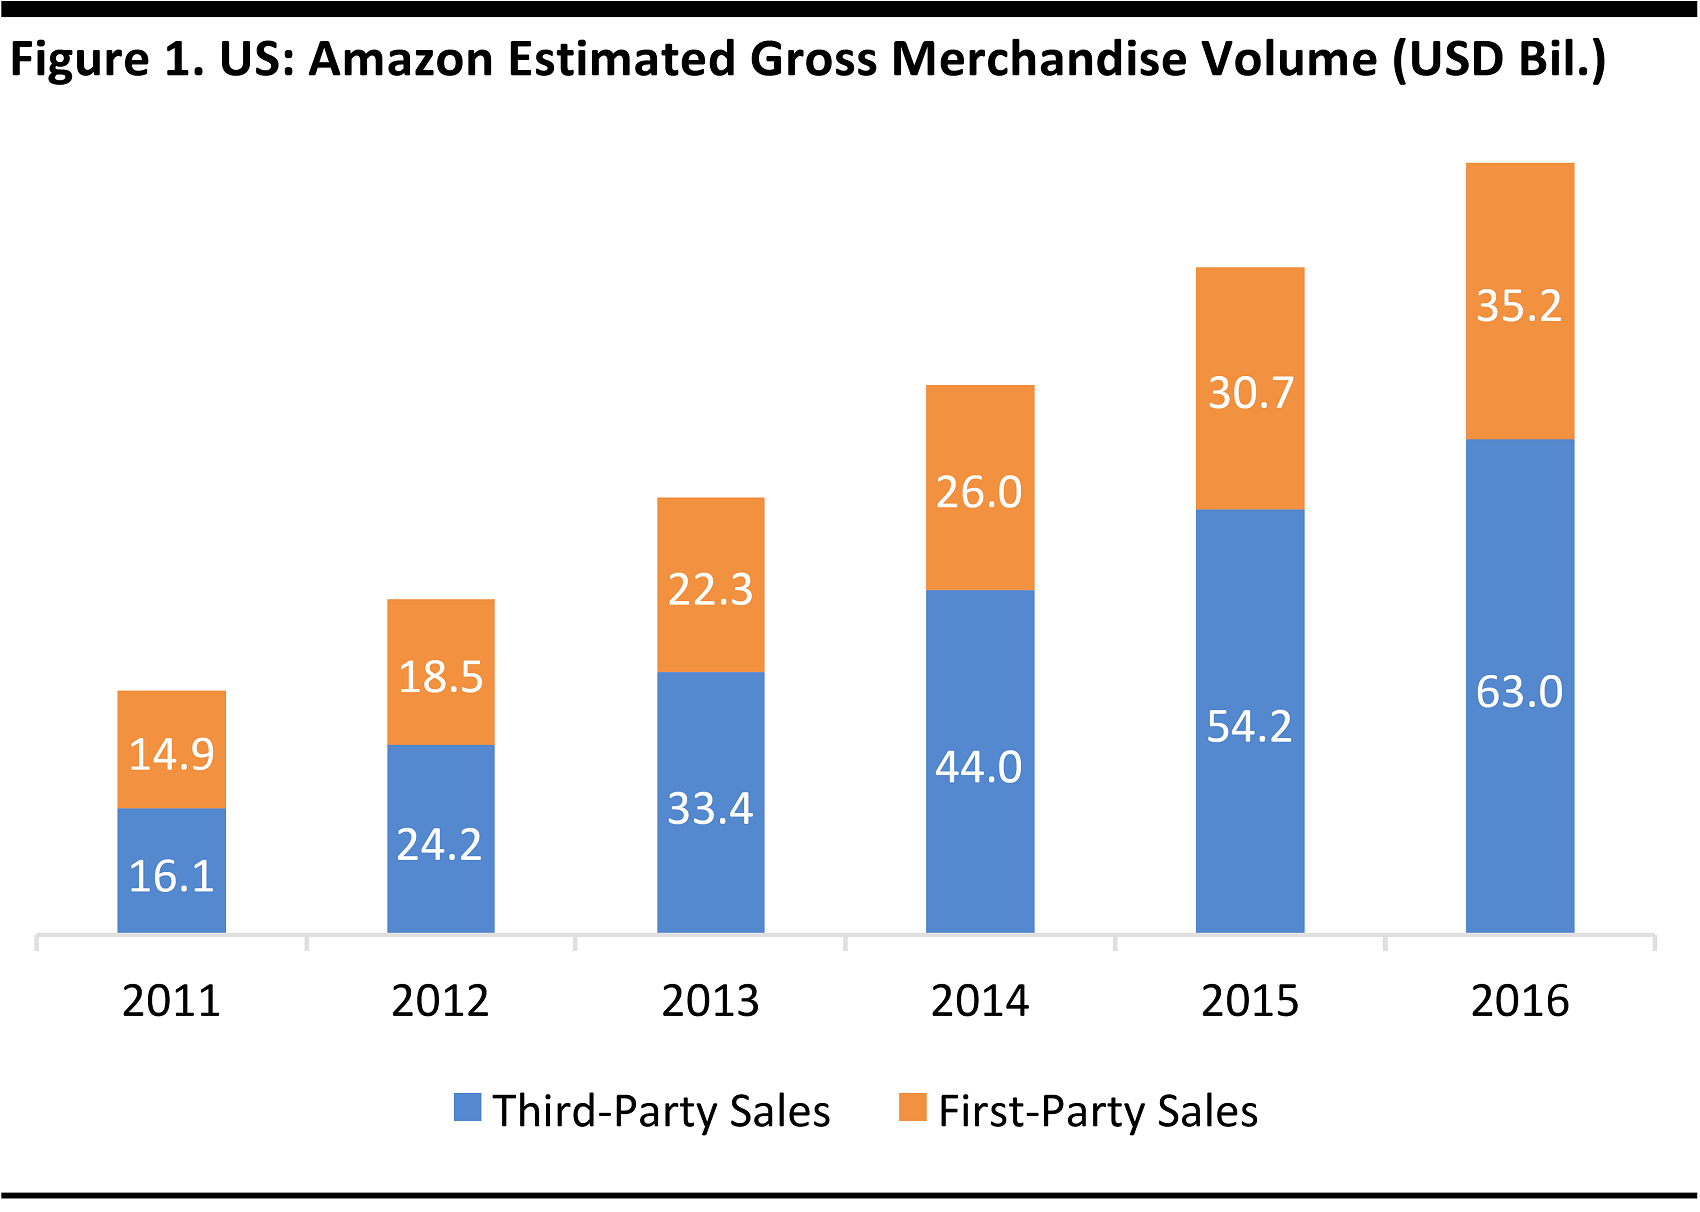
Third-party sales are those made by sellers on Amazon; first-party sales are those made by Amazon itself.
Source: Euromonitor International
We begin with the basics: how much Amazon sells in its core market of the US. Charted above are the estimated values of goods sold on Amazon in the US. Amazon sold $98 billion worth of goods in the US in 2016, according to Euromonitor International estimates. Only $35 billion of those retail sales were made by Amazon itself, with $63 billion made by third-party sellers on Amazon’s platforms.
Amazon declared total worldwide revenues of $136 billion in 2016, and some $90 billion of that came from the US. But these revenues tell only part of the story because so many of the sales transacted on Amazon are made by third-party sellers, for which Amazon books only commission. Moreover, Amazon’s stated revenues include its Amazon Web Services cloud-computing business.
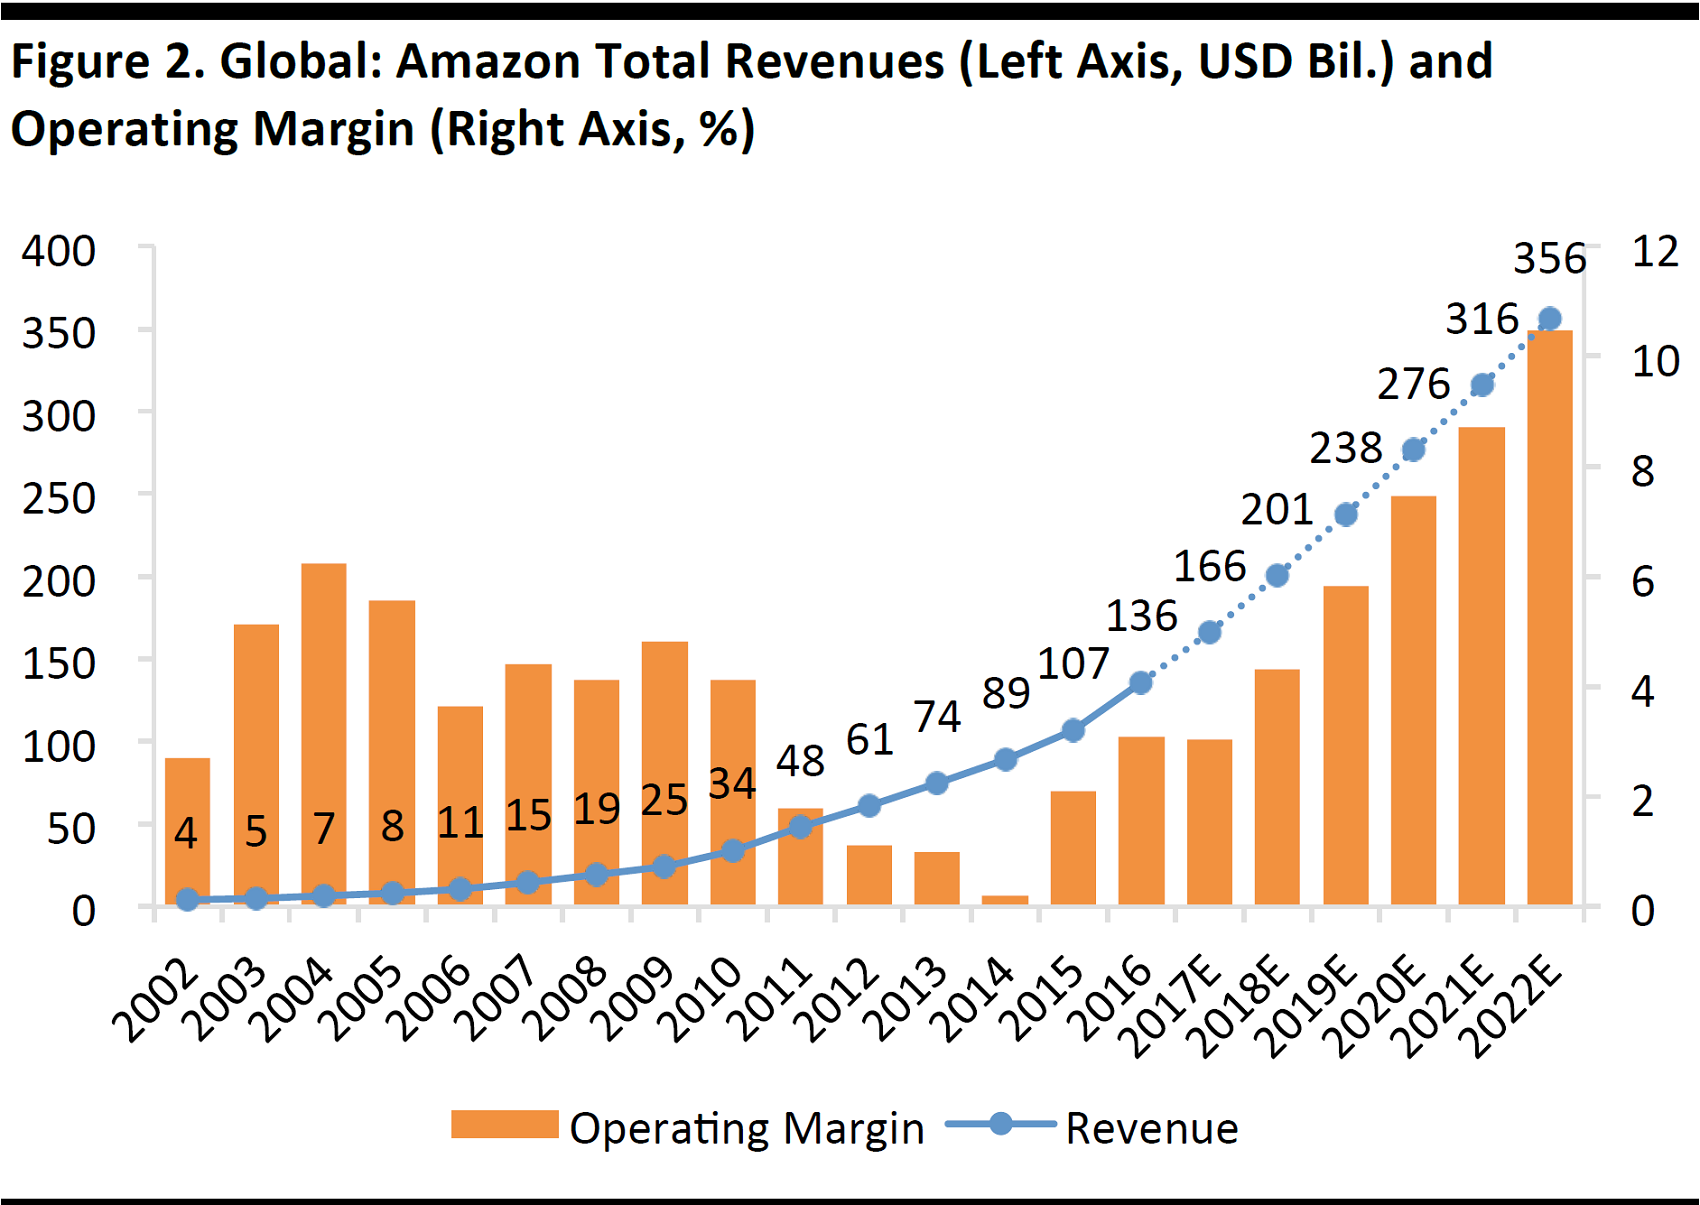
Actual data through 2016; consensus estimates for 2017–2022 as of May 15, 2017
Source: S&P Capital IQ
Amazon grew total worldwide revenues by 27% in 2016. The consensus among analysts is that Amazon will grow total worldwide revenues by 22% in 2017. Consensus calls for revenues to grow at a compound annual growth rate (CAGR) of 16.5% thereafter through 2022, which would bring revenues to $356 billion.
The consensus expectation is that operating profit growth will under pace revenue growth this year, leading to a slight fallback in margins. However, after 2017, analysts expect strong and consistent operating profit growth that would take margins to over 10% by 2022.
As we show in the next chart, the growth of Amazon Web Services is bolstering margins.
Source: S&P Capital IQ/Fung Global Retail & Technology
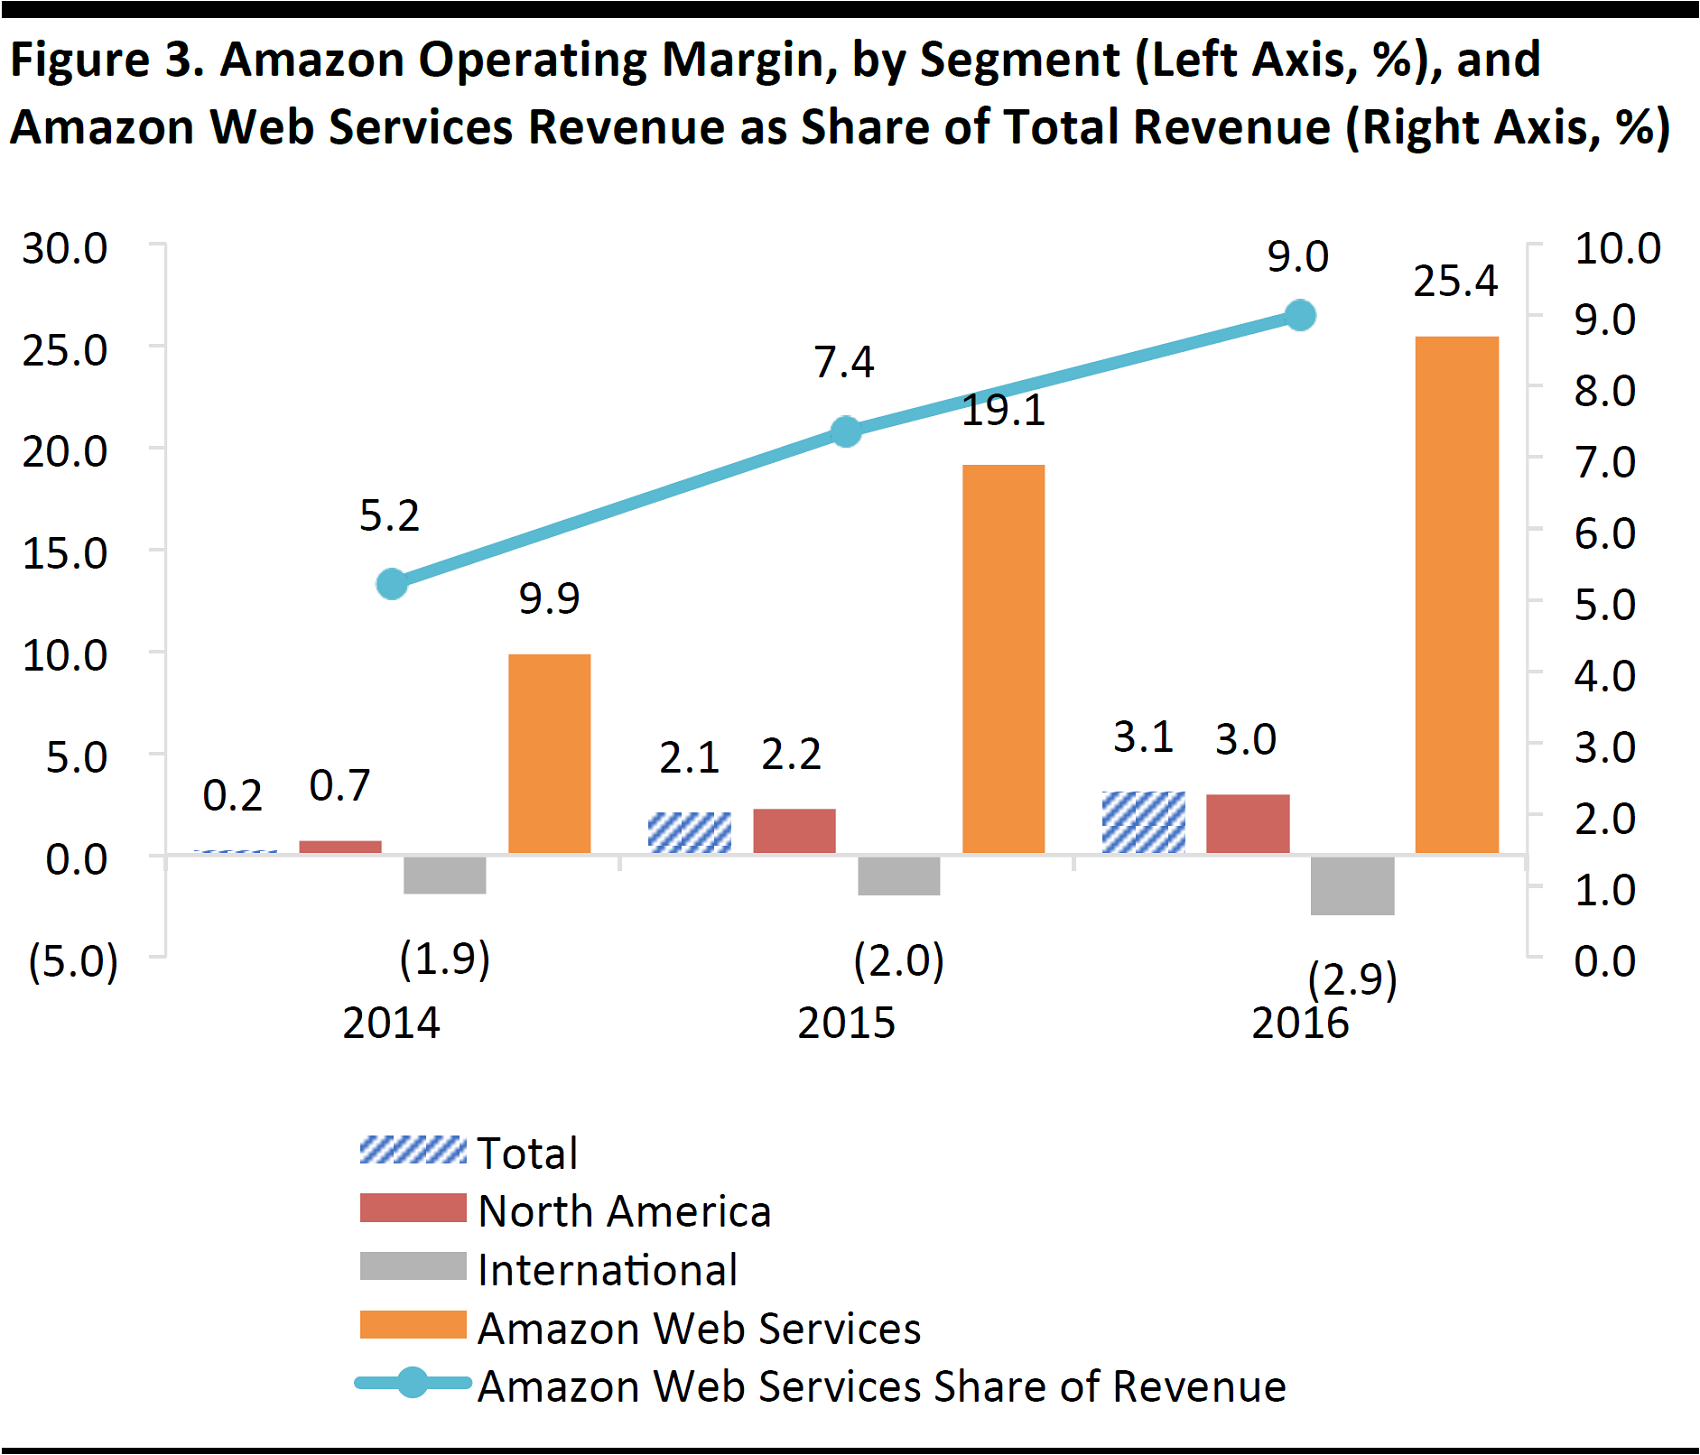
Amazon’s newly cemented profitability is being driven by Amazon Web Services, whose operating margins far exceed those of the remainder of Amazon’s business (i.e., the sale of products). In 2016, Amazon Web Services generated a 25% operating margin, though that was diluted at the group level becauseAmazon Web Services contributed just 9% of total revenue. The segment is expected to continue growing its share of total revenue, so its contribution to group margins will also continue to grow.
Losses in Amazon’s international segment have deepened, and the company’s planned move into Australia and investments in India make the prospects of a shift to profitability in that segment remote in the near term.
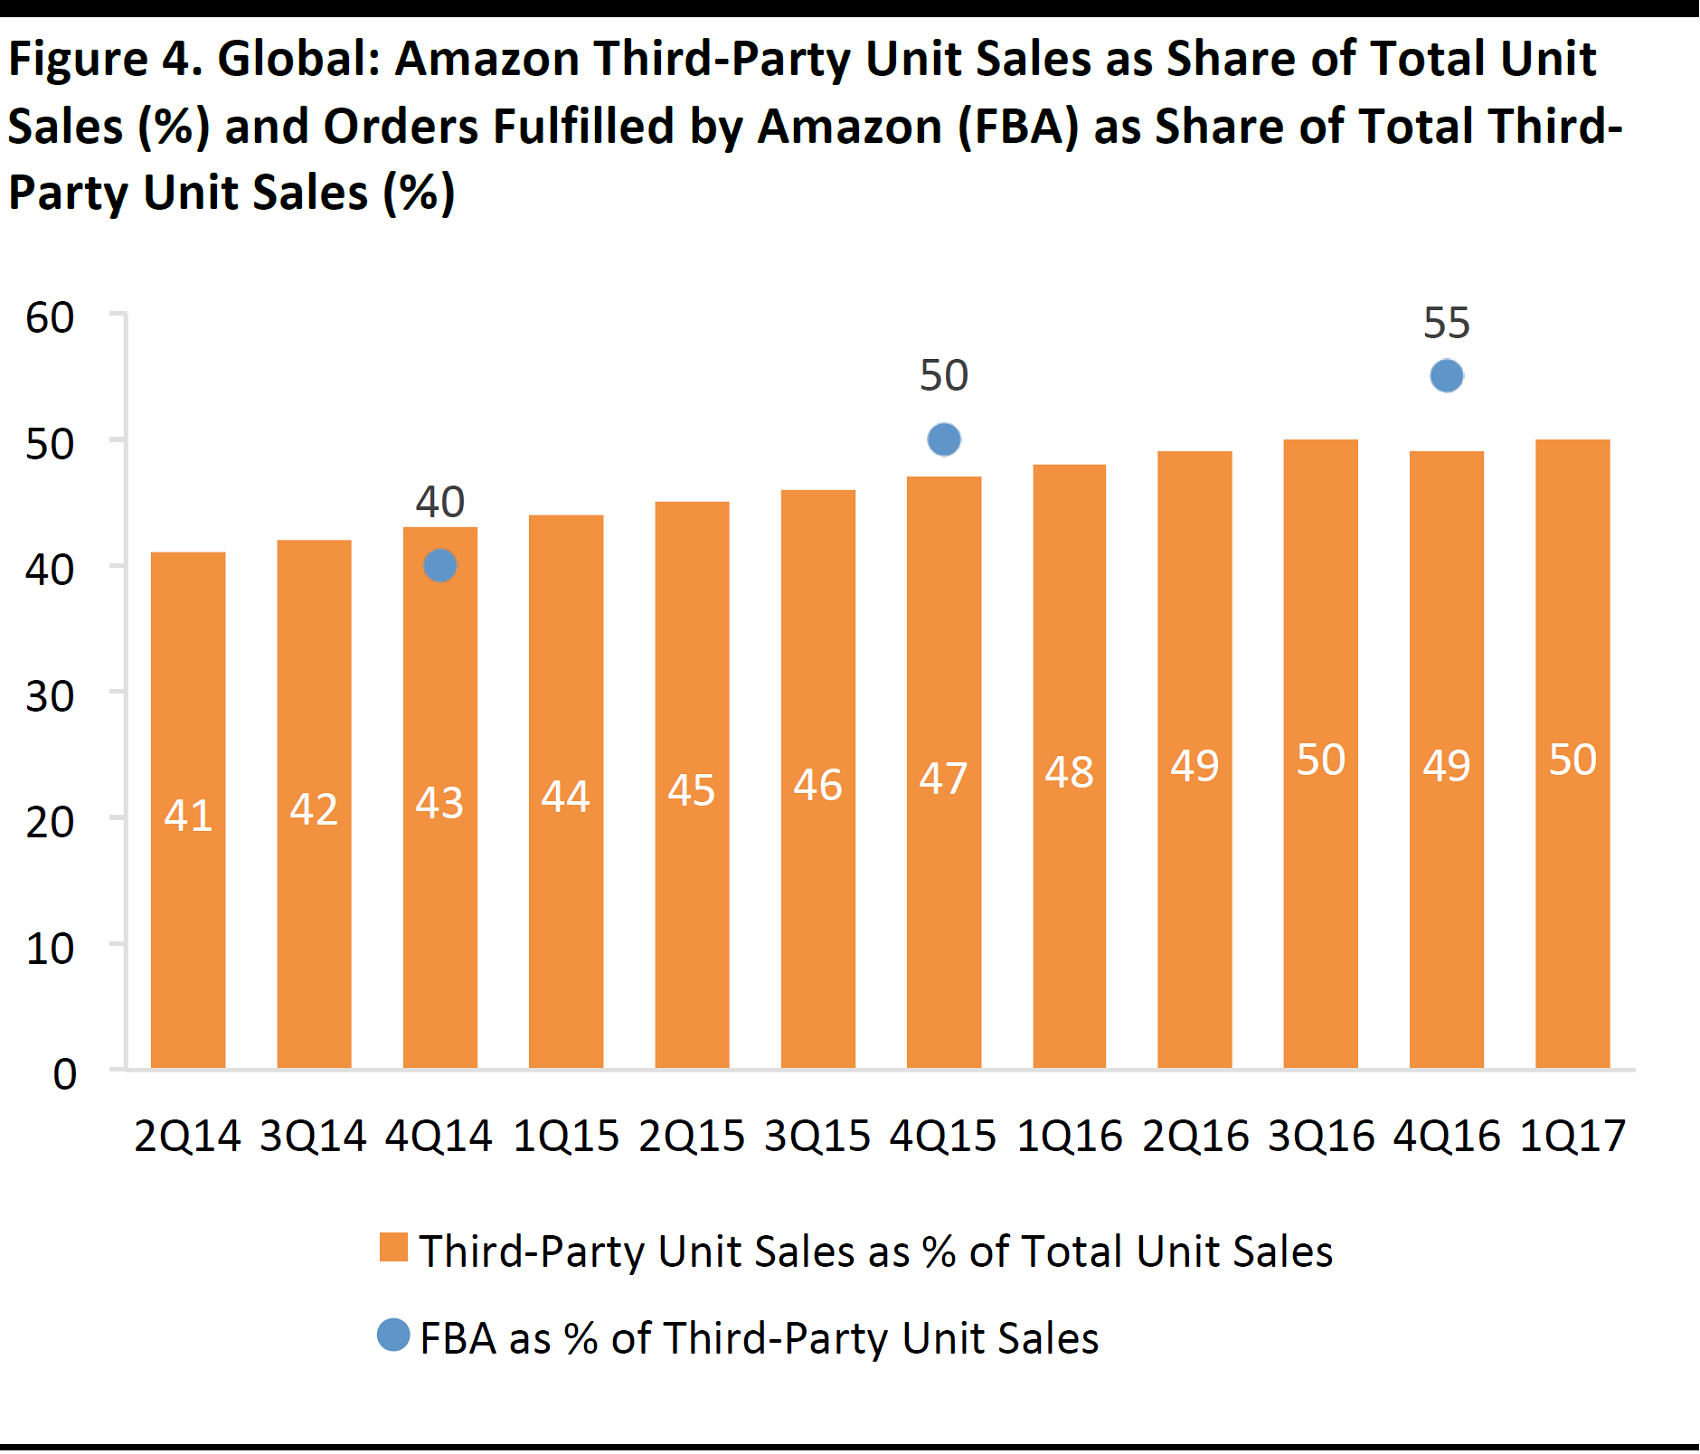
Units refer to physical and digital units sold on Amazon sites worldwide. FBA share of third-party unit sales is disclosed only in the fourth quarter of each year and is approximate (e.g., it was “more than 55%” in 4Q16).
Source: Company reports
Amazon’s profitability is almost certainly being supported also by the greater share of sales accounted for by third-party sellers—although Amazon does not break out profits by first-party and third-party sales. For third-party sales, Amazon takes a commission, typically around 15% of the selling price, in exchange for little more than advertising the product on its site.
Moreover, a majority of third-party sales are now fulfilled by Amazon, which means that Amazon stores and dispatches inventory on behalf of those sellers, thereby generating further incremental fees for itself.
Source: Euromonitor International/Fung Global Retail & Technology
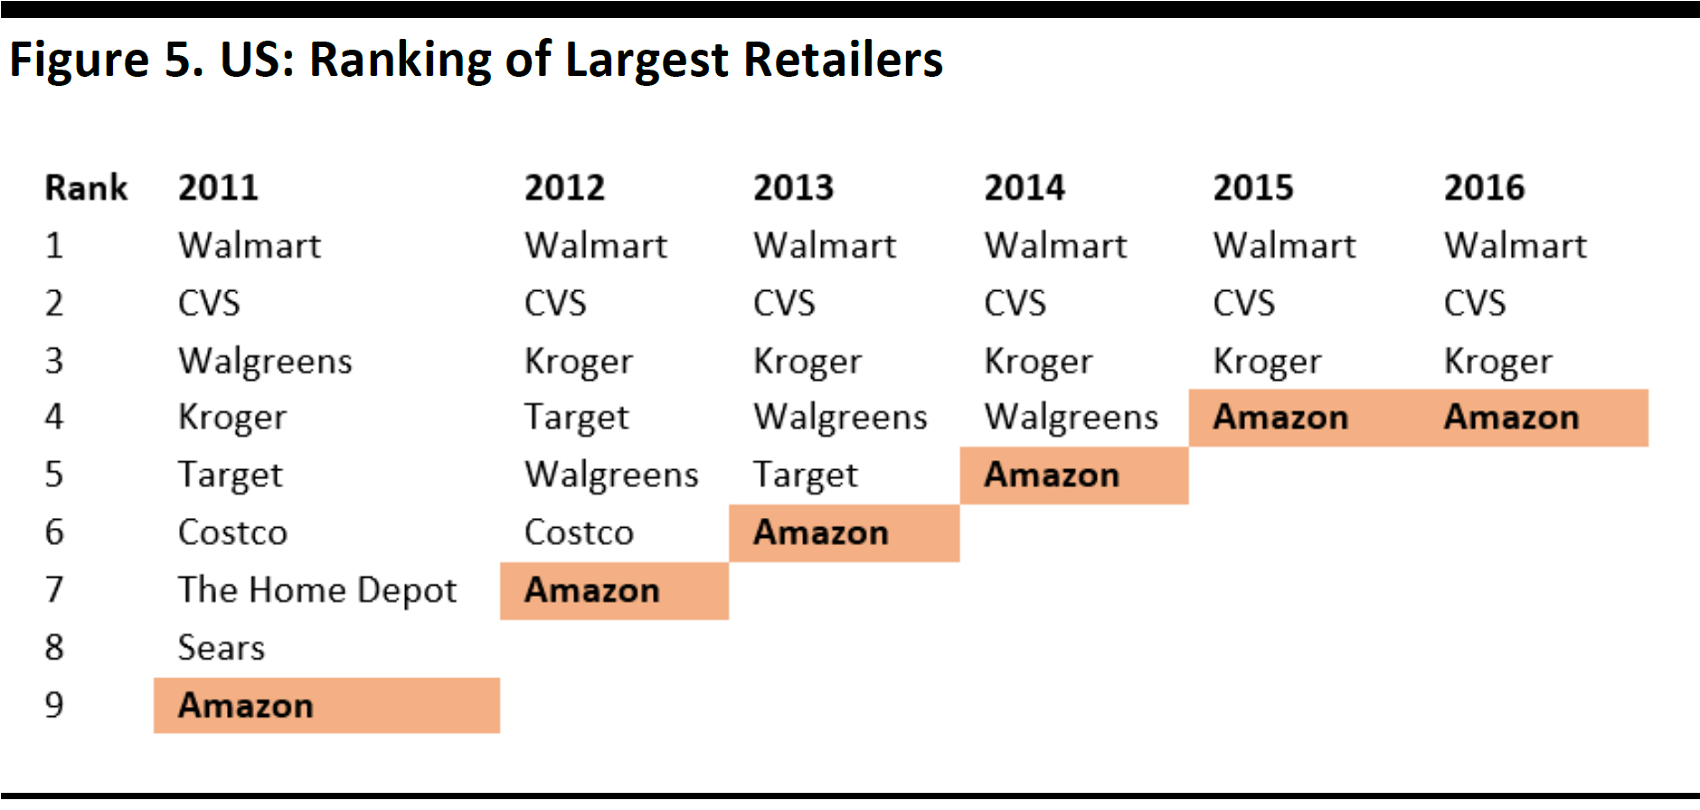
Amazon was America’s fourth-largest retailer, online or offline, last year. It has steadily climbed the market share rankings, though it stayed at number four between 2015 and 2016.
In 2016, Amazon’s total estimated US sales were $98 billion, compared with total revenues of $115 billion at Kroger, $177.5 billion at CVS and $308 billion at Walmart US (excluding Sam’s Club).
According to Euromonitor, Amazon captured 3.4% of all US retail sales in 2016.
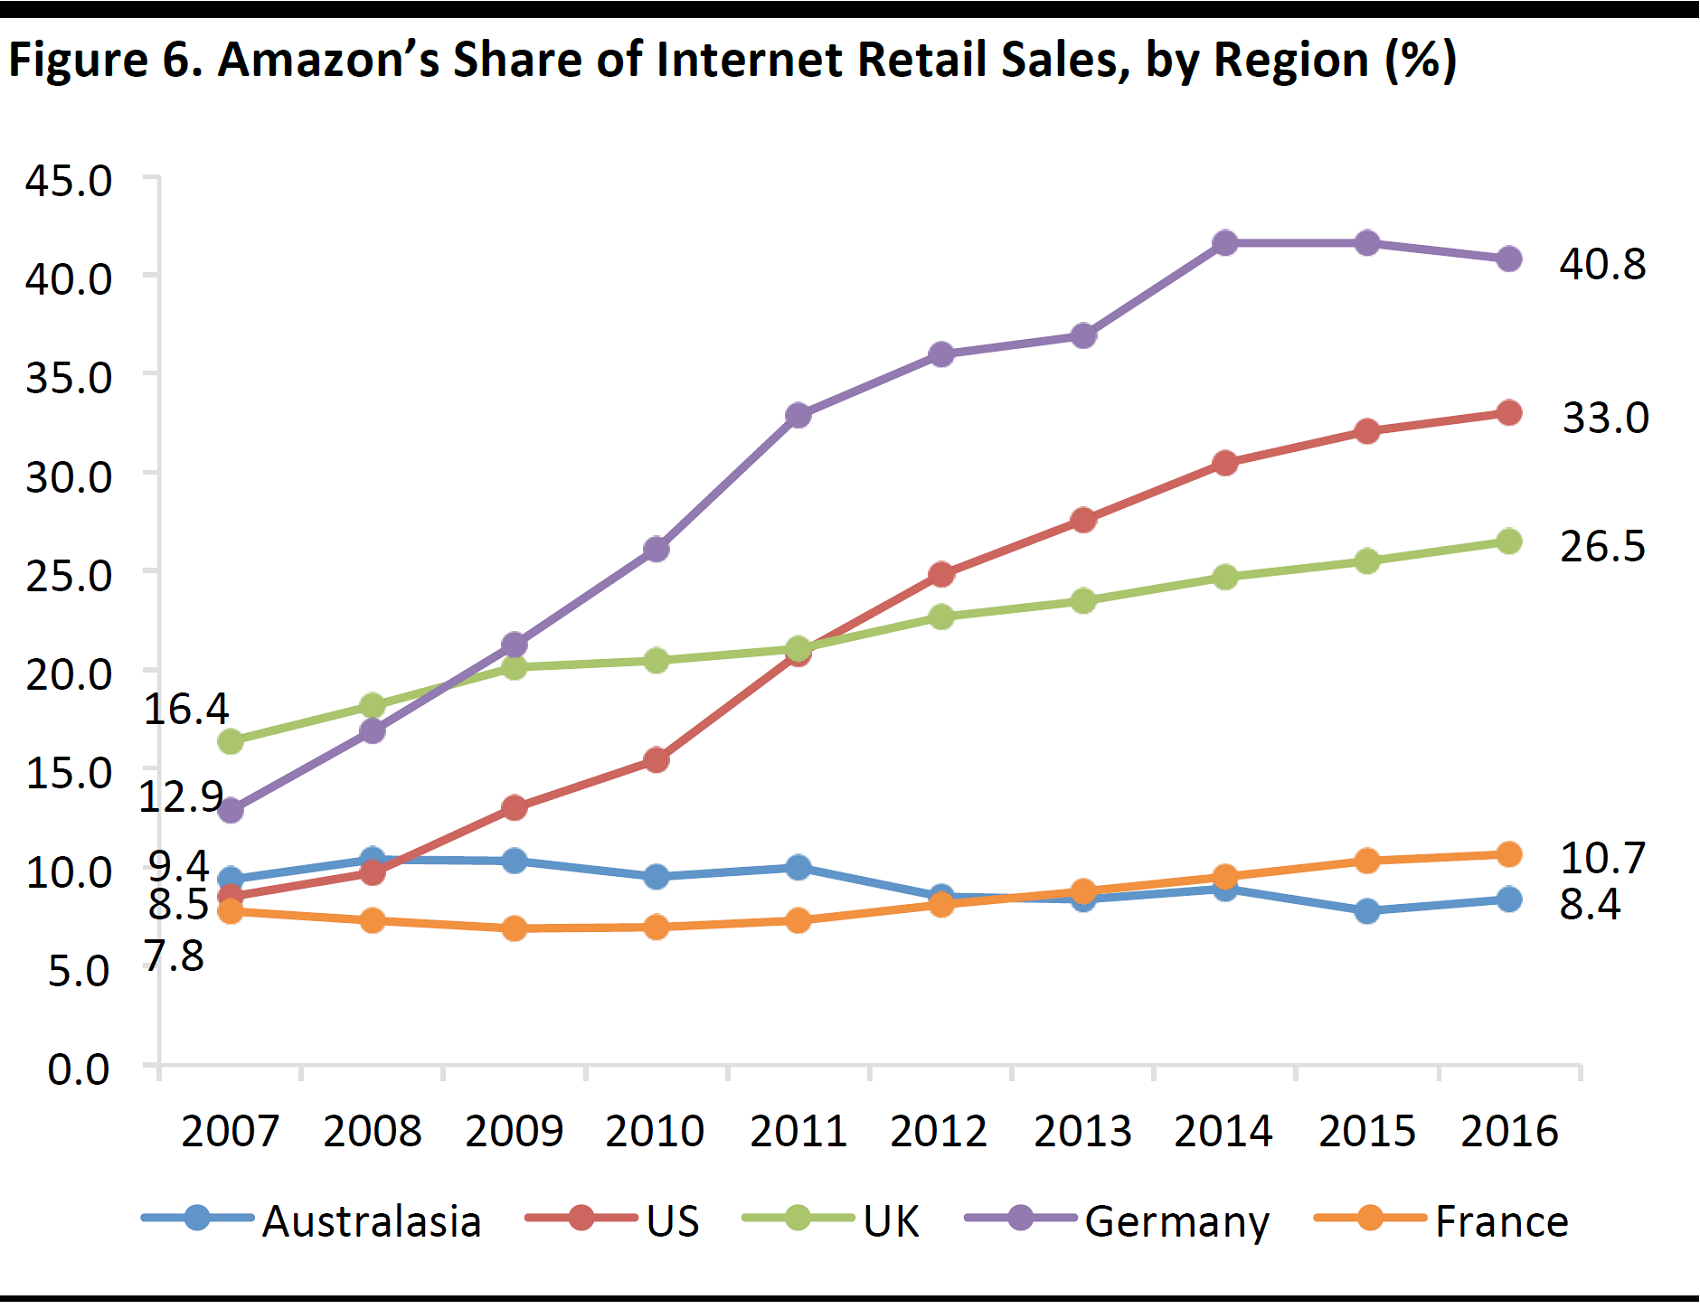
Includes sales by third-party sellers on Amazon. Australasia is the sum of Australia and New Zealand.
Source: Euromonitor International
Amazon enjoyed a 33% share of US Internet retail sales in 2016, including sales made by third-party sellers.
In markets where there has been a considerable appetite for online shopping—notably the US and Germany—Amazon’s share of online sales has grown considerably. The drive to get more third-party sellers onto Amazon’s platform has helped underpin growth in these markets.
Source: S&P Capital IQ/Fung Global Retail & Technology
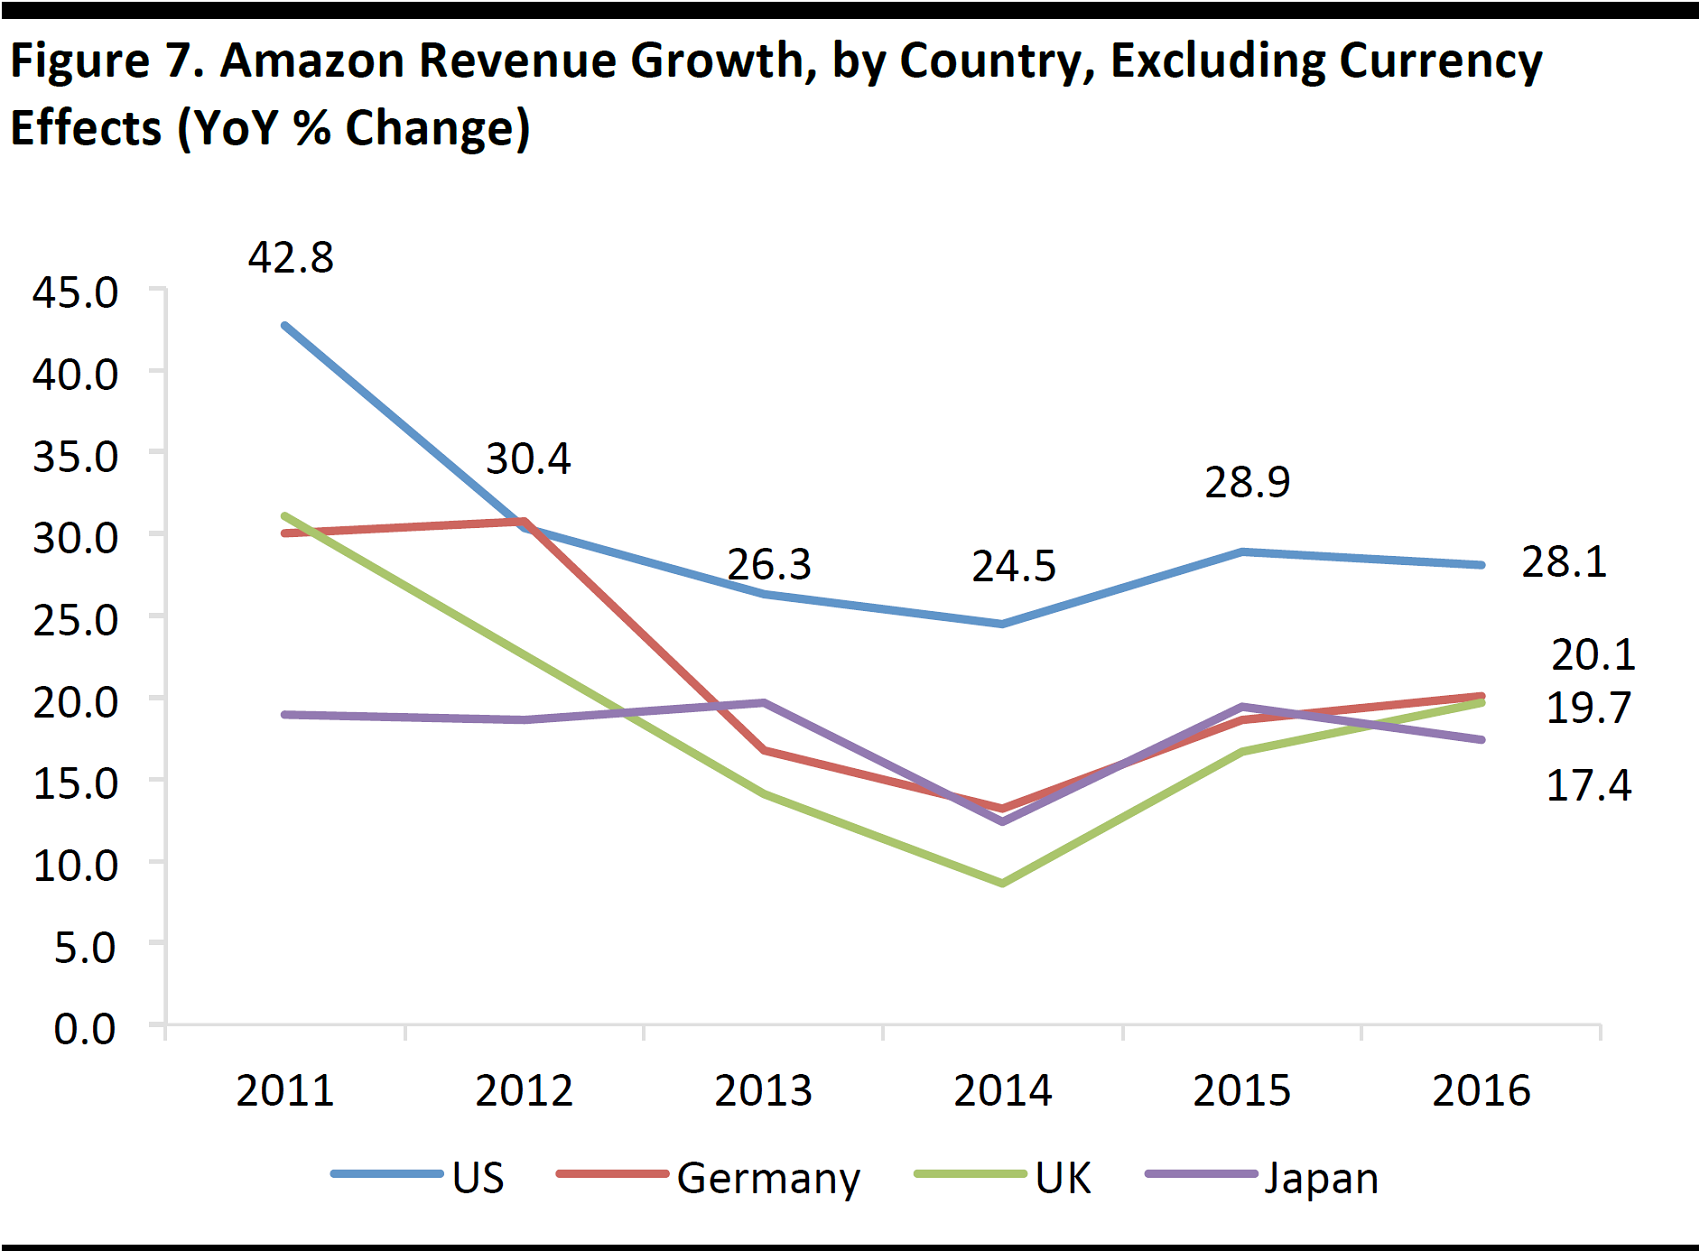
The US contributed two-thirds of all Amazon revenue in 2016, and the country has been the company’s fastest-growing stated regional segment. US revenues were up 28% year over year in 2016.
Germany contributed 10% of Amazon revenue last year, and revenue in the country grew by 20%. The UK contributed 7% of revenue, and revenue in the country grew at a similar rate to Germany.
Japan and the Rest of the World segment each contributed 8% of revenue in 2016. (Totals do not sum to 100% due to rounding.)
The revenue growth rates above are shown in the respective national currencies in order to strip out currency effects.
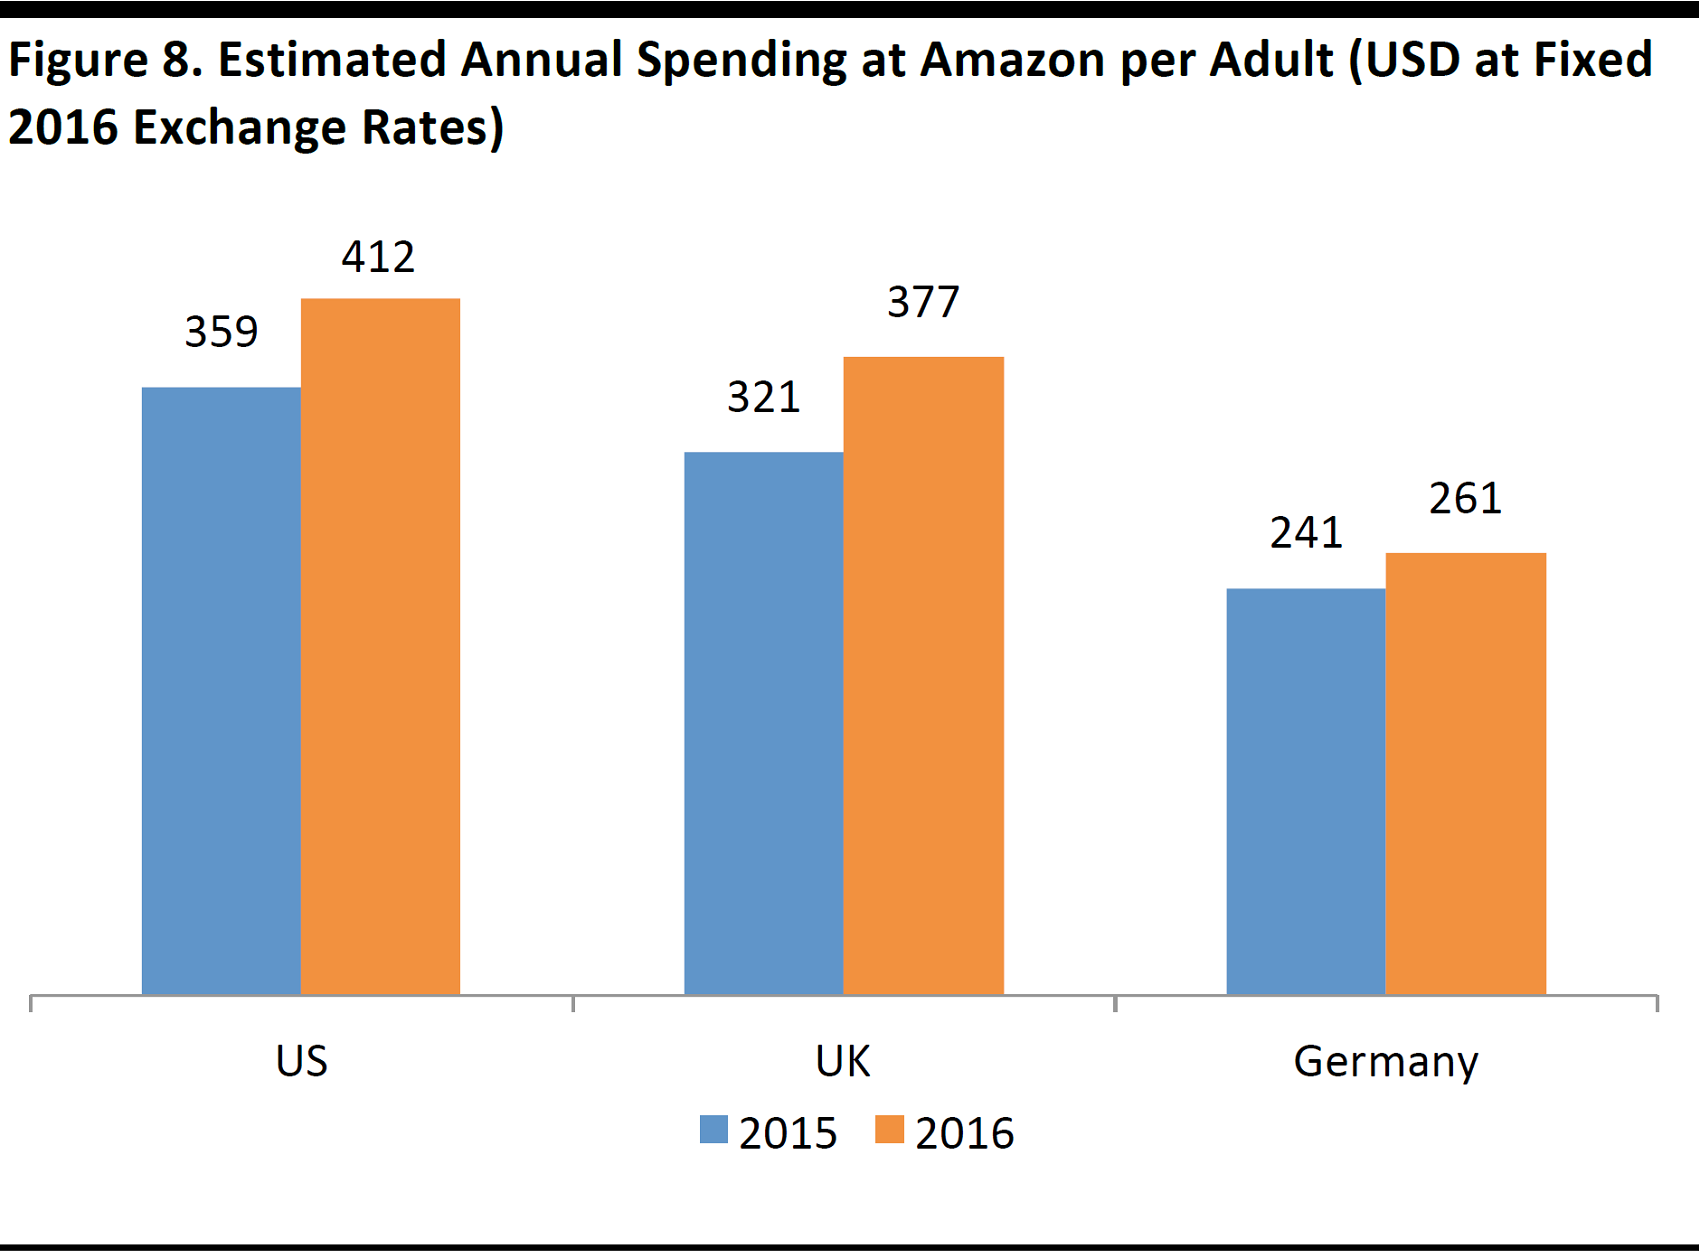
Based on total sales made through Amazon’s respective national websites, including sales by third-party sellers. Calculated based on population data for those 18+.
Source: Euromonitor International/US Census Bureau/Eurostat/Fung Global Retail & Technology
Based on estimated total sales, including sales by third-party sellers, we calculate that each US adult spent an average of just over $412 on Amazon in 2016. Spending by UK adults was not far behind.
The spending data above are shown in terms of fixed 2016 exchange rates in order to strip out currency effects.
The Amazon Customer
In this section, we showcase US consumer survey data from our research partner Prosper Insights & Analytics.
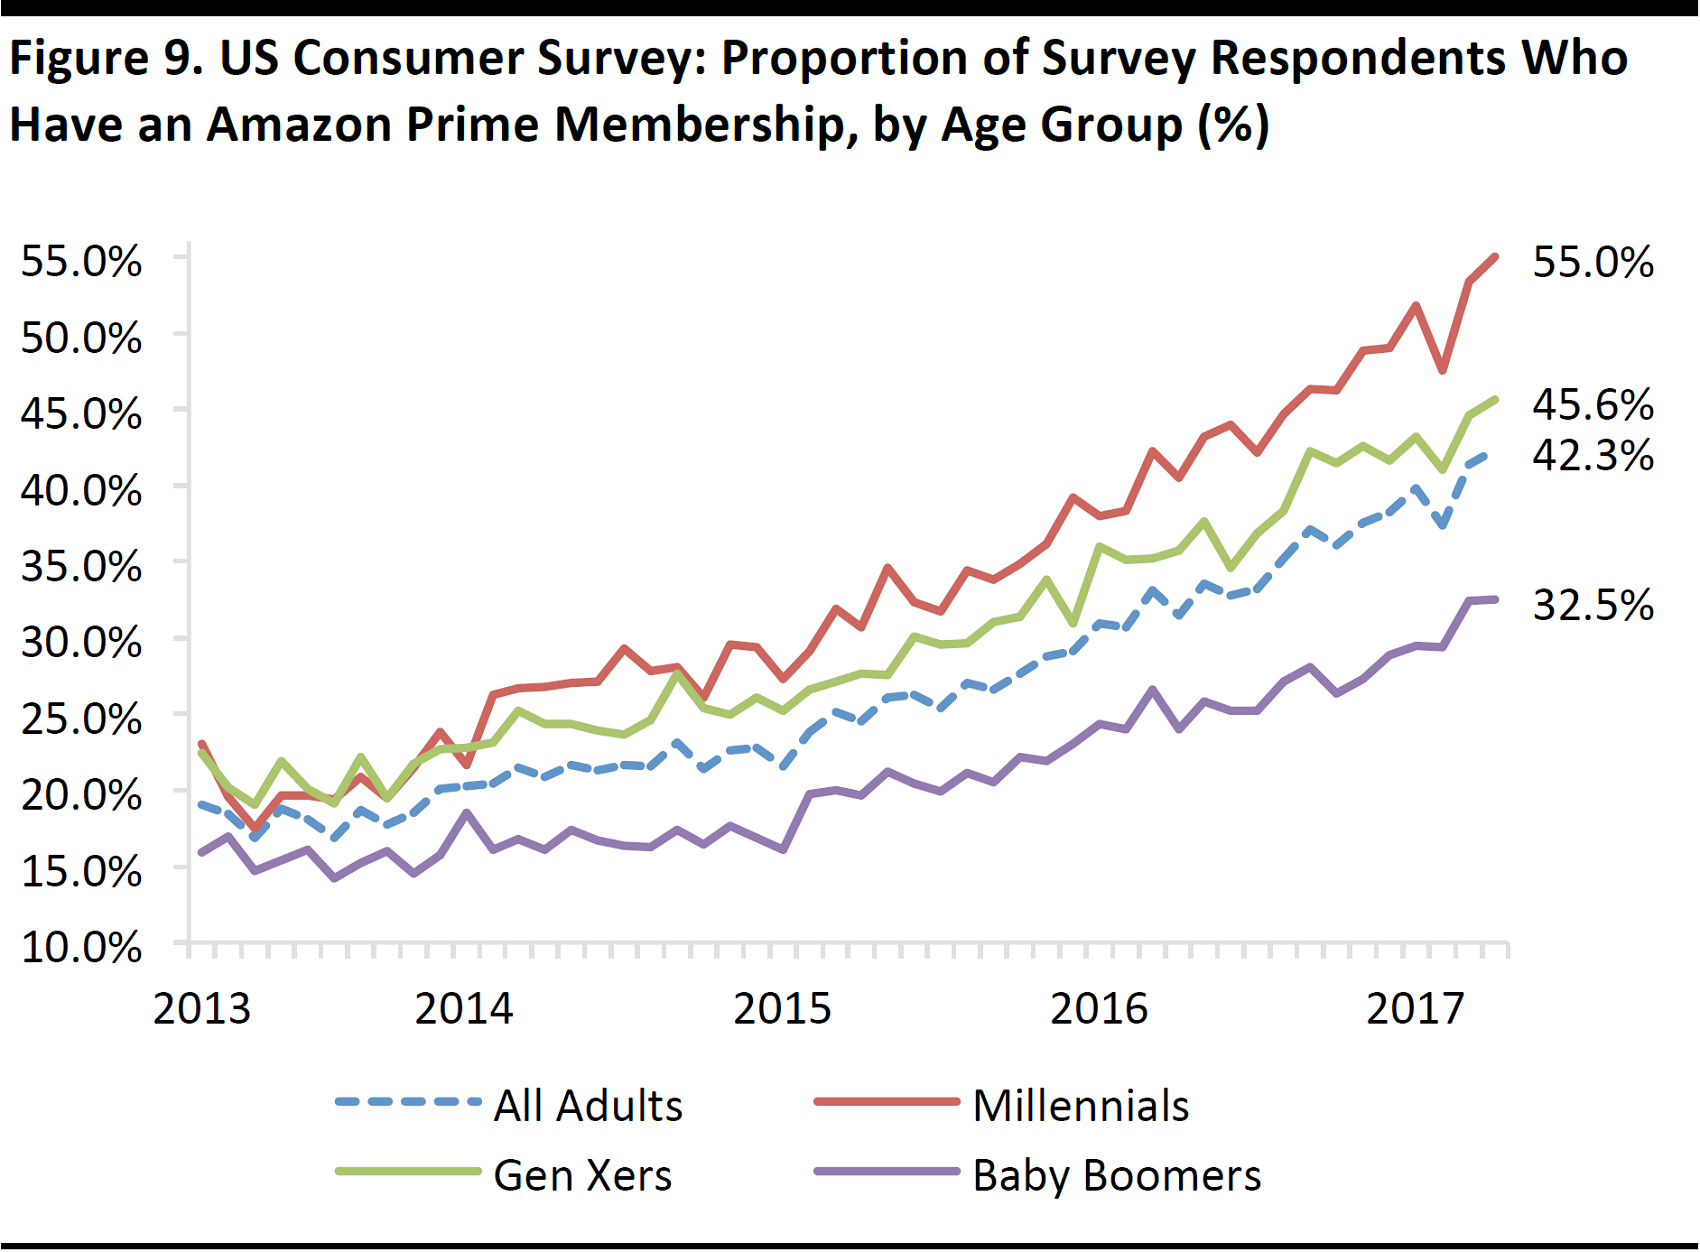
Surveys conducted March 2013 to April 2017
Base: Between 4,912 and 7,609 adults ages 18+ in each three-month period
Source: Prosper Insights & Analytics
Prime has been a driving force in Amazon’s growth. US penetration rates of Prime more than doubled, to 42%, in the four years ended April 2017. Millennials (those born between 1983 and 1998, by Prosper’s definition) are more likely than those in older age groups to have a Prime membership.
The data charted above show the proportion of survey respondents who answered yes when asked, “Do you have an Amazon Prime membership?” The wording is significant because larger proportions than those charted are likely to have
access to Prime delivery benefits through a Prime membership held by someone else in their household.
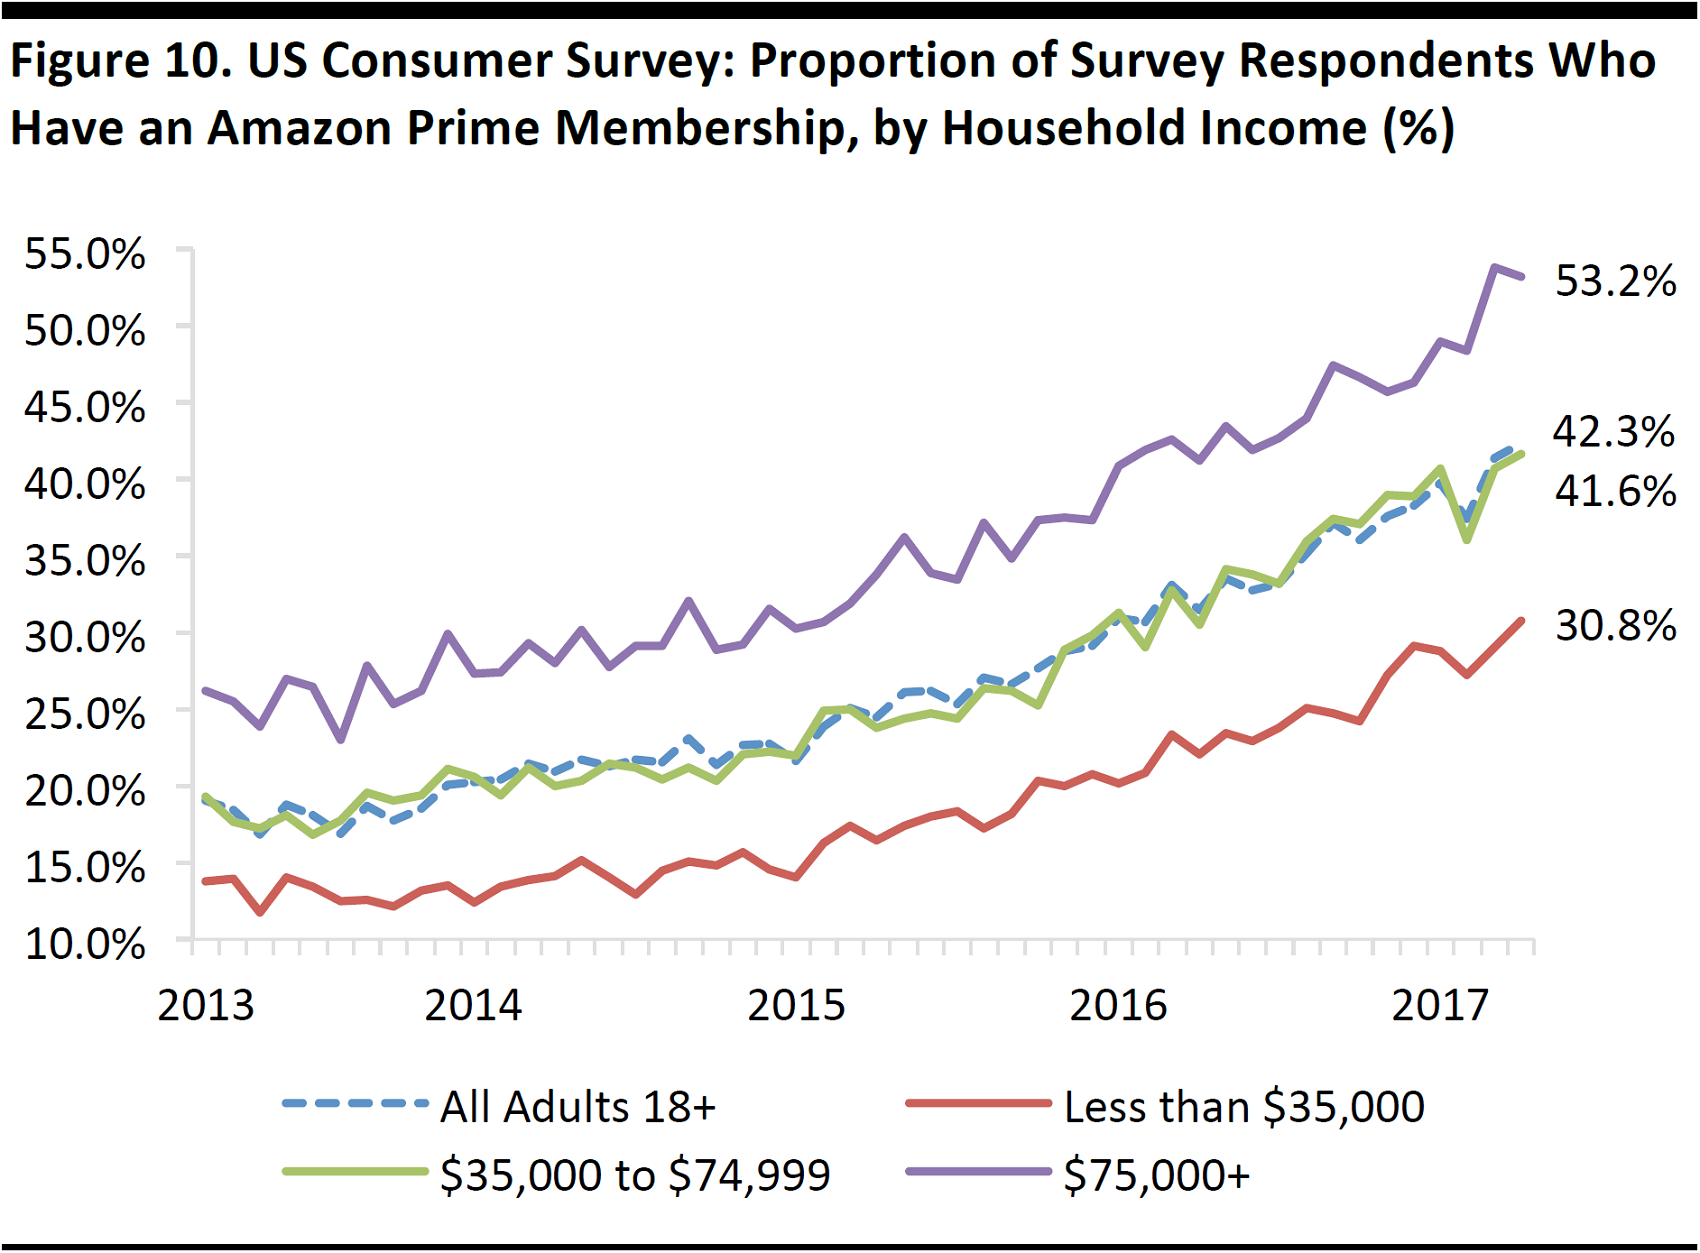
Surveys conducted March 2013 to April 2017
Base: Between 4,912 and 7,609 adults ages 18+ in each three-month period
Source: Prosper Insights & Analytics
In the US, more-affluent households are more likely to have Prime memberships. As the graph above shows, growth of Prime membership among those with incomes in the $35,000–$74,999 range tracks growth among typical Prime customers very closely.
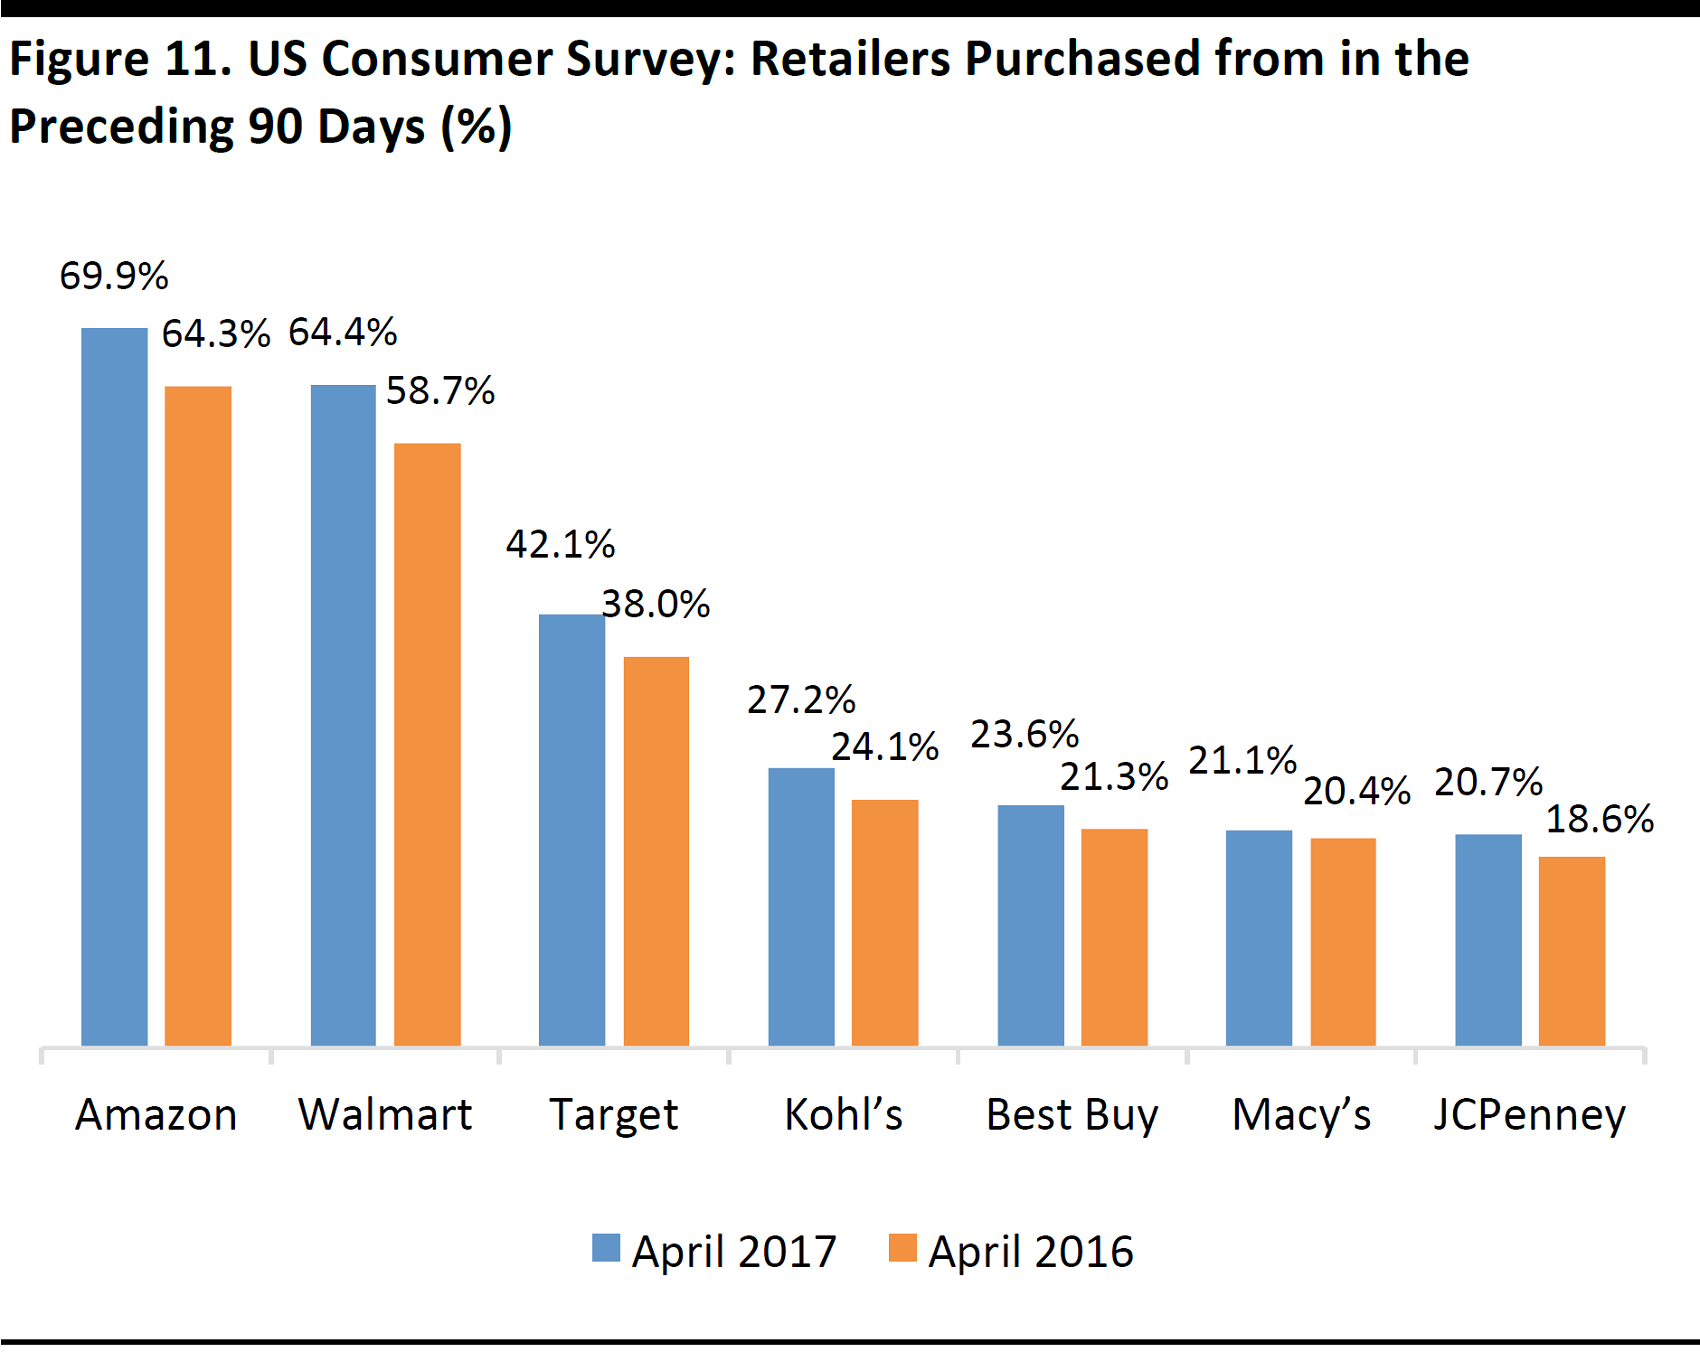
Base: 7,008 (2016) and 7,406 (2017) adults aged 18+
Source: Prosper Insights & Analytics
Measured by shopper numbers, Amazon is the most popular retailer in the US—even if it is not yet number one by market share. An April 2017 Prosper survey of US adult consumers found that almost 70% of those polled had purchased from Amazon in the previous 90-day period. This was around five percentage points higher than the share of that said they had purchased from Walmart over the same period.
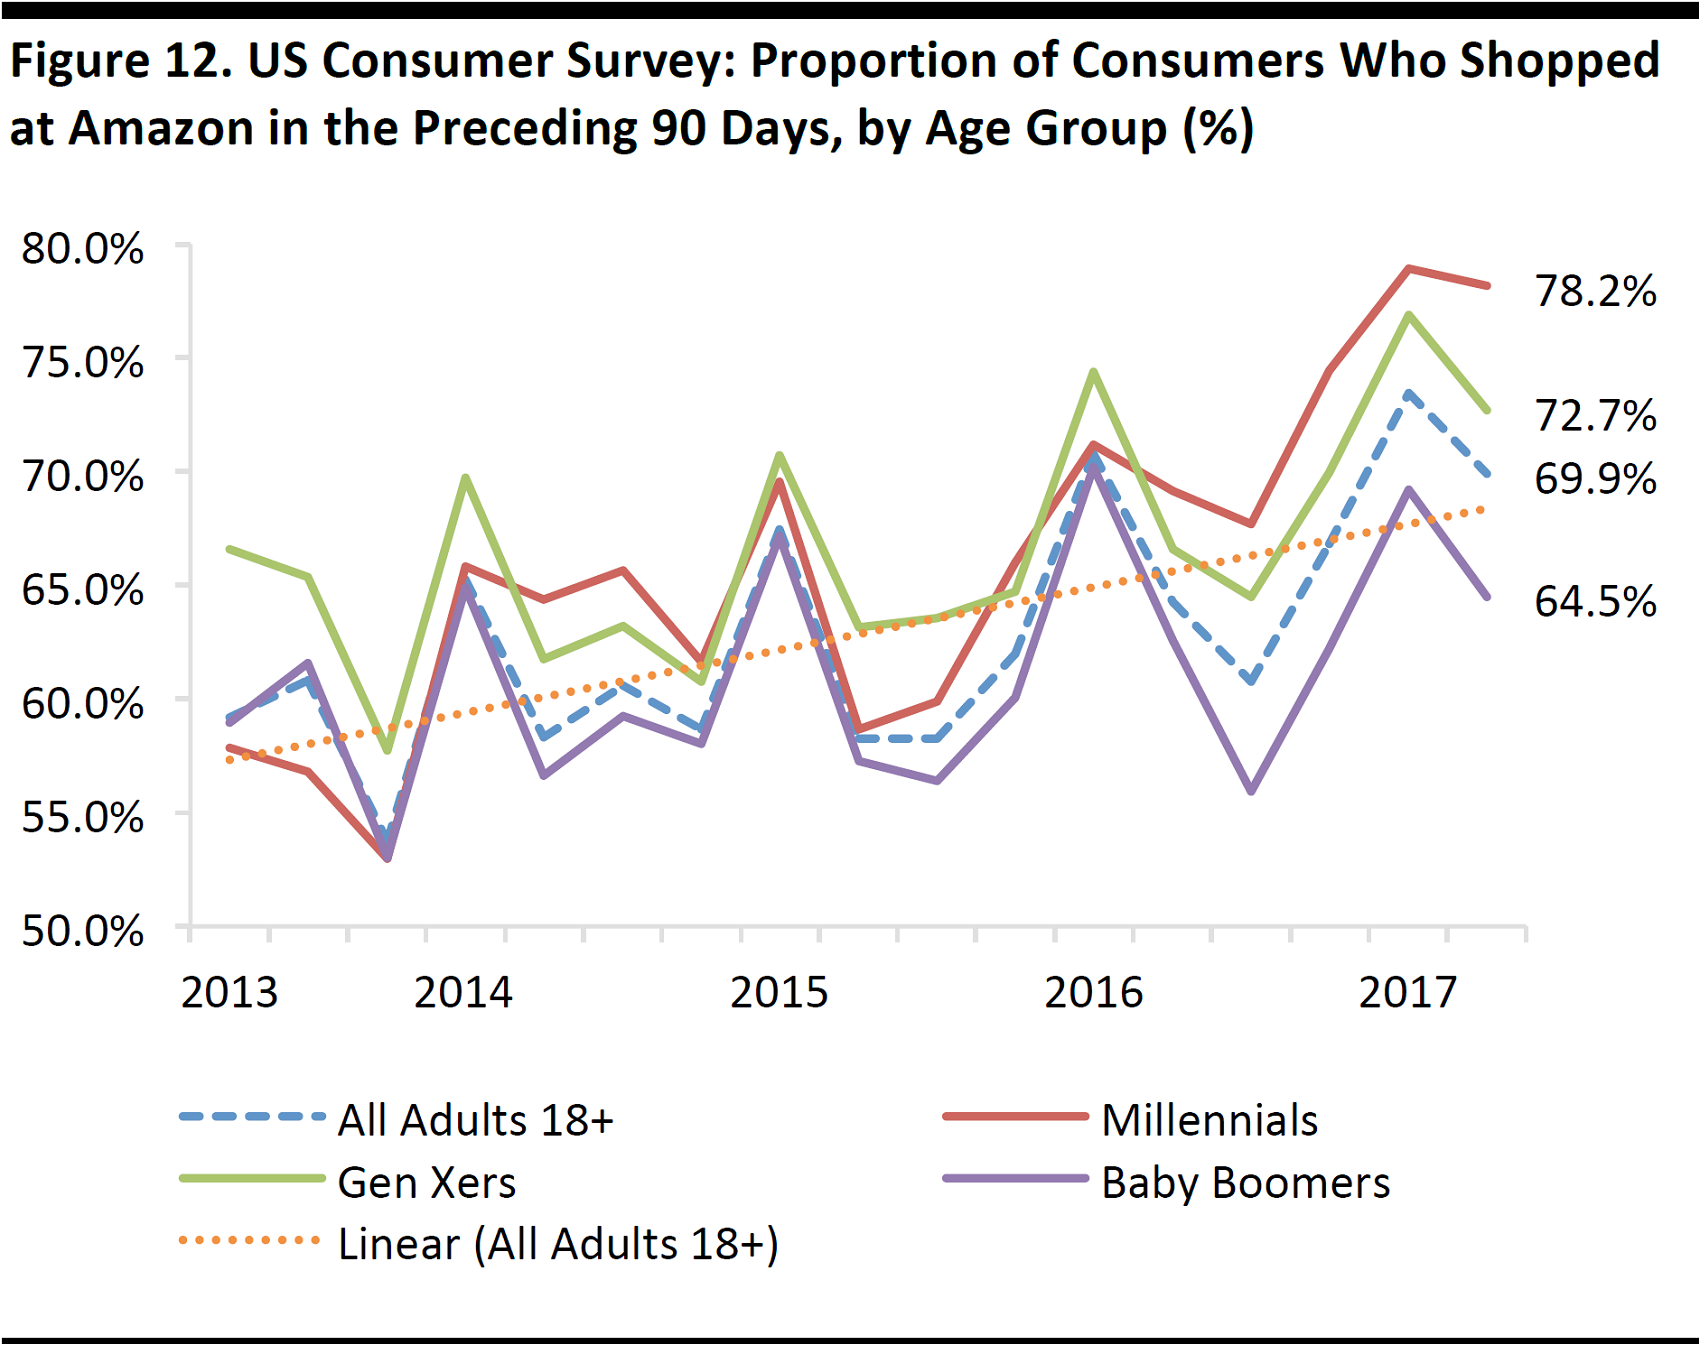
Surveys conducted April 1, 2013, through April 1, 2017
Base: Between 4,912 and 7,733 US adults aged 18+ in each period
Source: Prosper Insights & Analytics
Amazon sees seasonal fluctuations in shopper participation levels, with a strong peak over the holiday period. In the graph above, we chart the medium-term trend with a linear trendline, which shows a steady increase.
The Prosper survey data reveal two trends:
- Millennials have firmly overtaken Gen Xers as the most likely age group to shop at Amazon. Fully 78% of millennials had purchased from Amazon in the 90 days ended April 1, 2017.
- The gap between the age groups has tended to widen. This is counter to what we would commonly expect: we would expect to see that gap narrow as older age groups adopt e-commerce and catch up with younger age groups. This suggests that Amazon is cementing its appeal among younger age groups.
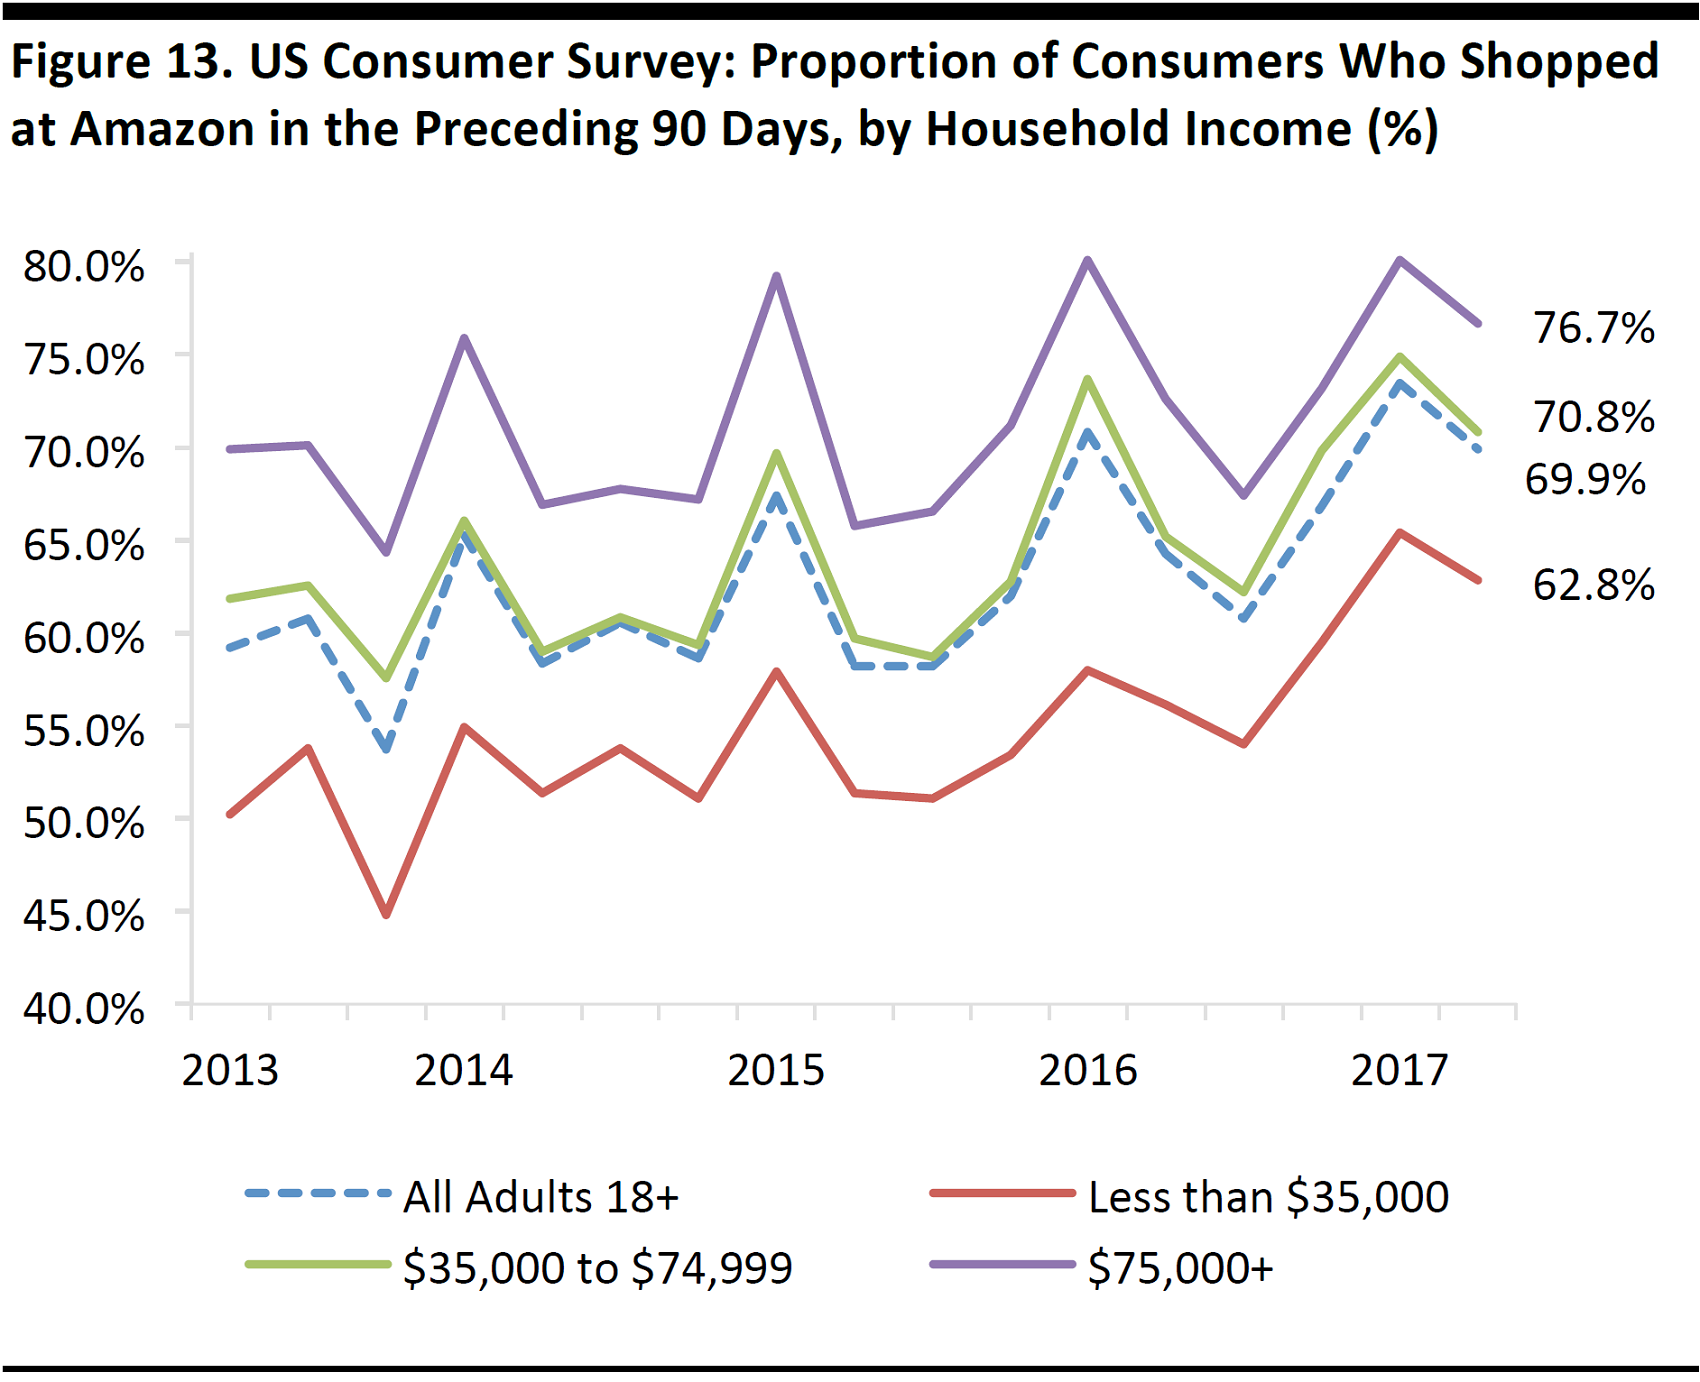
Surveys conducted April 1, 2013, through April 1, 2017
Base: Between 4,912 and 7,733 US adults aged 18+ in each period
Source: Prosper Insights & Analytics
By household income, the trend is consistent: more-affluent shoppers are more likely than the average shopper to shop at Amazon and less-affluent shoppers are less likely to.
Shoppers who have incomes in the $35,000–$74,999 range track the typical customer very closely in terms of tendency to shop at Amazon, as they do for Prime membership (charted earlier).
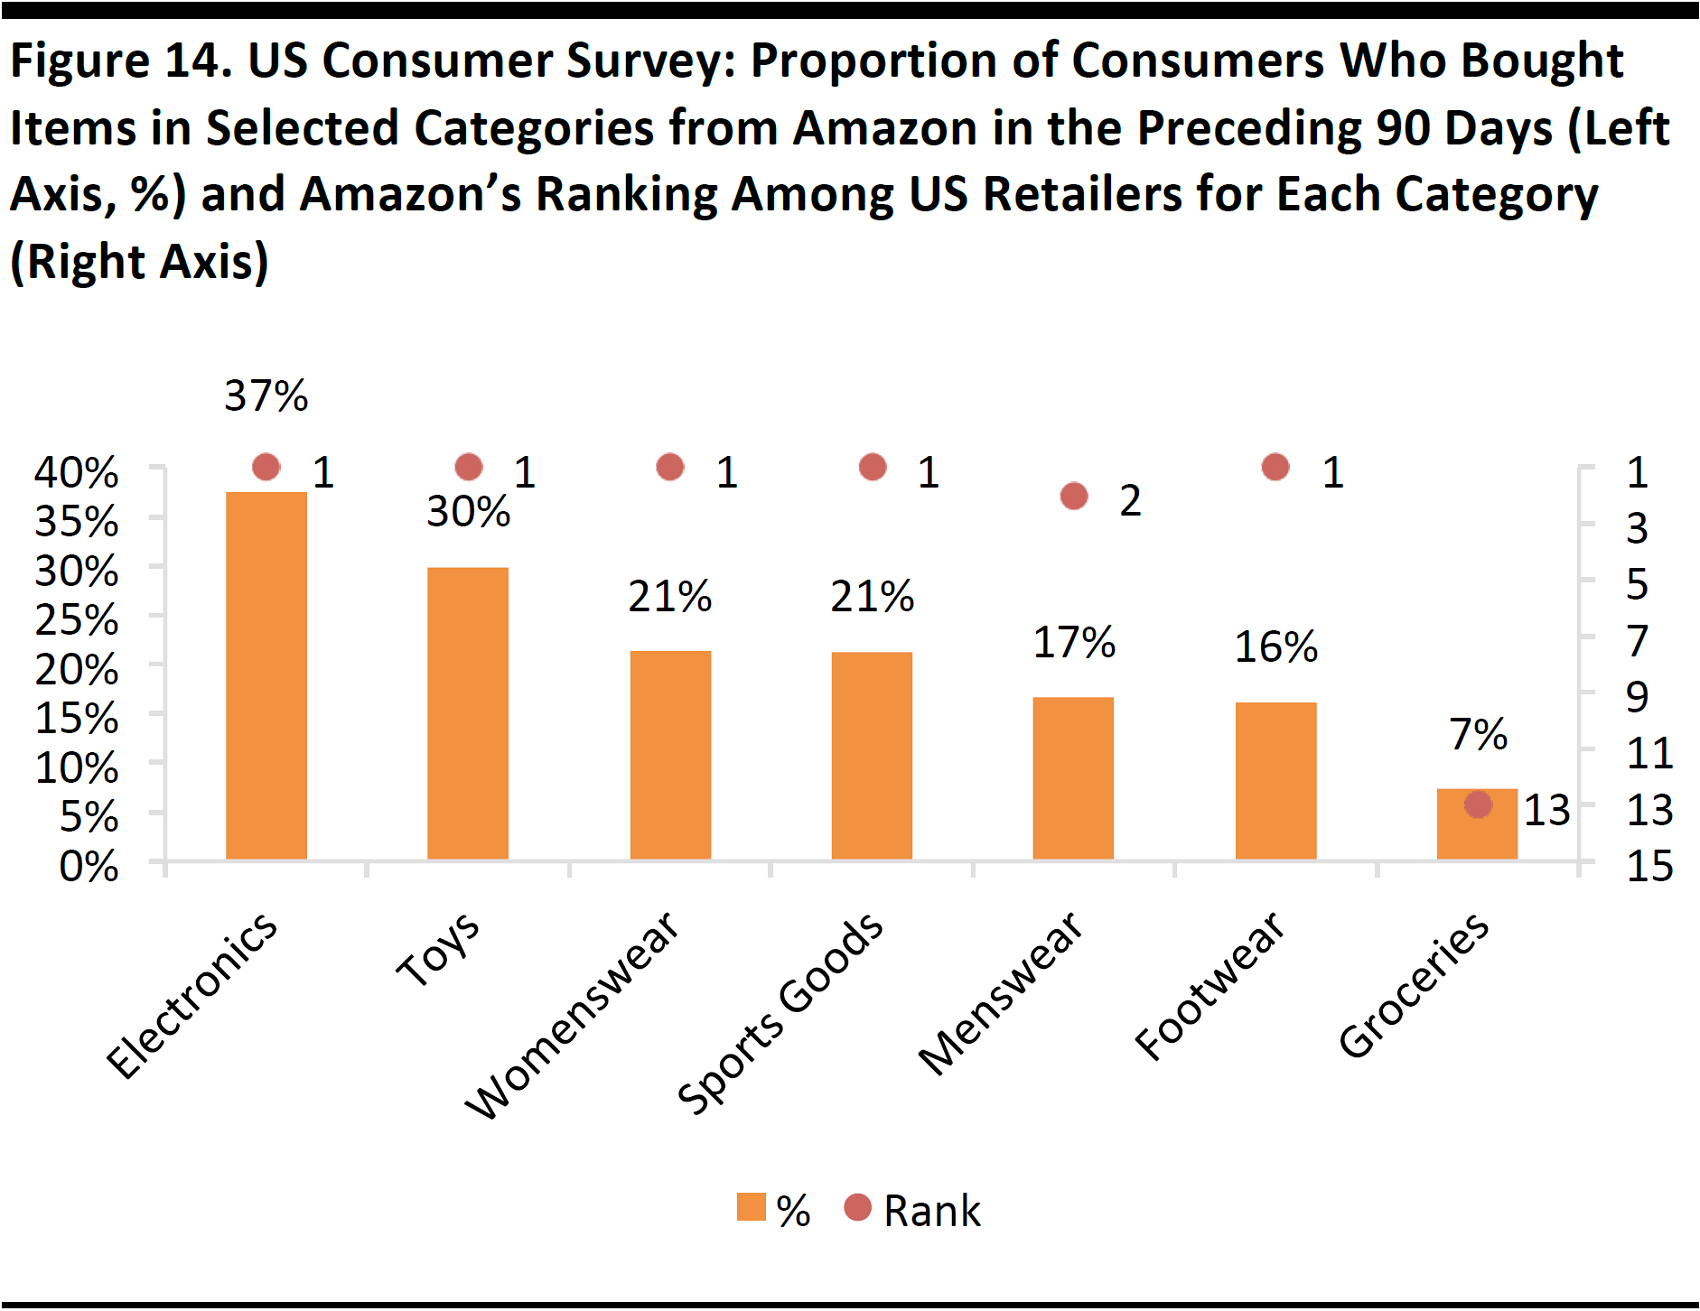
Surveys conducted June 2016 through April 2017
Base: Between 6,791 and 7,609 US adults aged 18+ in each survey Rank indicates Amazon’s position versus other retailers named in the survey by number of shoppers—so, a #1 ranking shows that Amazon is the top retailer for that category, as measured by number of shoppers.
Source: Prosper Insights & Analytics
The chart above shows both the proportion of consumers surveyed who had purchased an item in one of the selected categories from Amazon in the preceding 90 days and Amazon’s ranking in that category versus other retailers, based on shopper numbers.
In five of the seven categories shown, Amazon is now the number one retailer by number of shoppers: only menswear and groceries see other retailers taking the top spot. The latest menswear survey is from June 2016, so we could see Amazon capture the first position in that category when Prosper completes its June 2017 survey.
Shopper numbers are impacted by the frequency at which consumers buy items in different categories. Electronics, for example, tend to be purchased more frequently than apparel.
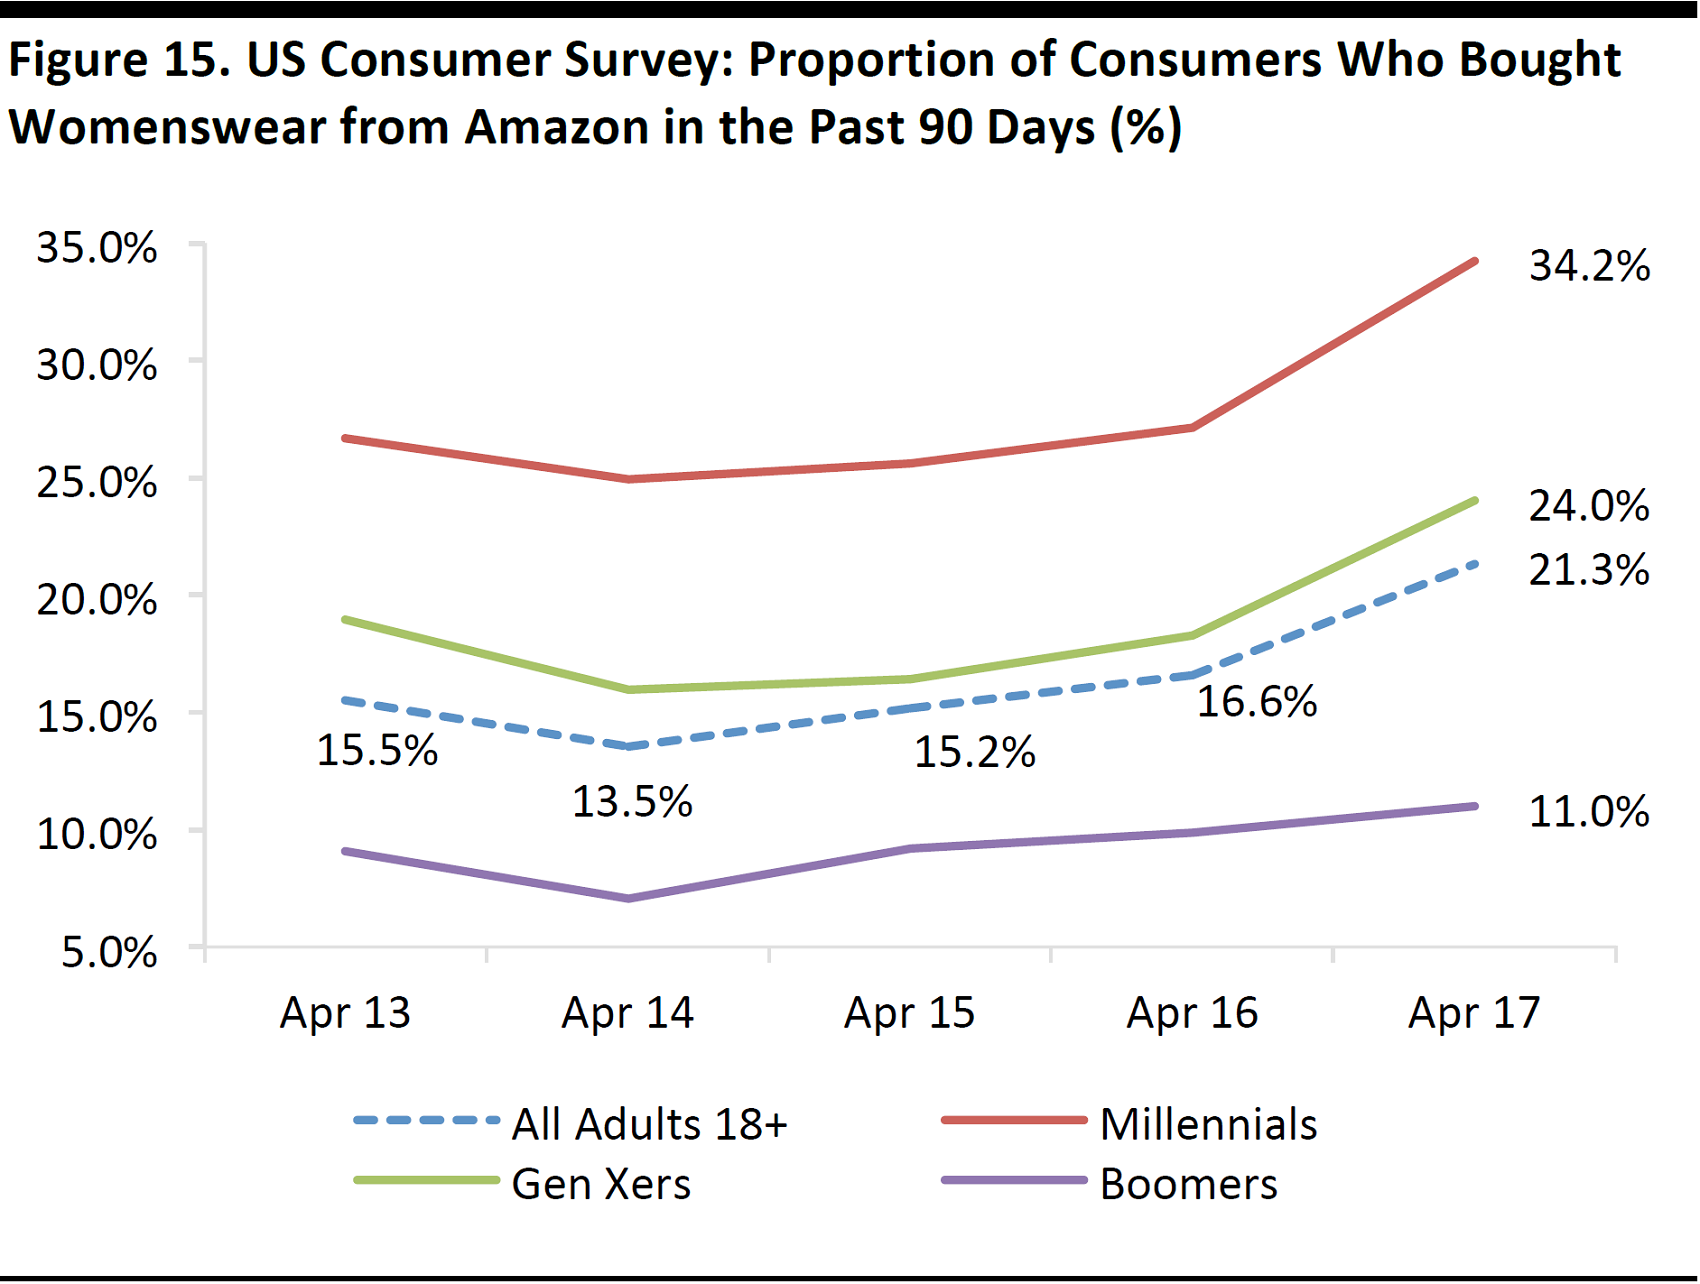
Base: 4,912–7,406 adults aged 18+ in each survey period
Source: Prosper Insights & Analytics
More than one-third of all US millennials surveyed had bought womenswear from Amazon in the 90 days ended April 2017, compared with 21% of all US consumers surveyed.
Amazon is now the number one destination for womenswear in the US, based on shopper numbers: it narrowly overtook Kohl’s as the top retailer for womenswear, by shopper numbers, in the April 2017 Prosper survey.
However, this does not mean that Amazon is the biggest retailer in the category by sales, as that metric is affected by frequency of shopping and average spend as well as by number of shoppers.
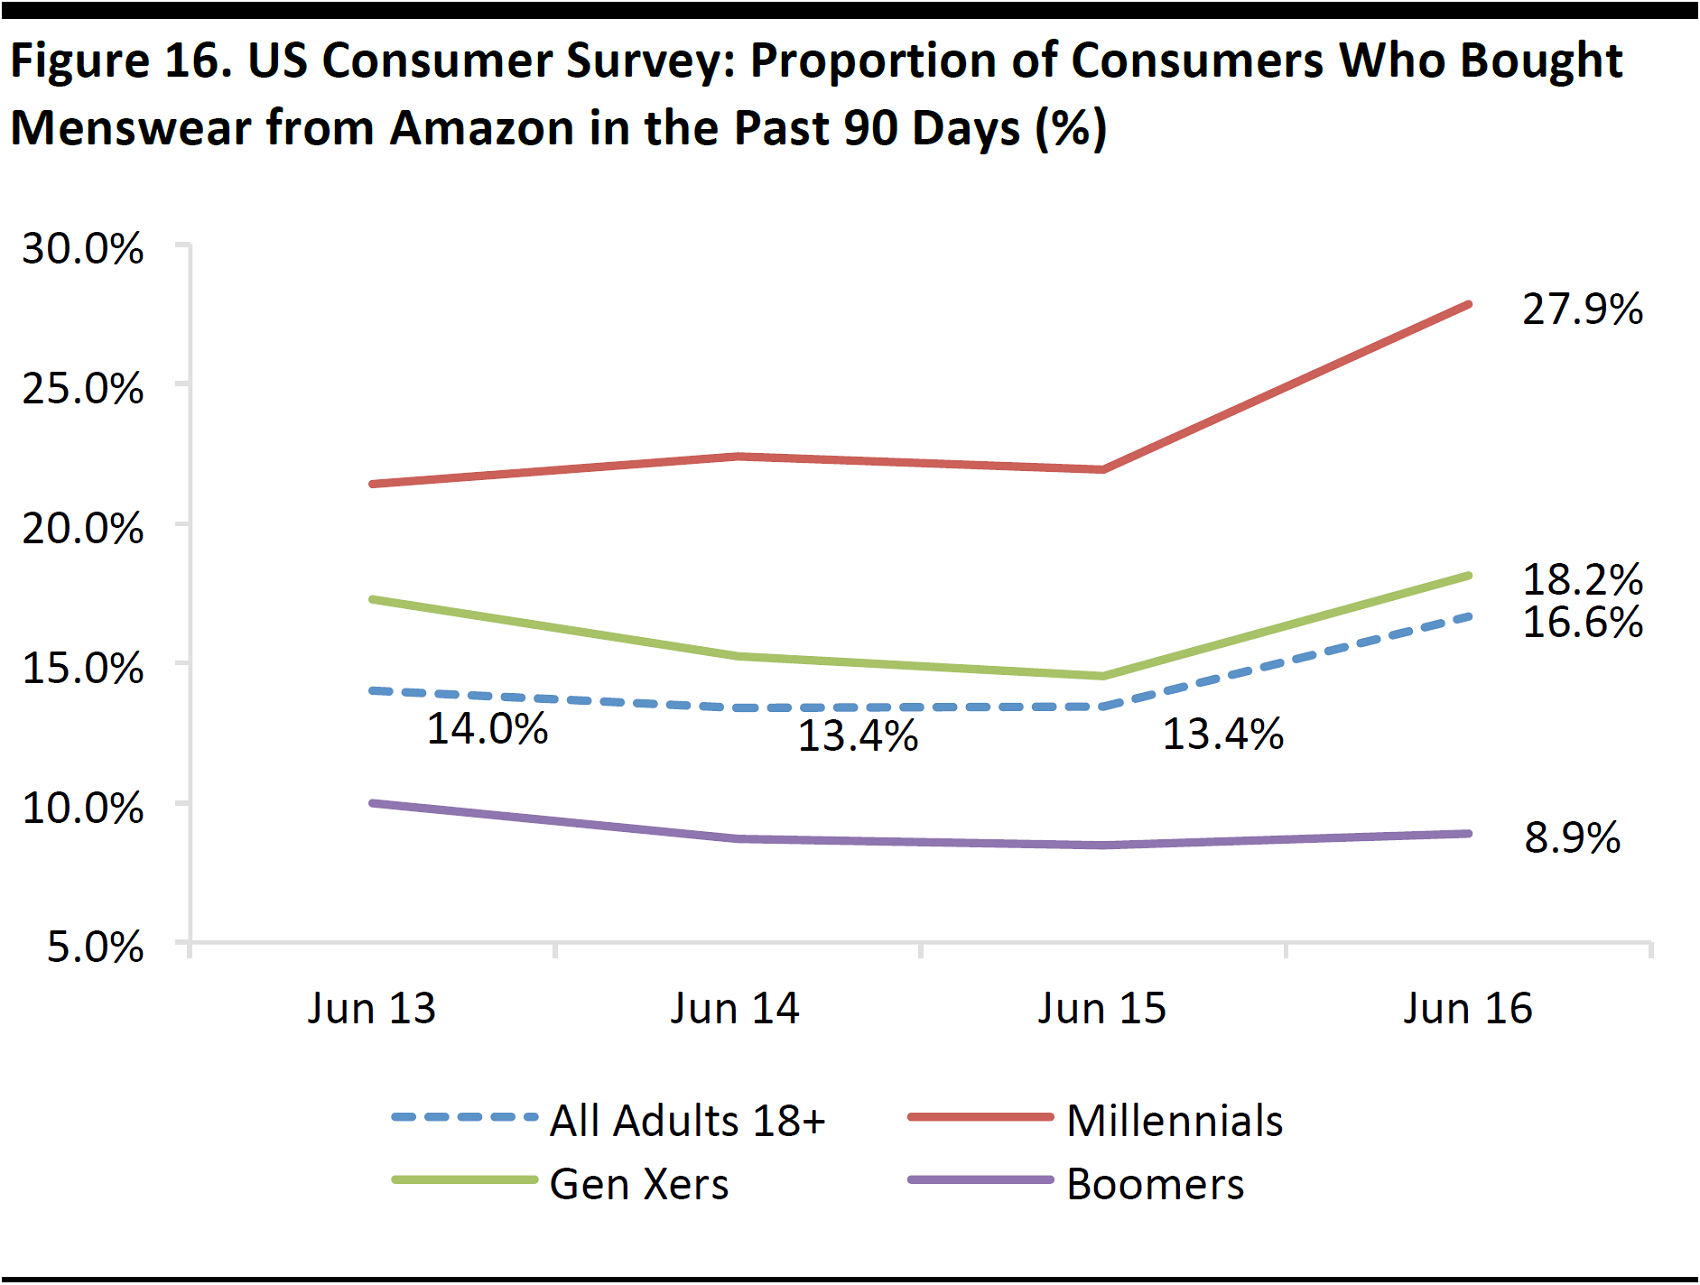
Base: 5,606–8,760 adults aged 18+ in each survey period
Source: Prosper Insights & Analytics
Prosper’s latest survey regarding menswear is from June 2016, when Amazon was the second-most-shopped retailer in the previous 90-day period among those surveyed. Only Walmart was more popular for menswear. We may find that Amazon has moved up to become the most-shopped retailer for menswear in the June 2017 survey.
As with womenswear, Amazon’s total shopper numbers conceal much higher shopping rates among millennials.
Logistics
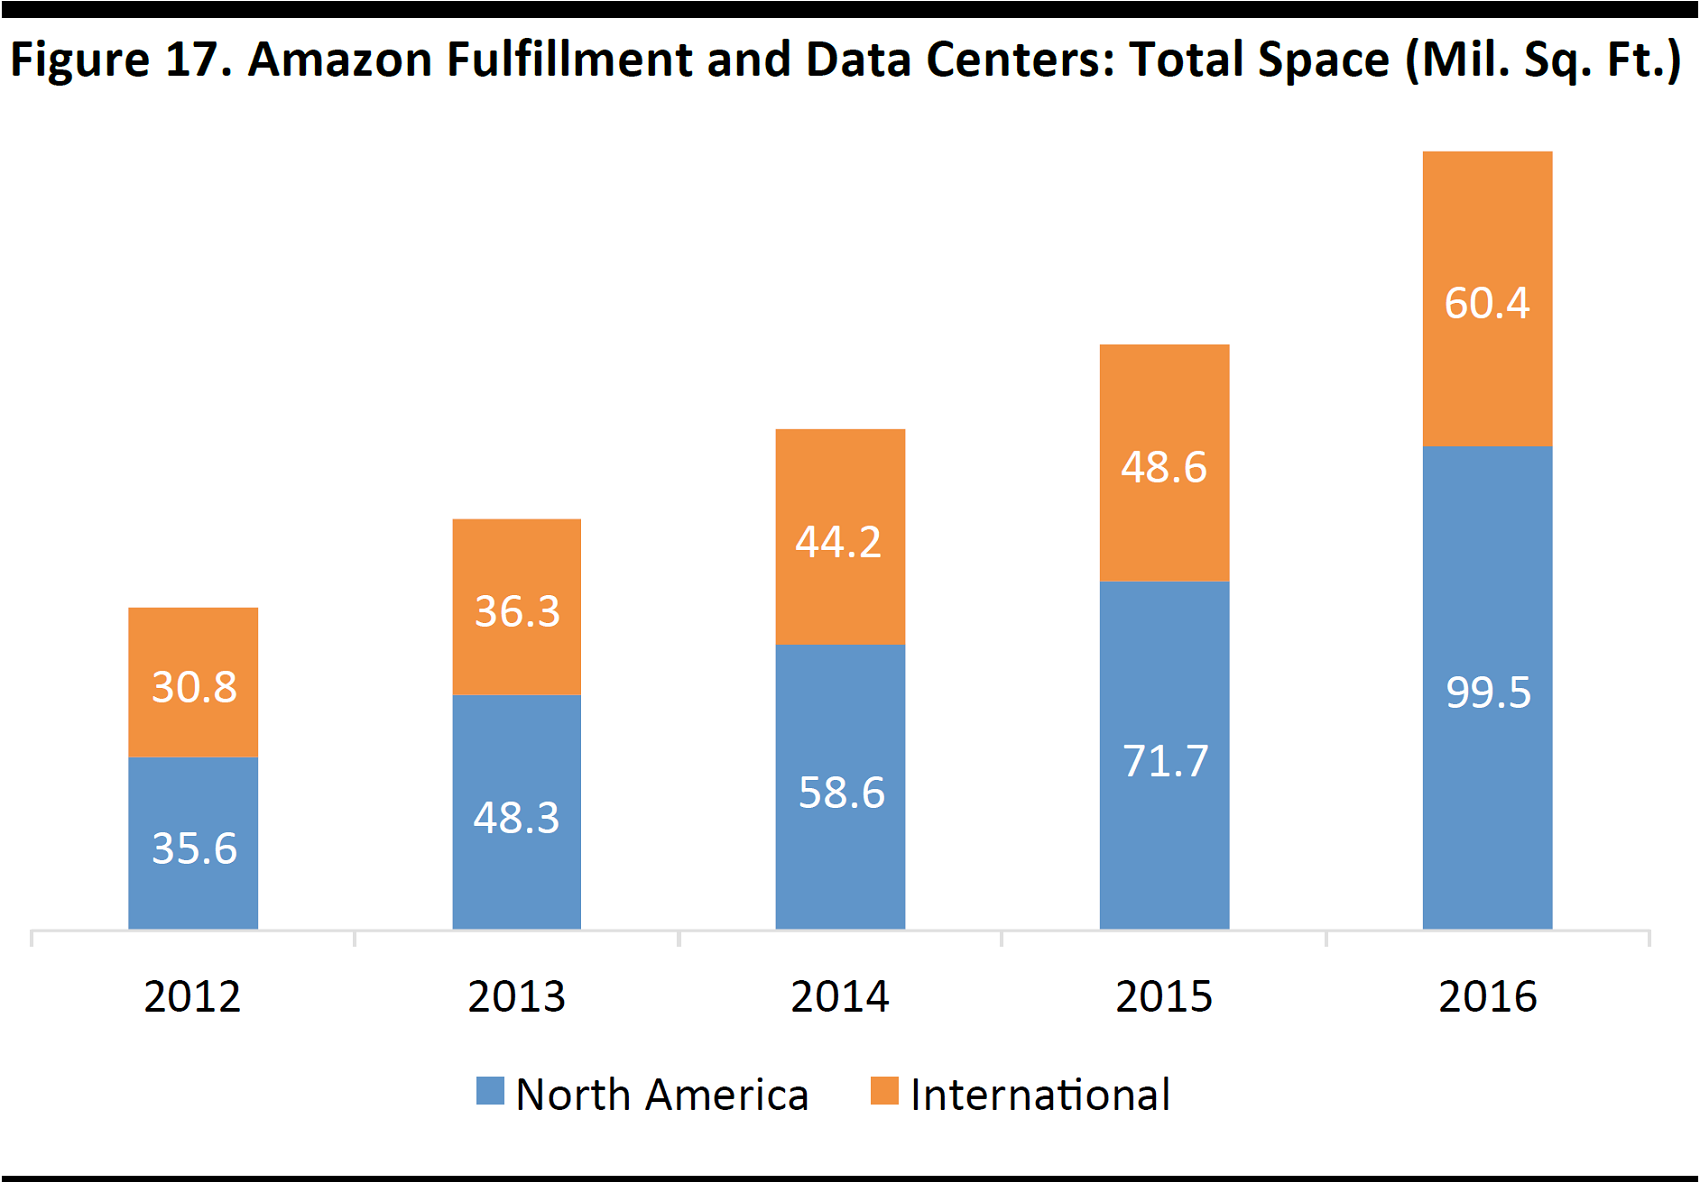
Space is for “fulfillment, data centers and other.”
Source: Company reports
At the end of 2016, Amazon operated 160 million square feet of space across its fulfillment centers and data centers worldwide. Some 62% of this space was in the US, which accounted for 66% of 2016 revenues.
Recently opened US fulfillment centers are typically between 750,000 and 1 million square feet and employ around 1,000 people each.
According to property research firm MWPVL International, Amazon operates several types of distribution centers: large fulfillment centers, midsize Amazon Pantry and Amazon Fresh distribution centers, midsize regional sortation centers, smaller delivery stations (for sorting packages for shoppers in nearby areas) and even smaller Prime Now hubs (which stock popular products for rapid delivery).
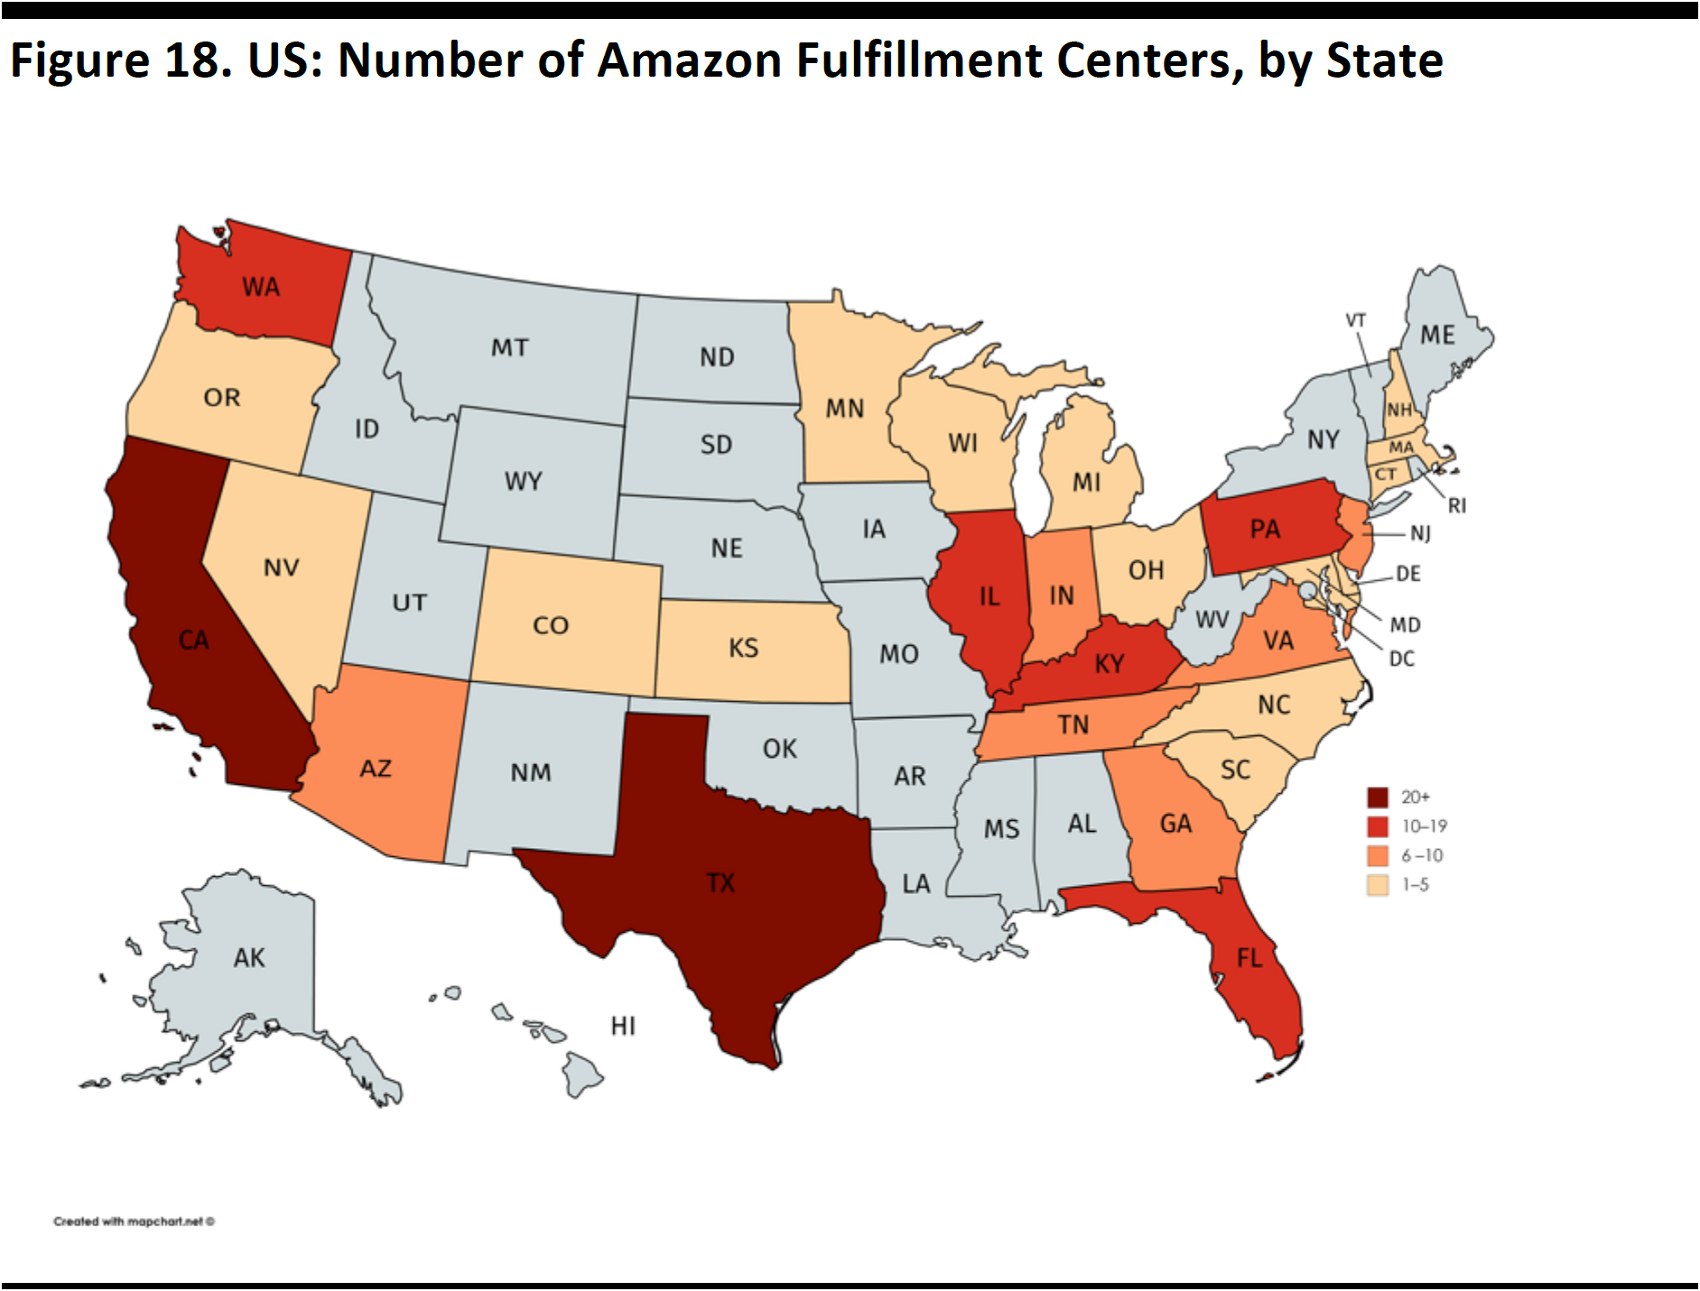
Includes fulfillment and distribution centers, regional sortation centers, Amazon Pantry and Amazon Fresh distribution centers, delivery stations and Prime Now hubs, operational or planned, as of January 2017
Source: MWPVL International/Statista
Amazon operated 214 distribution facilities across the US as of January 2017, according to MWPVL and Statista. California and Texas are home to the highest number of fulfillment centers.
New Markets
Source: Fung Global Retail & Technology
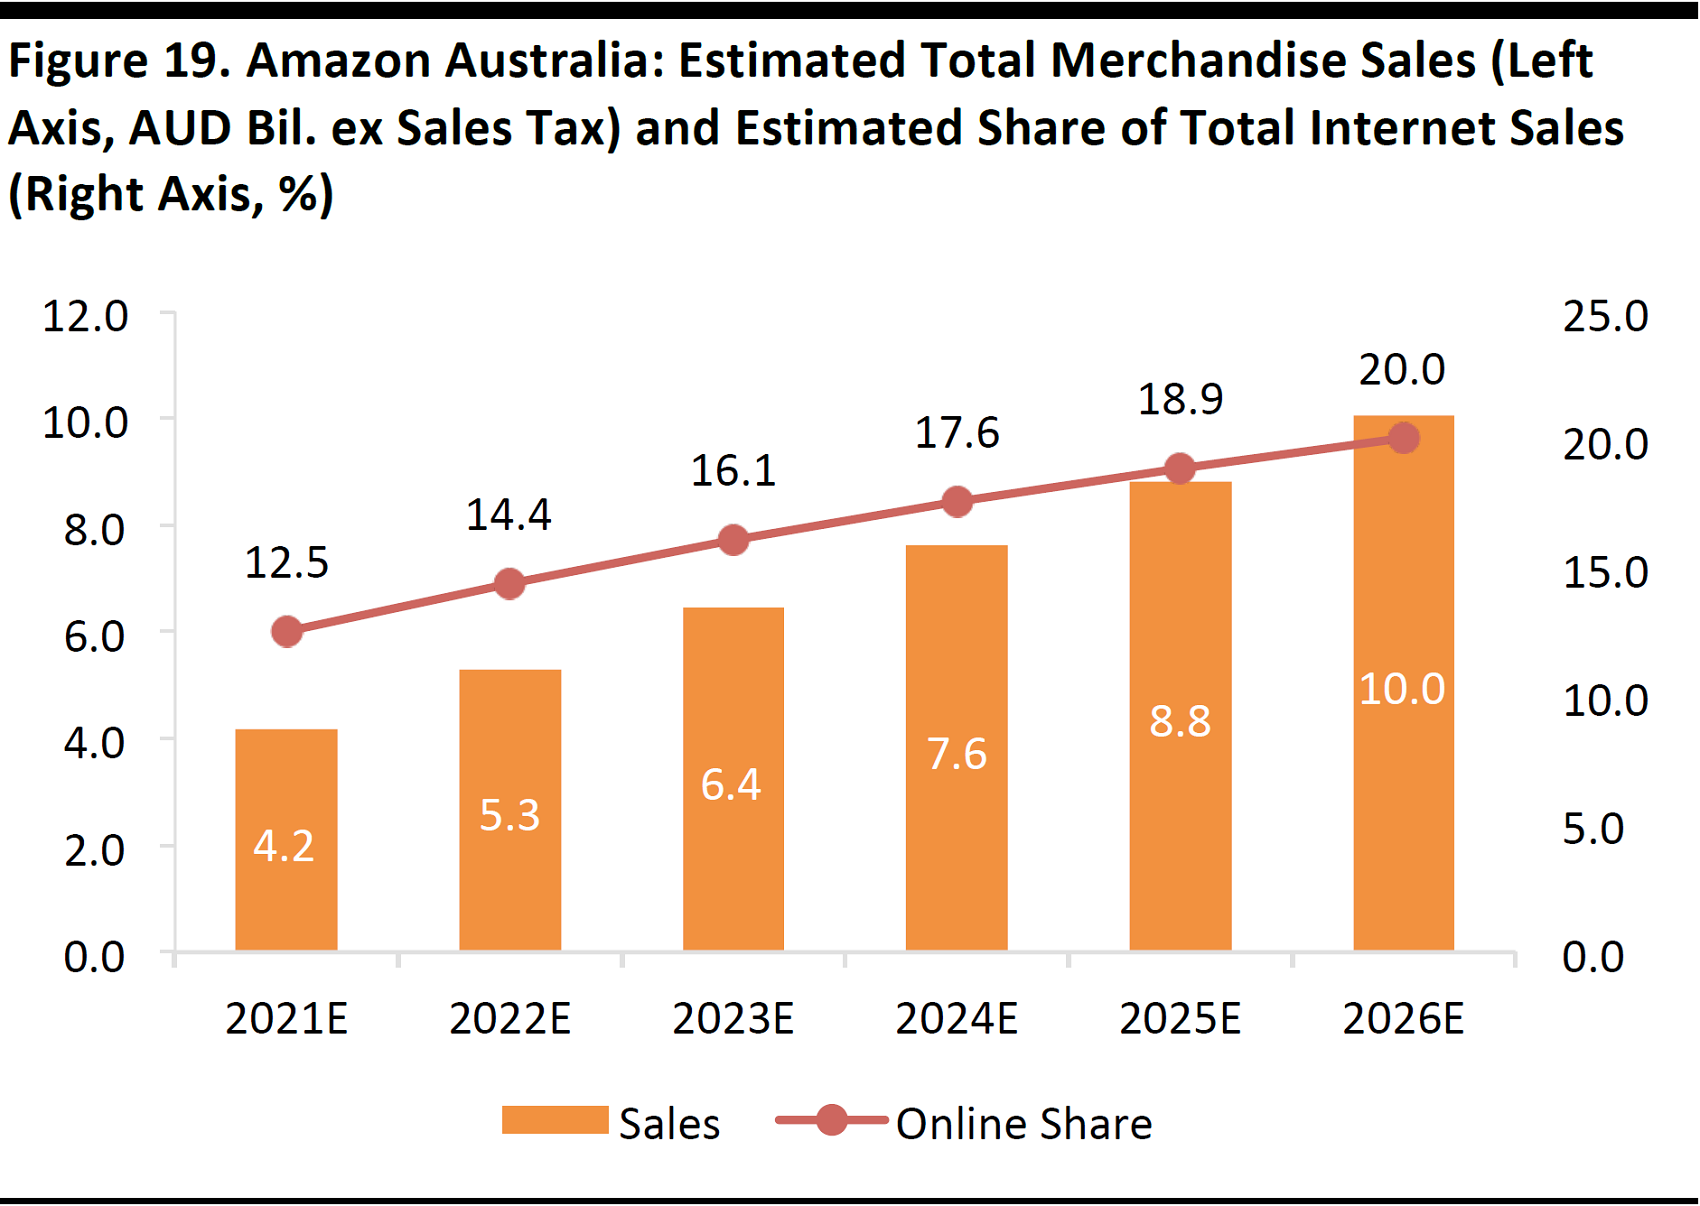
In April 2017, Amazon confirmed that it is set to launch a full offering in Australia—although it did not disclose a launch date. Assuming it moves into the market in 2018, we estimate that Amazon Australia could generate total net merchandise sales of approximately A$4 billion in 2021 and A$10 billion in 2026 (equivalent to US$3 billion and US$7.5 billion, respectively, at the time of writing). Our figures include sales by third-party marketplace sellers on Amazon, so they do not represent revenues booked directly by Amazon.
These estimates translate to a share of approximately 12.5% of Australian Internet sales in 2021 and 20% in 2026, climbing by an average of 150 basis points per year.
Source: Company reports
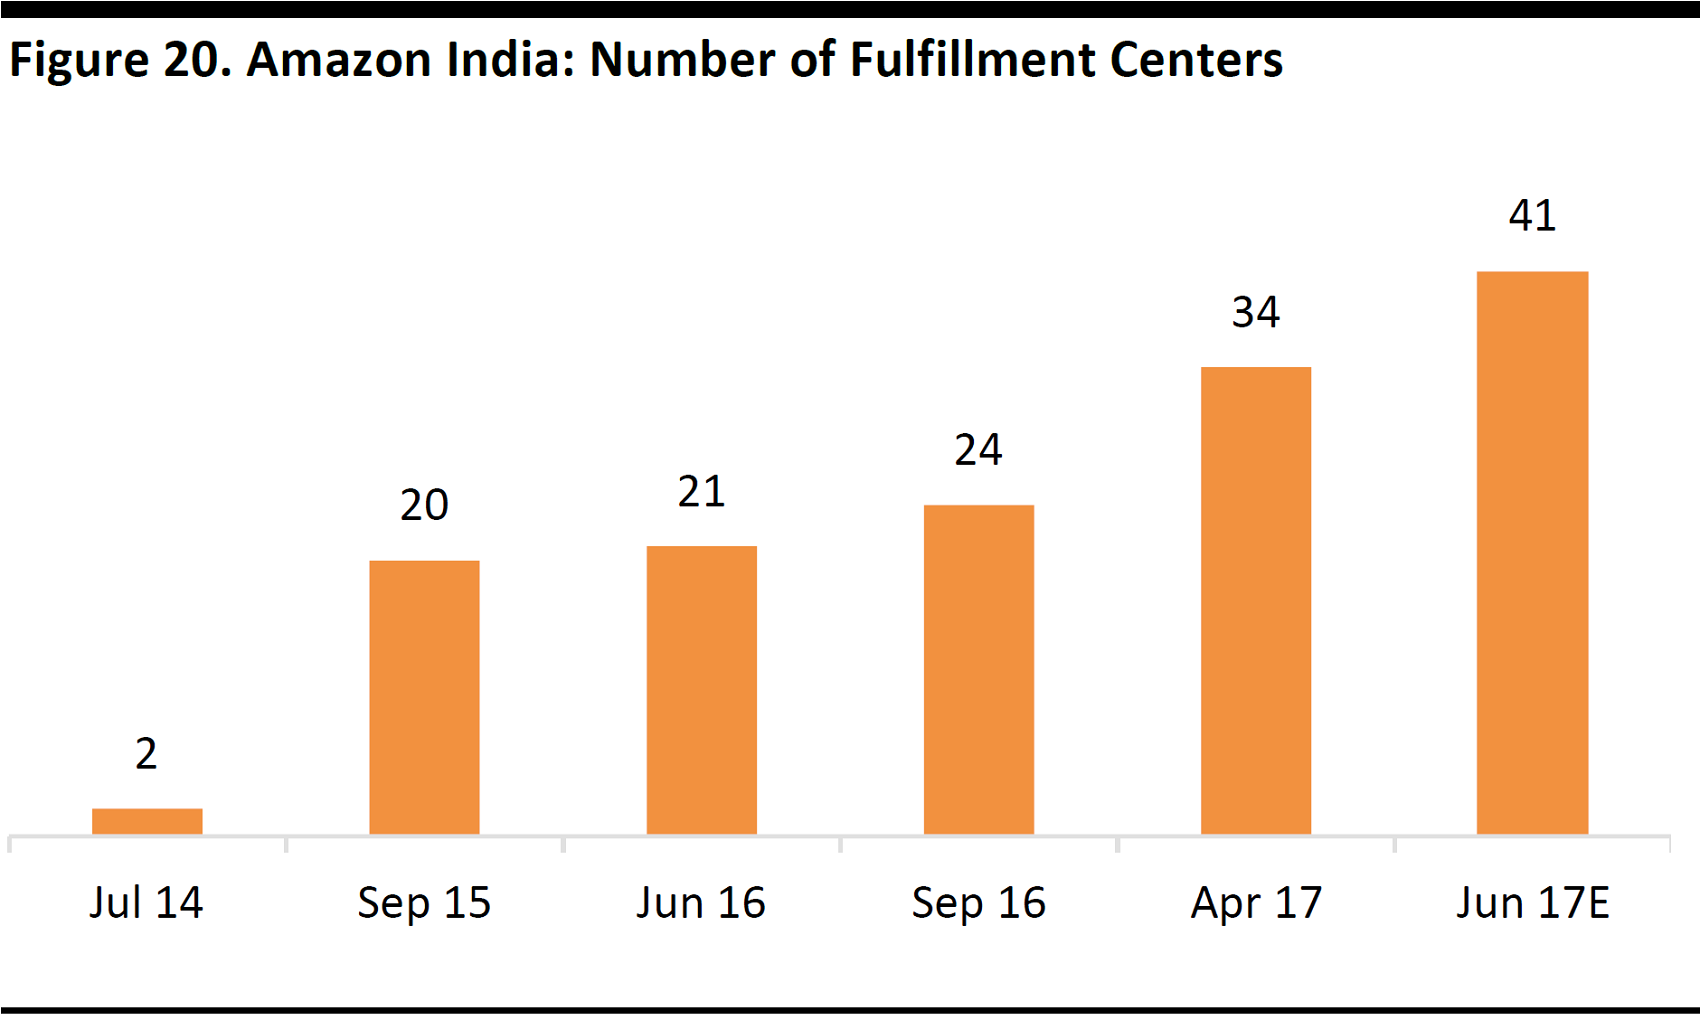
India is a second focus for investment by Amazon and, above, we chart the growth in its number of fulfillment centers in the country, based on press reports. In addition to fulfillment centers, Amazon India also operates delivery stations, which sort deliveries for shoppers in nearby areas.
In April 2017, Amazon India announced that it had opened seven new fulfillment centers that will be used exclusively for large appliances and furniture. In May, the company announced that it would open a further seven Indian fulfillment centers by the end of June, bringing the total to 41.
Amazon.in operates purely as a marketplace site, due to restrictions on foreign direct investment in multi-brand retailing (i.e., the selling of a range of third-party brands). In Amazon’s first-quarter 2017 results, CEO Jeff Bezos said, “Amazon.in is the most visited and the fastest-growing marketplace in India.”Amazon India launched Prime in July 2016.
Key Takeaways
As charted earlier, analysts currently expect Amazon to grow worldwide revenues by 161%, from $136 billion in 2016 to $356 billion in 2022. The consensus among analysts is for operating margins to strengthen steadily, before reaching double digits in 2022.
The key data points from this report that showcase the building blocks for this forecast growth are:
- Amazon Web Services is bolstering profit growth. This business division yielded a 25% operating margin in 2016, up from 19% in 2015. And the division is growing its share of Amazon’s total revenues: Amazon Web Services accounted for 9% of total revenues in 2016, up from 7.4% in 2015.
- Amazon’s third-party marketplace is almost certainly providing further support to margins (though the company does not break this segment out). Half of all unit sales made through Amazon are now made by third-party sellers, for which Amazon books a commission without taking ownership of inventory.
- Amazon Prime is shoring up topline growth. Some 42% of US adults now have a Prime membership and that figure rises to 55% among millennials. Given that delivery benefits can be shared within a household, a substantially higher share of the US population has access to Prime.
Further Reading from Fung Global Retail & Technology
Deep Dive: Aussies, Get Ready for Amazon!
Deep Dive: India Rising Part 2—E-Commerce Disruptors in India
Deep Dive: US Consumer Survey—Amazon Prime Members Love Shopping Offline, Too
Deep Dive: US Consumer Survey—Amazon Yet to Crack the Menswear Market
Deep Dive—US Consumer Survey: Amazon Is Winning the Battle in the Toy Segment
US Health and Beauty Aids Consumer Survey: Amazon Is Not Only Competitive in Price, but Also in Customer Satisfaction
Footwear Poised to Grow at 4 Times the Rate of Apparel Through 2020: Data Reveal Specialty and Online Are Benefiting, with Amazon Gaining the Most
Deep Dive: Retail Revolution—US Apparel Shifts in 20 Charts
Amazon Shopper Intelligence Service
This report features selected data that are available from the
Amazon Shopper Intelligence Service. This service combines Fung Global Retail & Technology analysis and commentary with input on thousands of US shoppers from Prosper Insights & Analytics. It includes:
- Over 10 years of survey data on Amazon shoppers and leading retailers’ shoppers.
- Prosper Shopper Preference Share (which indicates how Amazon is growing as a preferred retailer for 11 different merchandise categories, and the reasons why).
- Retail positioning maps (which plot retailers and their competitors based on the percentage of their shoppers who shop there for particular reasons).
- Net promoter scores.
- Key demographics.

Source: Fung Global Retail & Technology


