Executive Summary
Americans spend nearly half of their day staring at a screen. A new Nielsen report revealed that US adults ages 18 and overspent, on average, 11 hours and 22 minutes daily consuming media in the fourth quarter of 2016—up a full hour from the fourth quarter a year earlier. While Americans are spending more time-consuming media, traditional channels such as TV and radio have begun to lose share to smartphones, other devices and online streaming services. These include multimedia devices such as Apple TV and Roku and subscription video on demand (SVOD) services such as Netflix, Hulu and Amazon Video.
With new devices, more robust wireless connectivity and evolving media business models, consumers now have countless ways to enjoy digital media. As the growing forces of social media and digital streaming continue to exert themselves—particularly among millennials and Generation Zers—retailers will be forced to plot new strategies to capture consumers’ attention. The digital channel’s influence on retail shopping continues to grow, and retailers are adjusting their digital media strategies in order to meet consumers where they are, be that a social media network, a streaming service or elsewhere. In this report, we provide an overview of consumers’ shifting attitudes and behaviors regarding media consumption and examine how they are affecting retailers’ and brands’ media strategies.
Media Overview: US Media Consumption Up an Hour per Day from 2015
According to the
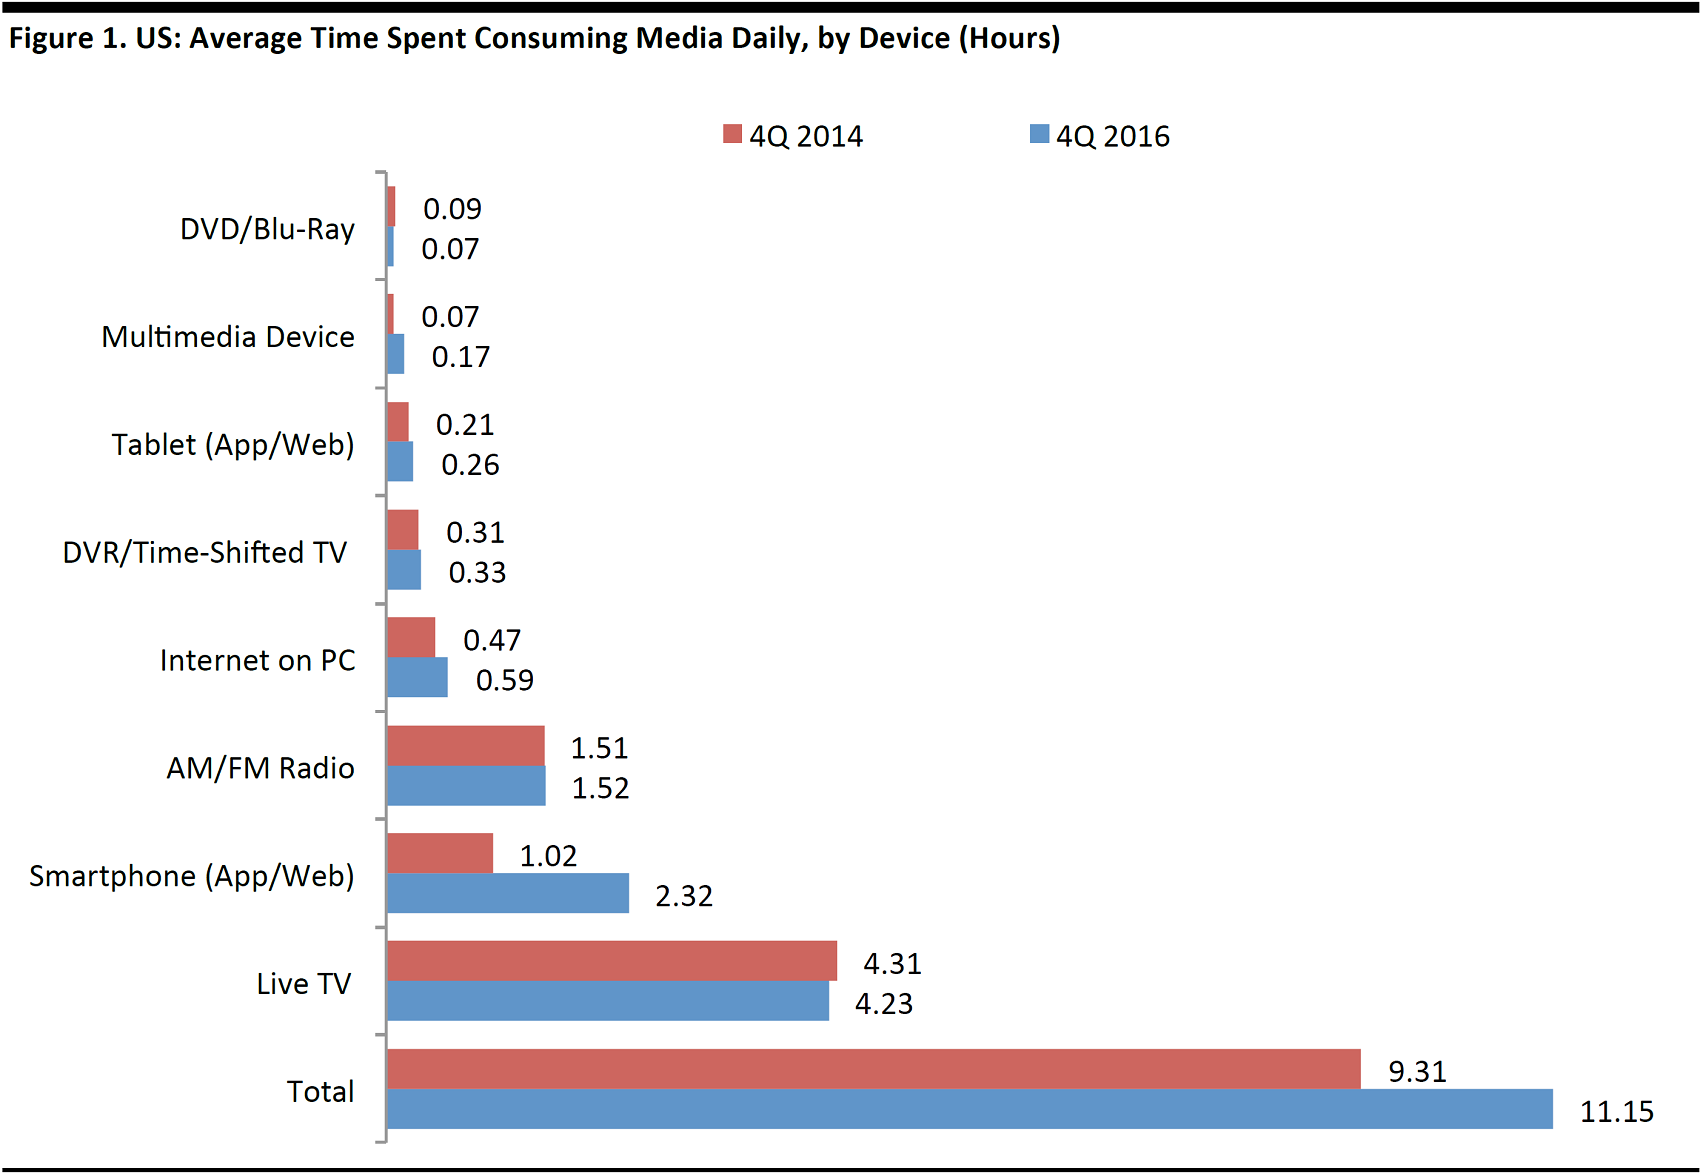
Nielsen Total Audience Report: 4Q 2016, US adults ages 18 and older spent 11 hours and 22 minutes a day, on average, consuming media in the fourth quarter of 2016, up a full hour from the same period a year earlier. Over a two-year period, total daily media consumption increased by an hour and 50 minutes, or nearly 20%. Nielsen’s report examined how much time consumers spent daily using smartphones, tablets, personal computers, multimedia devices, video games, radios, DVDs, DVRs and TVs.

Source: iStockphoto
The rise in smartphone usage (time spent on mobile web and apps) drove the majority of the increase: US adults spent an average of two hours and 32 minutes per day on smartphone devices in the fourth quarter of 2016, up an hour and 30 minutes from the fourth quarter of 2014. Multimedia device usage, including Apple TV and Roku usage, was up 10 minutes over the two-year period, representing the second-largest increase. Live TV viewing represented the largest decline over the period, with US adults averaging four hours and 23 minutes of viewing in the fourth quarter of 2016, down eight minutes from two years earlier. The table below compares media consumption, by device, in the fourth quarters of 2014and 2016.
Nielsen collects data on media consumption only, so time spent on a smartphone or tablet performing other activities, such as taking or sharing photos or texting, was not included.
Source: Nielsen Total Audience Report: 4Q 2016
Moving Away from Traditional TV
Consumers’ movement away from traditional pay TV subscriptions has been accelerating. Cord-cutting reached a record pace in 2016, as consumers continued to ditch pricey cable TV subscriptions for online alternatives. More than 2 million US households unsubscribed from their TV subscriptions in 2016, representing a record 2.4% decline from 2015, according to research firm MoffettNathanson.
Cord-cutting consumers cite high prices as one of the main reasons for cancelling pay TV services. In 2016, the average price for cable TV rose to $99 per month, and it is already up another 4%, to $103 per month, this year, according to Leichtman Research Group. The average cable bill rose by 39% from 2011 to 2016.
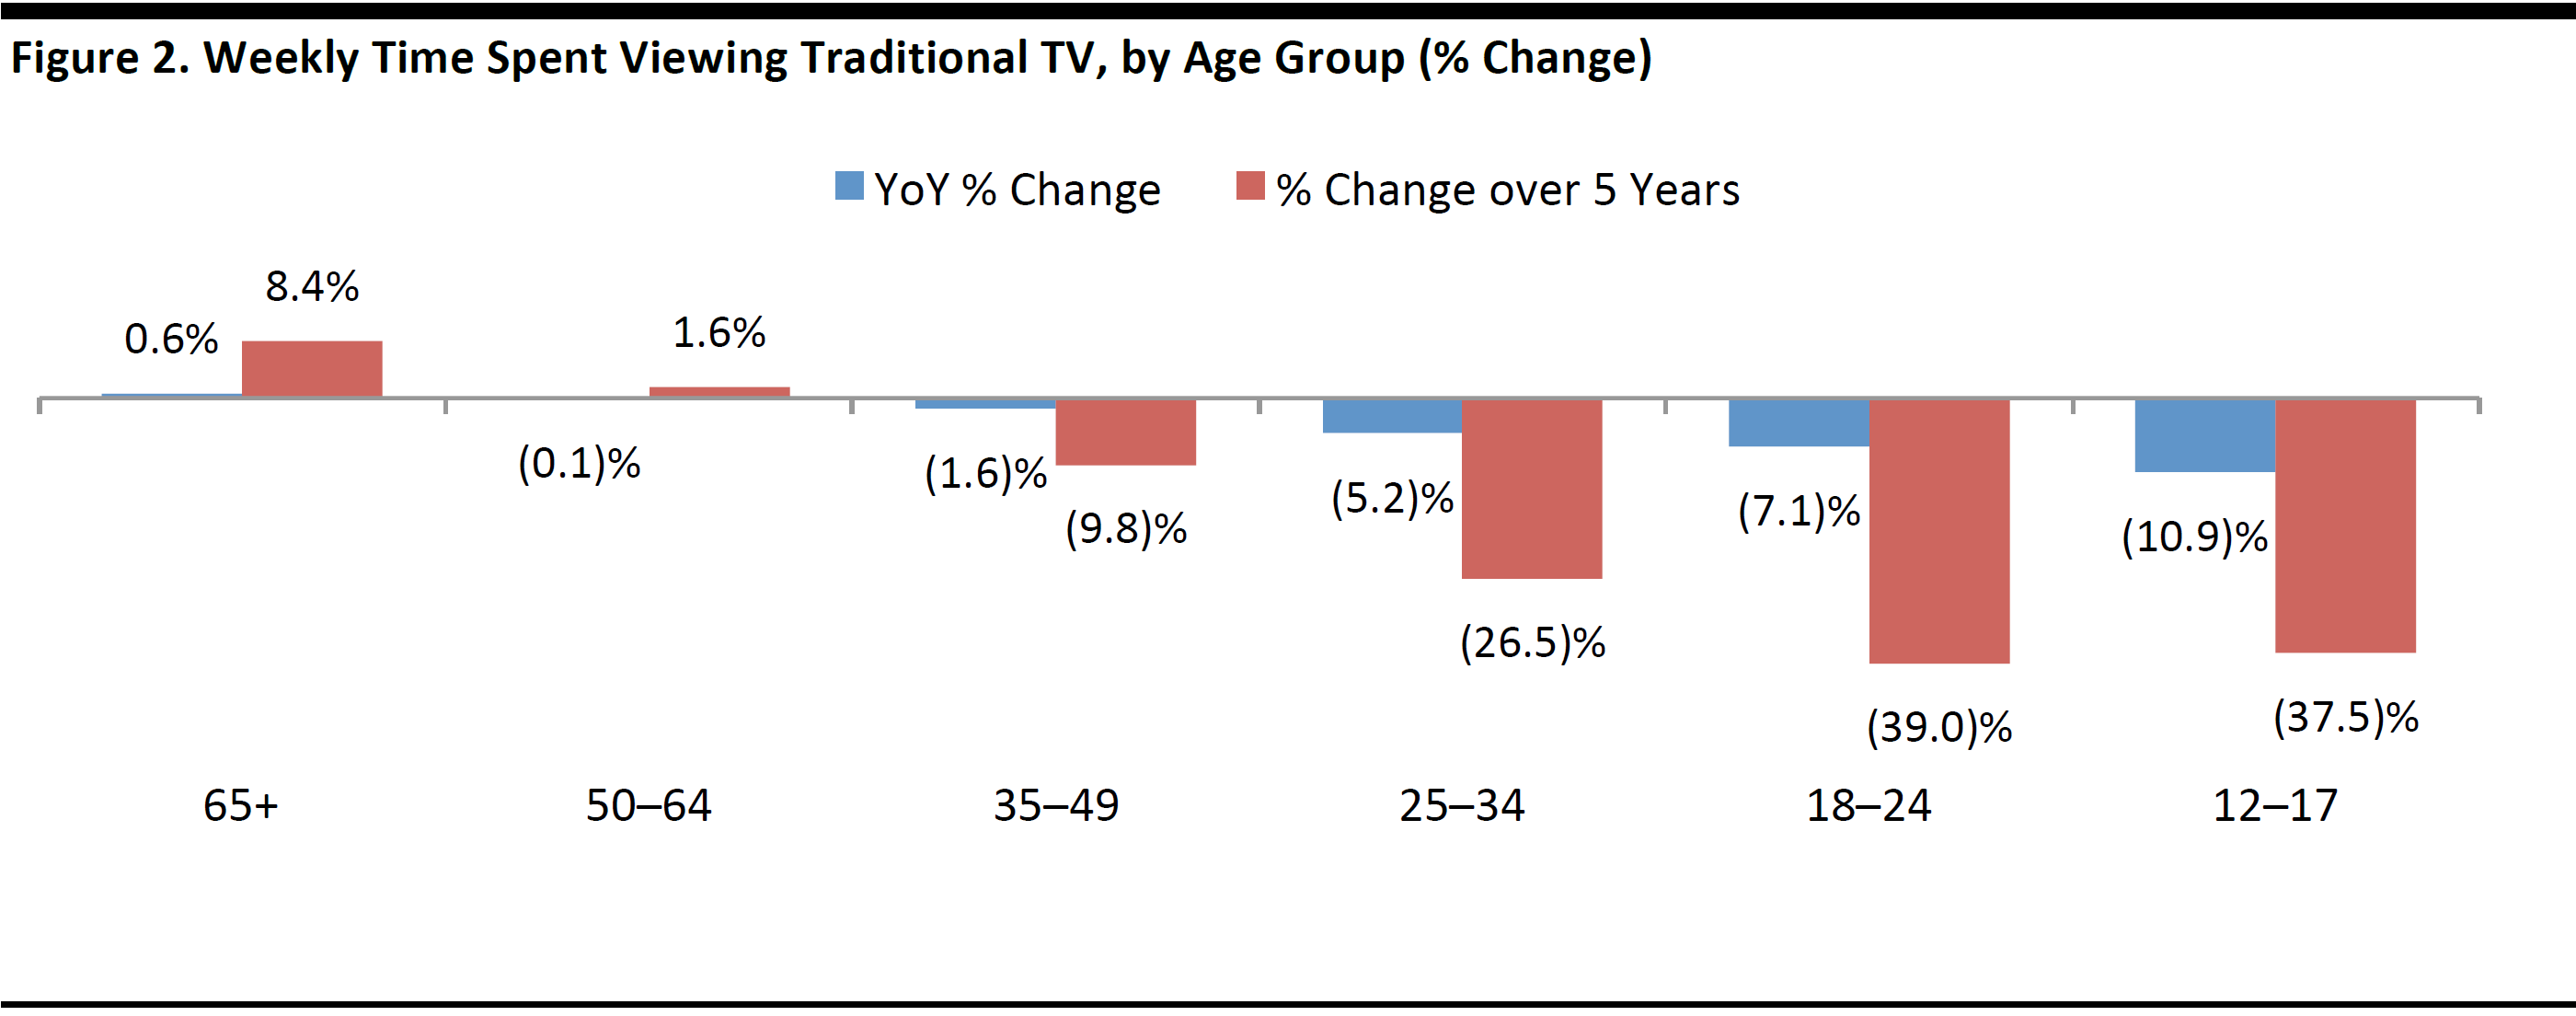
Younger media consumers are driving the decline in TV viewership. Between 2011 and 2016, fourth-quarter traditional TV viewing by 18–24-year-olds dropped by almost 10 hours a week, or by roughly an hour and 25 minutes per day, according to Nielsen. Adults ages 65 and older were the only age group that saw a year-over-year increase between the fourth quarters of 2015 and 2016, with TV viewership up 0.6% over the period. According to Nielsen’s report, in the fourth quarter of 2016:
- Teens (ages 12–17) watched 13 hours and 54 minutes of TV per week, a 10.9% drop year over year and a 37.5% decline over five years.
- Millennials(ages 18–24) watched a weekly average of 15 hours and 36 minutes of TV, down one hour and 11 minutes (or 7.1%) from a year earlier and down 39% over five years.
- Older Millennials (ages 25–34) watched 22 hours of TV per week, a 5.2% decrease year over year and a 26.5% decrease over five years.
- Gen Xers (ages 35–49) watched 30 hours and 55 minutes per week, a 1.6% decrease year over year and a 9.8% decrease over five years.
- Adults (ages 50–64) watched 42 hours and 56 minutes per week, roughly flat year over year but up 1.6% over the five-year period.
- Adults (ages 65 and older) were the only age group that saw a year-over-year increase, watching 51 hours and 10 minutes per week, up 0.6% from the previous year and up 8.4% over five years.
The chart below, which shows traditional TV consumption figures for each age bracket, illustrates how traditional TV viewing has been on a downward trend.
Traditional TV refers to all live TV viewing plus DVR/time-shifted TV viewing during the quarter.
Averaged among the entire population, meaning Nielsen includes those Americans who do not watch traditional TV.
Source: Nielsen Total Audience Report:4Q 2016
As consumers have moved away from traditional TV viewing, cable providers and networks have been reporting lower subscriber and viewer numbers:
- Nielsen reported that Disney-owned ESPN has lost 11 million subscribers since 2011, or more than 10% of its total customer base.
- Dish Network reported that, in the second quarter of 2016, it lost 281,000 customers, which included subscribers to the company’s growing Sling TV service (a web TV subscription service). This suggests that the actual losses for its satellite TV business were substantially higher.
Major TV networks are taking steps to increase their appeal among the younger generation of cord-cutters. NBC News, for example, has developed a new documentary unit called Left Field to target a younger audience that is more plugged in to social media. The group’s mandate is to create 4–10-minute documentary-style videos for the under-35 cohort. The short documentaries will appear on Facebook, YouTube, Instagram, Twitter, Snapchat and NBC’s digital websites. The documentary unit’s approach even incorporates new camera techniques and styles, such as drone footage and virtual reality storytelling.
Consumers Opt for Broadband, but Not Cable
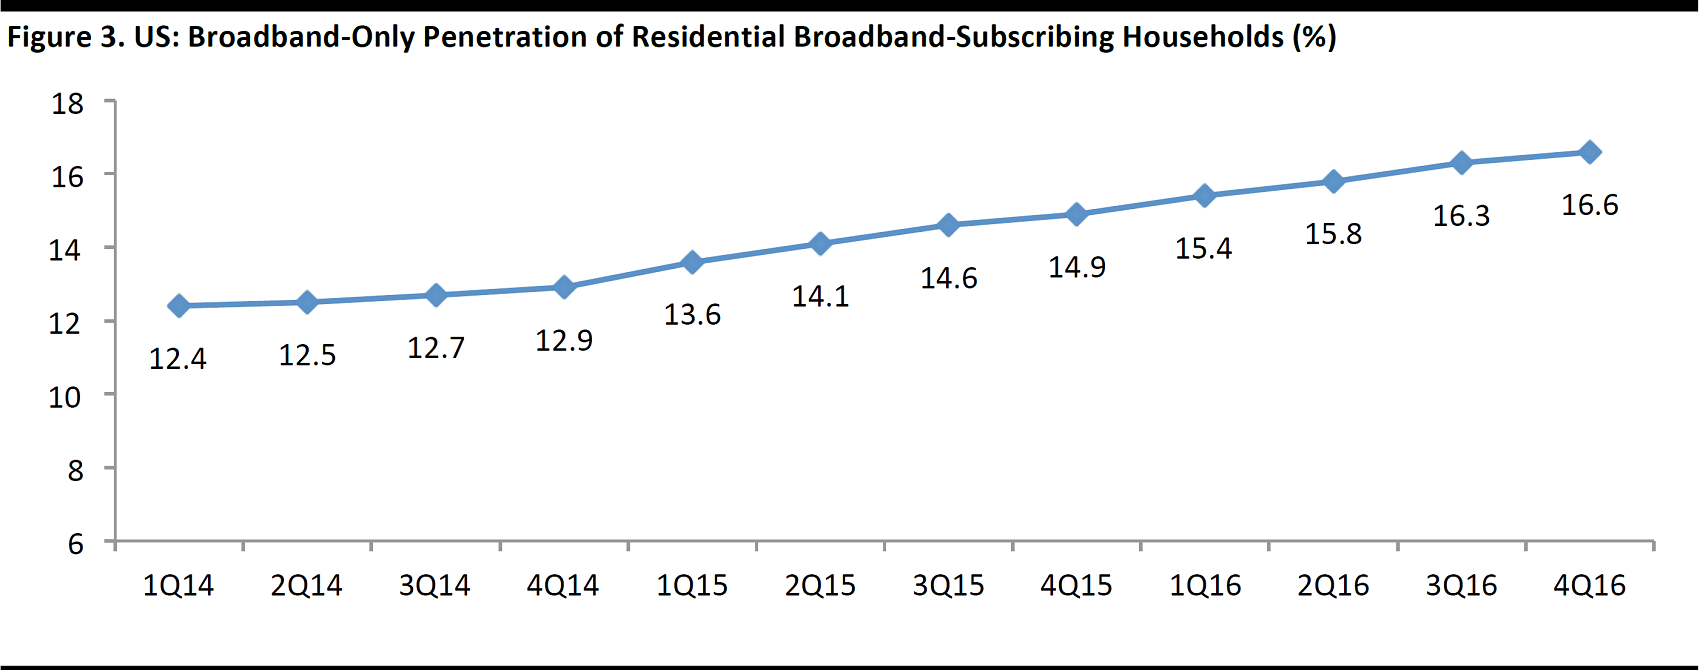
A growing number of US households are subscribing to broadband Internet service while cancelling their cable and satellite TV subscriptions. According to SNL Kagan, a group within S&P Global Market Intelligence, 16.6% of American households—or one out of every six—now have broadband but no cable. In 2016, the number of households with broadband that did not subscribe to traditional cable TV grew by more than 2 million, underscoring consumers’ willingness to use online alternatives to consume media.
Source: SNL Kagan
Netflix, Amazon and Hulu Catch Up to DVRs
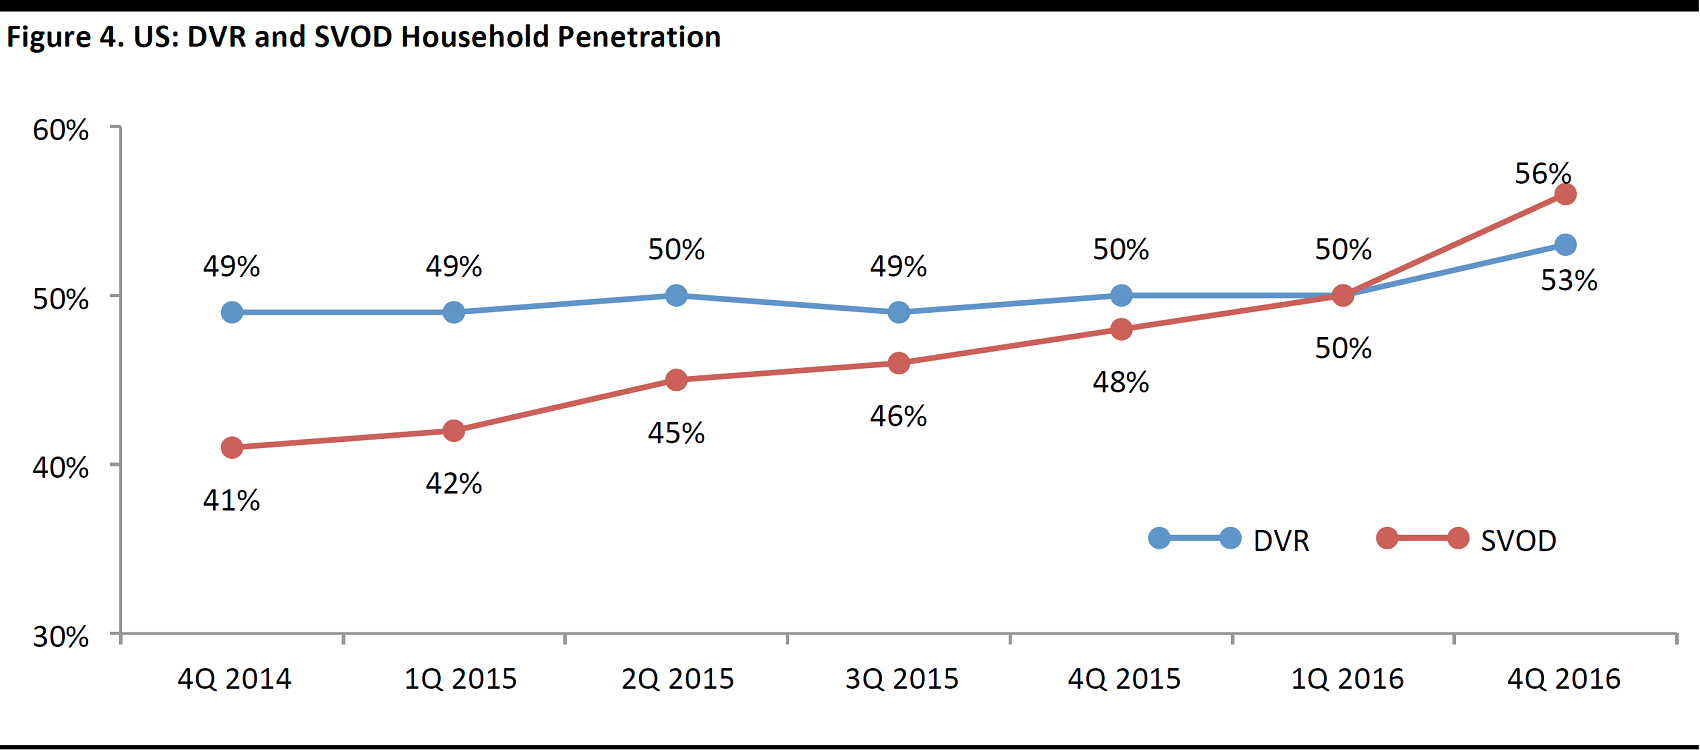
As younger generations watch less traditional TV with each passing quarter, they are seeking more online alternatives. Use of SVOD services such as Netflix, Hulu and Amazon Video has surpassed DVR use in US households. In the fourth quarter of 2016,56% of US households with a TV subscribed to at least one SVOD service, up 8% from a year earlier, according to Nielsen. Meanwhile, DVR penetration has flatlined in recent years, ranging between 49% and 53%. The graph below shows that SVOD penetration had surpassed DVR penetration in US households by the fourth quarter of 2016, with more than half of US households having access to each of these.
Source: Nielsen Total Audience Report:4Q 2016
SVOD services such as Hulu and Netflix are offering entry prices of about $40 a month, almost half the cost of a cable TV subscription and Netflix has seen substantial growth in subscriber numbers: in 2016, Netflix reported 93,796 global streaming memberships, up 25% from 2015. SVOD services are also offering technological differentiators such as personalization and vast digital video storage in addition to better pricing options than traditional cable companies offer.
Streaming Services Offering Live TV Options
New and existing players are launching SVOD services that offer live TV bundle options at a more reasonable price than traditional pay TV services. These options offer a selection of major cable channels that can be streamed through smart TVs, digital media players and apps, and they are starting to gain traction in the US. According to comScore’s OTT Intelligence service, in April 2017, 3.1 million US households subscribed to“skinny bundle” options, which feature content from multiple networks. As consumers replace their traditional pay TV services, Sling TV, PlayStation Vue and DirectTV now boast extremely high engagement on a per-household basis.
The following companies have launched live TV programming bundles in recent months:
- YouTube announced YouTube TV, a $35-a-month TV-streaming service, in February. YouTube is working with popular US cable channels—including ABC, Fox, CBS, NBC, Disney, ESPN and more than 40 others—and makes content from all of them available in one app. YouTube TV also has a built-in “unlimited DVR” feature that lets users tap any show to record a single episode and all future episodes.
- Hulu launched a streaming TV platform that costs $40 per month in the spring this year. There are no setup costs, and it features a personalized interface and brings together live and on-demand news, entertainment and sports across living rooms and mobile devices.
- DirectTV launched DirectTV Now in January 2017 to better compete with streaming services. DirectTV Now is an online streaming service that costs $35–$70 per month, depending on the number of channels selected by the user.
Mobile Usage Will Continue to Rise as Desktop/Laptop Usage Slows
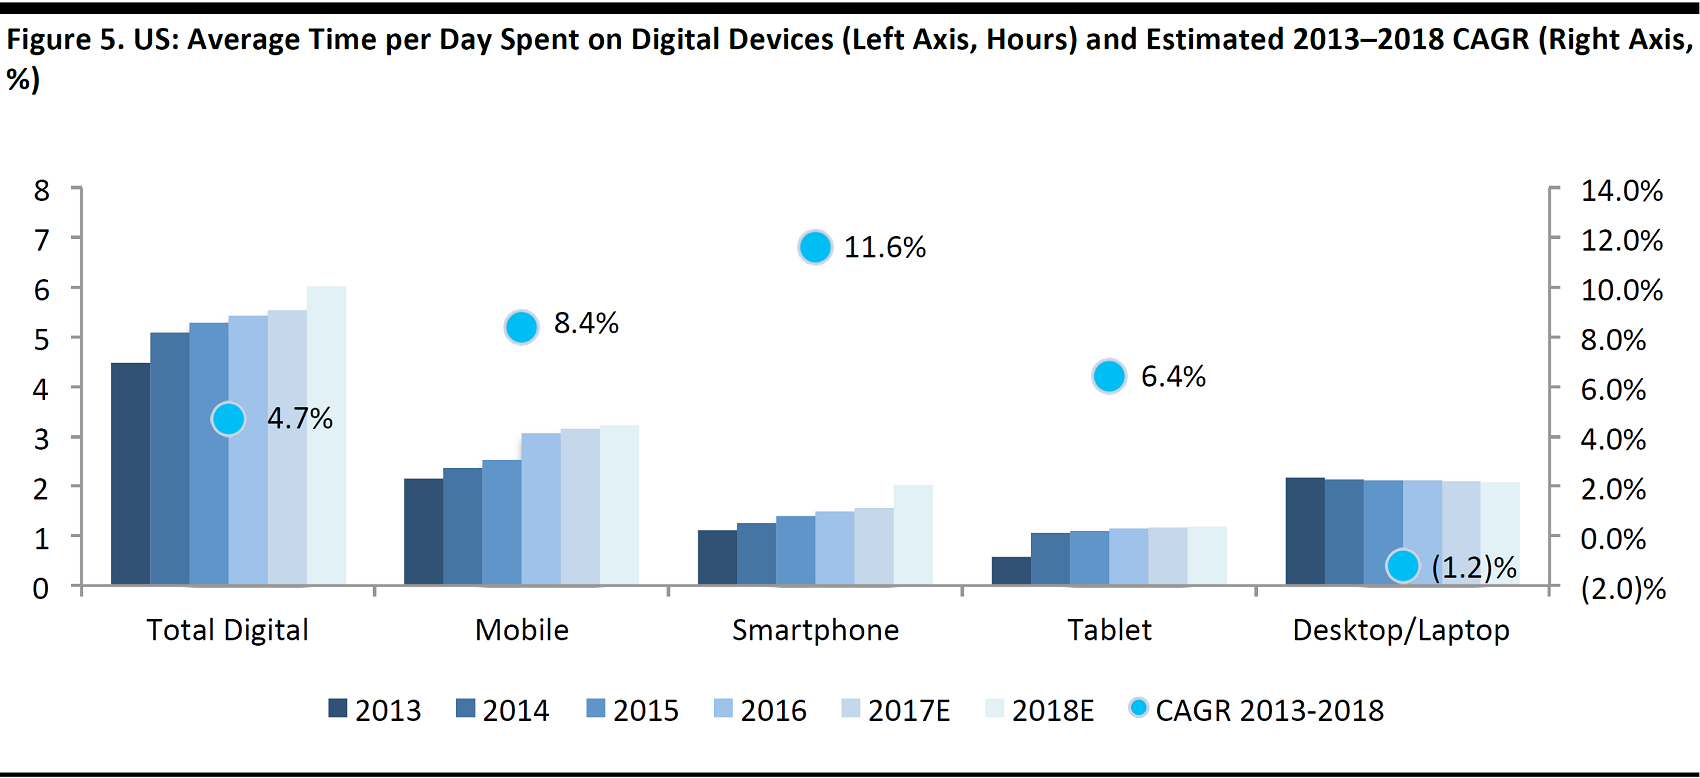
US adults’ mobile usage drove the majority of the increase in media consumption in the fourth quarter of 2016. According to eMarketer, the average time spent on mobile devices per day was three hours and six minutes (smartphone: 1:49, tablet: 1:14) and the average time spent on desktops/laptops was two hours and 11 minutes. Within the mobile category, consumers spend more time daily on smartphones than on tablets, and smartphones’ share of time spent on mobile is expected to grow at a faster pace.
eMarketer estimates that media consumption on mobile devices will grow at an 8.4% CAGR from 2013 through 2018, while media consumption on desktop and laptop devices will decline at a 1.2% CAGR over the same period. The graph below shows how many hours per day US consumers spend on various digital devices and the 2013–2018 CAGR estimates for each, according to eMarketer.

Base: US adults ages 18+ who use each medium at least once per month
Source: eMarketer
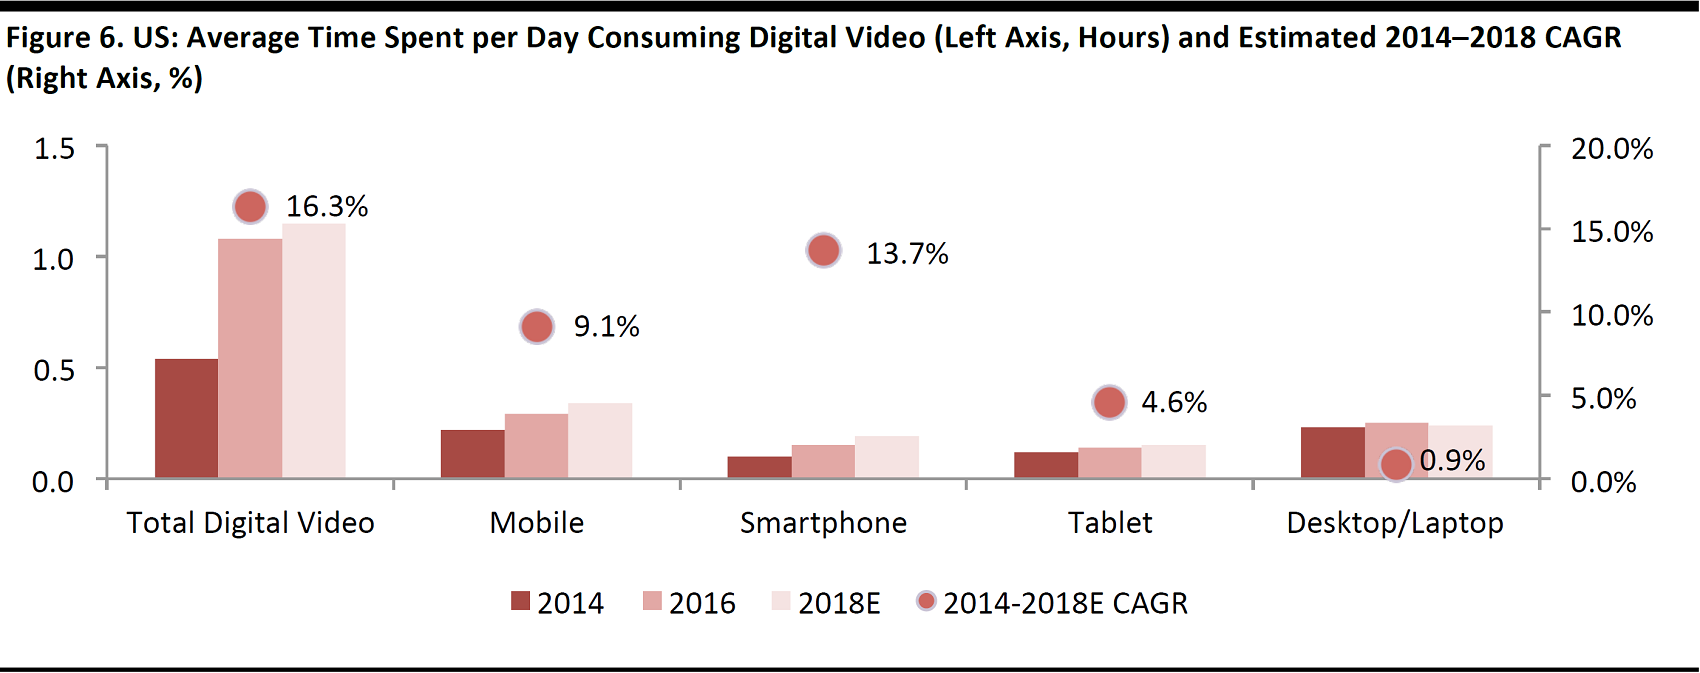
Consumers are engaging with more digital video content as well, and mobile devices are the platform of choice for viewing such video. According to eMarketer, the average time spent on mobile video consumption (smartphone and tablet) was 29 minutes per day in 2016, up from 22 minutes in 2014. Desktop/laptop video consumption averaged 25 minutes per day in 2016, up slightly from 23 minutes in 2014.
Base: US adults ages 18+ who use each medium at least once per month
Source: eMarketer
Social Media Platforms Are Driving Digital and Mobile Usage
The average US consumer spends nearly two hours per day on social media, and that activity is expected to continue to eat further into traditional media consumption (most notably, TV viewing), according to Common Sense Media. The amount of time consumers spend on social media varies by platform. YouTube comes in first, with the average user spending more than 40 minutes day on the platform, while the average Facebook user spends 35 minutes a day on Facebook. Snapchat and Instagram come next, with the average user spending 25 minutes and 15 minutes per day, respectively, on the platforms, according to business intelligence service L2.
Mirroring the digital video consumption trend, social media users are accessing social media via mobile devices more often than via desktop and laptop devices—andmobile devices account for 60% of time spent on social media. According to eMarketer, consumers averaged 29 minutes per day accessing social media via their mobile devices in 2016, up from 23 minutes in 2014. Meanwhile, they averaged 14 minutes per day accessing social media websites from desktops and laptops in 2016, down from 16 minutes in 2014. Underscoring mobile’s popularity among social media users is the fact that the majority of Facebook’s monthly active users access the platform via mobile only.

Source: Company reports
Reaching the Younger Digital Consumer
The younger demographic groups are popular targets for many retailers and brands, but not many companies have recognized that millennials and Gen Zers represent two very different generations. Gen Z, which we define as those born in 2001 or later, consume media differently than do millennials (born between 1980 and 2000).
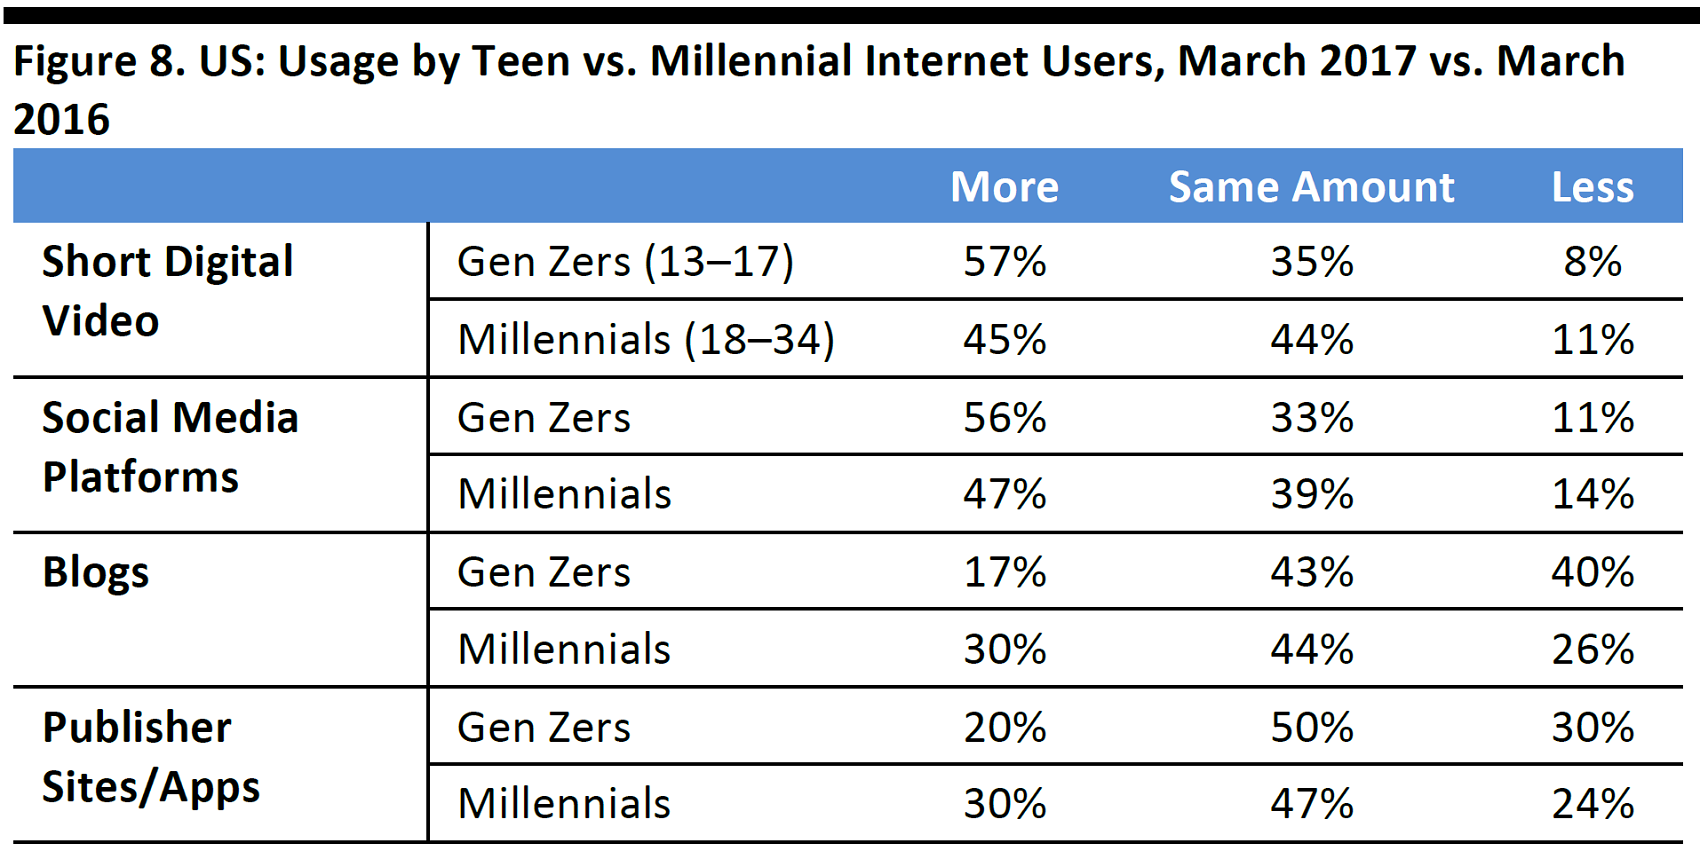
A major difference is that Gen Zerslargely prefer to watch rather than read. They view digital video and short clips almost six times as often as traditional digital publications/blogs, according to streaming and content provider Fullscreen and market research agency Leflein Associates. A separate study conducted by
Adweek and Defy Media surveyed 1,500 US teenagers, and found similar results: Gen Zers are shifting away from text-based online content such as blogs and articles on publishers’ sites while spending more time on video and social media platforms. YouTube, for example, remains the most widely accessed digital platform among Gen Zers, with 95% of teen respondents classifying themselves as users of the video service. When Gen Zers were asked which shopping platform they use for shopping recommendations, YouTube was number one, followed by Instagram and then Facebook. The table below highlights the shift among younger Internet users from text-based online content to video and social media content.
Totals may not sum due to rounding.
Source:Fullscreen/Leflein Associates/eMarketer
Media Consumption Drives Change in Retail Industry
Consumers’ shift away from traditional media toward more online content has forced retailers to adjust their digital media strategies. With people spending more of their daily lives engaging with digital media devices, the digital channel’s influence on retail sales continues to grow. According to a new report from market research firm Forrest, in 2016, $1.26 trillion in retail sales were affected in some way by digital media. Digital interactions, especially on mobile devices, drove more than half of every dollar spent in retail stores last year.
Digital Ad Spending to Surpass TV Ad Spending
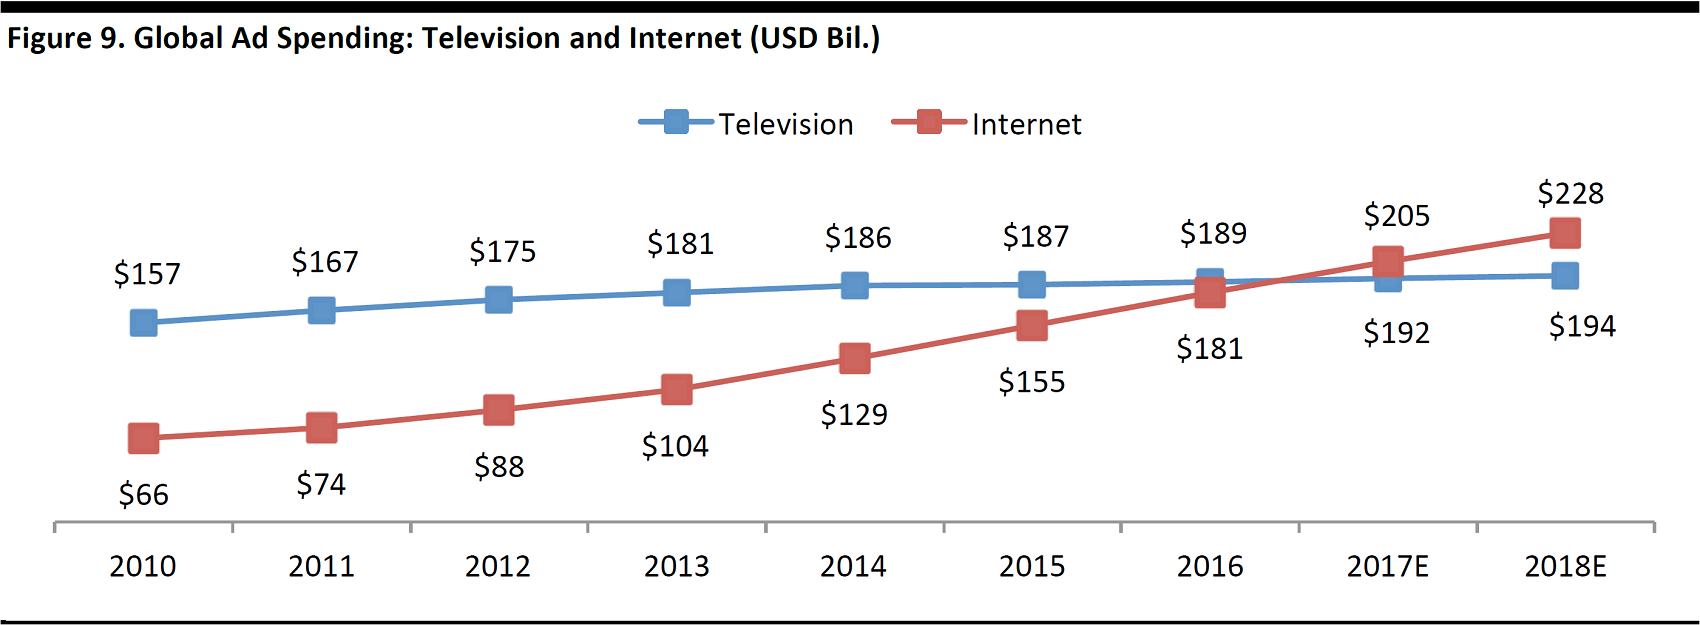
Global digital ad spending is projected to surpass TV ad spending for the first time in 2017, and the gap between the two is expected to widen by roughly $10 billion this year, according to Zenith Media. As shown in the graph below, Zenith Media projects that global digital ad spending will reach $205 billion in 2017, surpassing the projected $192 billion in TV ad spending. In addition, eMarketer estimates that the retail sector will spend $23.04 billion per year on digital ads by 2020, representing a 12% CAGR over a five-year period.
Source: Zenith Media
Retail Sector Digital Ad Spending Grew in 2016
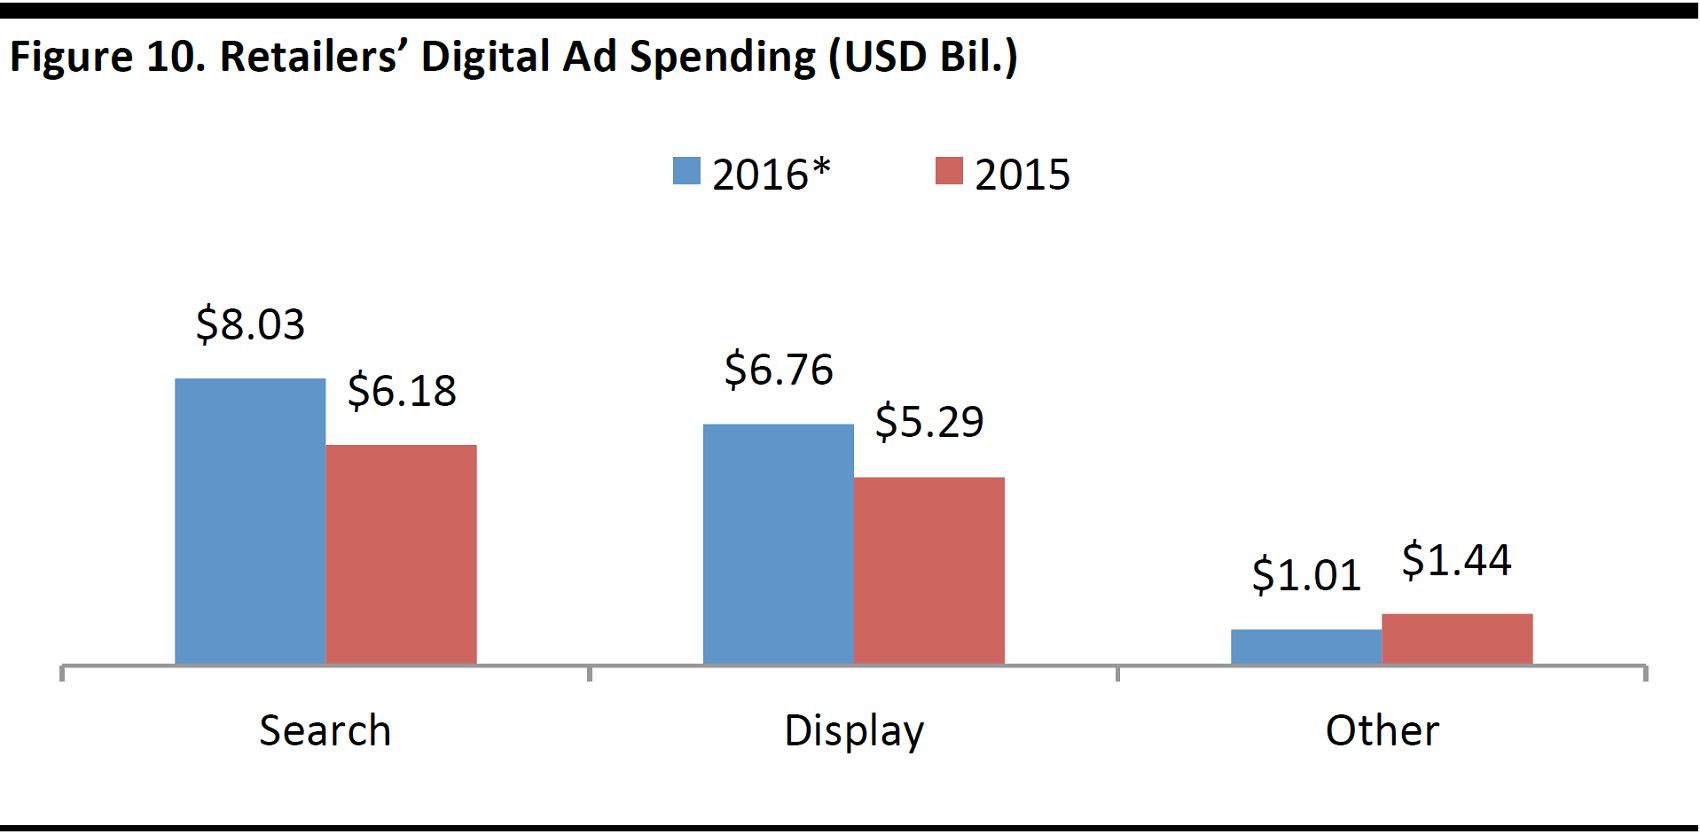
US retailers’ digital ad spending increased by 22.5% in 2016, to $15.81 billion, according to eMarketer estimates. More than half of those dollars were spent on paid search ads, a 3% increase from the previous year. eMarketer estimates that display ads—banners, rich media, sponsorships, video and social media ads, such as those that appear in Facebook’s news feed and Twitter’s timeline—accounted for 42.8% of digital ad spending in 2016, up from 41.0% in 2015. In terms of dollars, eMarketer estimates that retailers spent $6.76 billion on display ads in 2016, a 27.8% increase from $5.29 billion in 2015. Within the display ad category, retailers spent an estimated $2.04 billion on video ads in 2016, a 31.6% increase from $1.55 billion in 2015. eMarketer estimates that the remainder of digital ad spending in 2016 went to what it classifies as “other,” including classifieds, directories, email, lead generation and mobile messaging.
*Projected
Source: eMarketer
This past holiday season, several major retailers, including Amazon, Walmart, Target and Macy’s, significantly increased their digital ad spending while reducing their print ad spending. Amazon increased its digital ad spending during October and November by 224% year over year, according to digital marketing news website MarketingLand.com. Walmart spent 168% more on digital ads this past holiday season than it did over the 2015 holiday, while Target spent 161% more year over year and Macy’s spent 34% more.
Mobile Is a Necessity
Spending on mobile advertising will be a main driver of digital advertising growth in 2017. The retail sector’s investment in mobile advertising is expected to jump 52% in 2017, according to eMarketer, and mobile is projected to account for more than one-quarter of total media outlays this year. By 2019, mobile ad spending is projected to surpass ad spending on all traditional media (radio, magazines, newspapers and outdoor) except television.
Mobile ad spending will soon overtake desktop ad spending as well. Mobile accounted for 15.2% of total global ad spending in 2016, while desktop’s share was 18.9%, according to a Zenith Media, and the numbers keep shifting. By 2019, mobile is expected to account for a 27.2% share and desktop for a 14.7% share, or $163 billion for mobile compared with $89 billion for desktop, according to the firm.
Consumers’ shift to spending more time on mobile devices has had a major effect on the retail industry. Mobile traffic now accounts for more than 50% of all US retail website and app traffic, according to MarketingLand.com. M-commerce (tablet and mobile) represented 22% of total digital commerce dollars in the first quarter of 2017, up 19% from a year earlier, according to comScore. The increase reflects a clear shift among consumers; they are increasingly comfortable with the notion of using their mobile devices—whether iPhone, Android phone or tablet—to shop and buy.
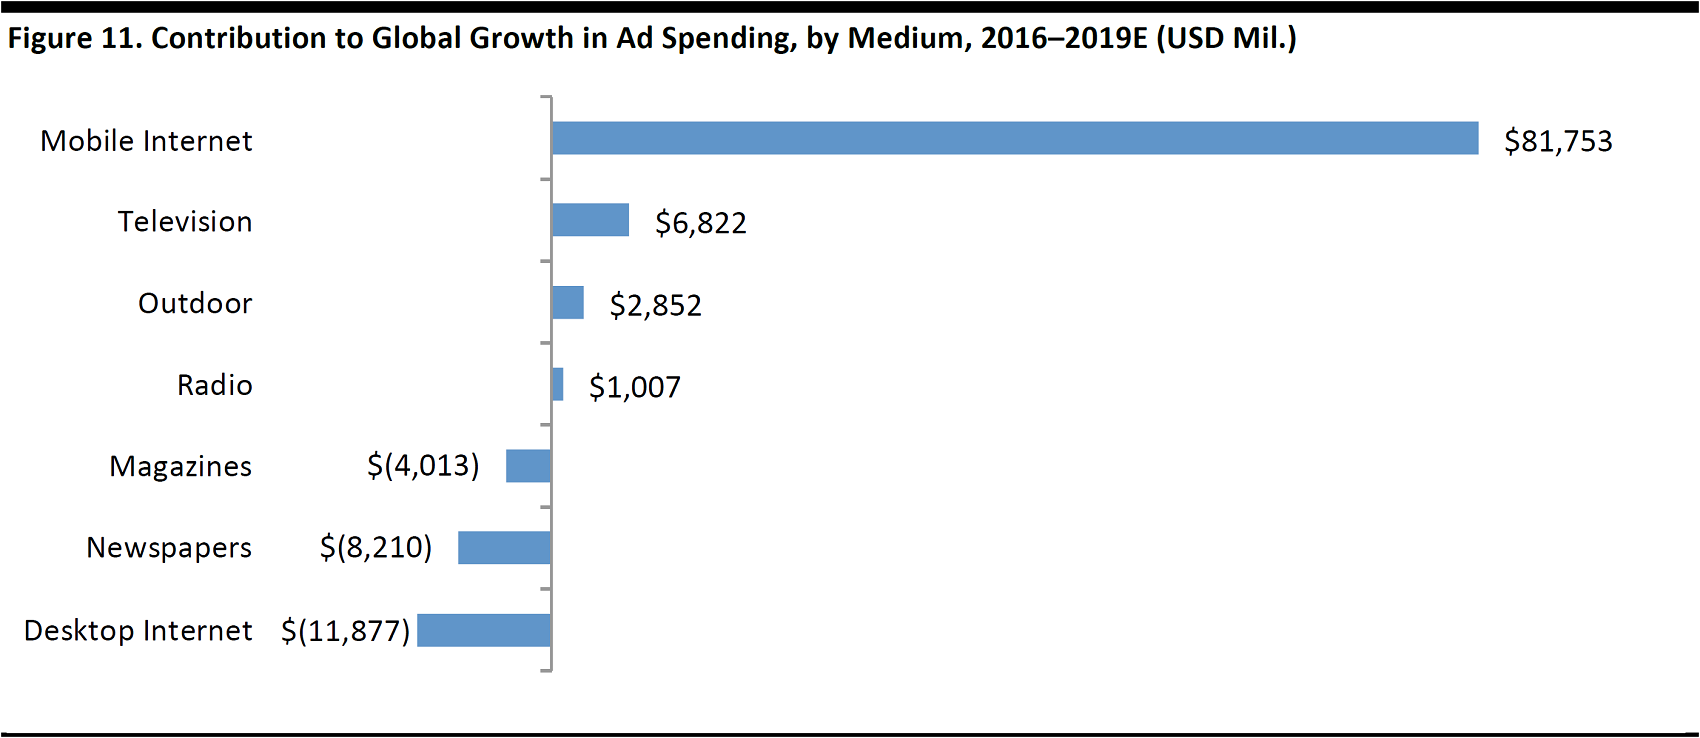
The graph below shows the contribution to global growth in ad spending by medium. Zenith Media predicts that mobile Internet ad spending will outpace spending on all other platforms, contributing $81,753 million from 2016 to 2019.
Source: Zenith Media
Mobile Apps Offer Benefits, but Adoption Remains Slow
Some retailers have proven that a mobile app can significantly increase in-store sales. For example, Walmart claims that those customers who have installed the company’s app visit Walmart’s physical stores, on average, twice as often as those who have not installed the app. Incorporating app features such as geotargeted mobile alerts, streamlined click-and-collect options and customer loyalty programs can help brick-and-mortar retailers leverage their physical presence.
While mobile apps can be a critical touchpoint for driving shopping and buying, it is difficult for many retailers to convince customers to download and use their apps. According to comScore’s
State of the US Online Retail Economy report, nearly seven out of 10 smartphone users access only three or fewer mobile retail apps in a typical month. Thus, retailers should consider engaging on platforms that their customers are already using—meeting those customers where they are—rather than trying to build everything themselves. If shoppers find inspiration on a particular social media platform, for example, they should be able to purchase directly from retailers via that platform.
Social Media Networks Remain Robust
With consumers spending more time on social media networks, such platforms are an increasingly important space for retailers to reach target audiences. Advertisers spent $23.7 billion on paid social media in 2015, and spending is expected to reach $35.9 billion this year, according to cloud services company Instart Logic. Aside from Google, Facebook is the largest source of referral traffic for retail brands. The platform generates 3.1% of incoming traffic to retailers’ sites, more than email or display advertising, according to L2.
Source: iStockphoto
Retailers can use social networks to better understand their customers and improve their offerings. Nordstrom, for example, tracks popular items pinned on social network Pinterest, and then displays them in stores and labels them as “top-pinned items” with a logo. By incorporating social media feedback into the shopping experience, Nordstrom ensures that merchandise in stores is personalized and better aligned with what shoppers actually want.
Online Video Consumption Gains Influence; Visual Storytelling
As discussed earlier, younger consumers are becoming harder and harder to reach through traditional channels such as television. Their attention is straying to other activities, including streaming, and online video consumption continues to grow. Accordingly, the number of videos published by retail brands has increased considerably, according to social media intelligence platform Unmetric. In 2015, videos accounted for 12.3% of total content published: in 2016, that rate was 27.2%.
With increasing video capabilities on social media, visual storytelling is becoming a key social media strategy. In addition, more content formats for advertising have become available to retailers. In recent years, Instagram and Snapchat have introduced “Stories” features that enable more robust and strategic storytelling, and Pinterest has launched promoted videos. Brands can enhance their mobile app experiences by introducing fully shoppable content that enables consumers to instantly “shopthelook” they see and buy items directly from the platform.
Social media advertising is also trending toward visual storytelling and video. A number of retailers have created influential social media campaigns that use these techniques:
- In August 2016, Crew launched its first Instagram sale to generate buzz for a pair of pink sunglasses. Using a shoppable link in the J.Crew Instagram bio, shoppers were able to immediately purchase the sunglasses without having to leave the platform.
- Target utilized a Snapchat facial recognition lens to promote the release of men’s grooming brand Harry’s at Target stores. The retailer used social media to announce the news. For a short period of time, Snapchat users received a “clean shave” via the platform’s facial recognition lens in honor of the new Harry’s-Target partnership.
- Apparel retailer Everlane used Snapchat to make announcements and launch behind-the-scenes exclusives. One campaign included a secret shop containing limited-edition items that was open to customers only at specific times, as posted on Snapchat. The company helped its followers find the shop through a sequence of interactive tasks, concluding the story in the company’s New York office, where the location of the store was then revealed.
How Retail Could Evolve: Looking at Media Disruption
Traditional media engagement has lagged since the early1990s, when TV, print media and radio consumption began to taper off amid emerging online competition. Technological advancement—driven by greater wireless connectivity and advanced applications—has disrupted traditional media channels, and emerging channels, such as streamed online content and social media, offer cost structures that are superior to those of traditional channels. Furthermore, the newer, interactive formats hold significant appeal for younger generations. The low cost of modern media technology means that almost anyone can afford to put up a video on YouTube today. As a result, people consume more media from more sources.
We see parallels between the disruption taking place in media and the disruption taking place in the retail industry. Retail, like media, has seen traditional channels (brick-and-mortar stores) face increased competition from new digital entrants. Both industries have suffered from similar forces, including low barriers to entry that have led to more agile competition and legacy business models that continue to generate the majority of their revenue.
In the mid-1990s, a flock of Internet-based retailers—including Amazon.com and Pets.com—embraced online shopping business model, but the trend slowed some what from 2000–2002, around the time that the dot-com bubble burst. Since the early2000s, however, the pace of technological advancement has accelerated, offering ubiquitous Internet connectivity (reflected by the rise of Internet penetration), smart devices and social media. Over time, the retail industry has been forced to deal with a number of disruptive factors, including:
- The speed of technological changes
- Shifts in US demographics and consumer behaviors
- Challenges to existing economic models
- A desire for transparency from knowledge-centric shoppers
Ripple Effects of Changing Consumer Behavior
As TV consumption habits shift, traditional media companies are making moves across a number of different fronts, trying out new distribution channels, creating new types of programming aimed at a mobile-first audience, and partnering with innovative digital media companies to be able to meet consumers wherever they are. Examples of these include NBC's aforementioned Left Field documentary studio and cable providers offering TV programming bundles and mobile apps for viewing.

Source: iStockphoto
Retail is following similar steps as it undergoes similar disruption. Over the coming decade, the pressures of competition and the range of digital shopping solutions will, most likely, force retailers to reconsider the value of their original operating formats. Many will need to transition from their legacy business models and embrace nontraditional models such as pure plays, flash websites, smaller-format stores and pop-up shops. Retailers will have to rethink their “one size fits all” approach. We have already seen some retailers start to diversify their portfolios by testing urban or small-footprint formats, and this trend will likely accelerate in the coming years.
Younger consumers, in particular, are driving change in retail as they look for convenient ways to consume. Millennials and Gen Zers represent a new shopper segment, one with a deal-seeking attitude and different expectations and preferences regarding product offerings and shopping.
And while shopping on a small screen used to be a pain, retailers are getting savvier about their mobile apps. As consumers spend more time glued to their smartphones, retailers are making apps that are easier to browse and that offer rewards, suggest the right products and simplify the purchase experience. Retailers also have an opportunity to create impulse buying moments through push notifications and text messages sent to shoppers’ smartphones. Some retailers’ recent initiatives on this front include:
- Target pushes coupons to in-store customers who have the app open.
- Fashion retailer ModCloth suggests products based on a customer’s location.
- Walmart and Nordstrom have tested ways to tie in mobile shopping with stores. Customers can check in to a store through these apps, which enables salespeople to access those customers’ purchase history, leading to a quicker and more personalized shopping experience.
Conclusion: Traditional and Digital Can Coexist
Although digital media consumption and e-commerce retail sales continue to encroach on traditional media and retail channels, they can all coexist. Radio did not kill print, and TV did not kill radio. Nor will the Internet kill traditional retailing. Each wave of change does not remove what came before it; rather, it reshapes the landscape and reinvents consumer expectations. The relationship between traditional and new media models will continue to evolve as will the relationship between traditional and new retail models.
In both digital media and retailing, forward-thinking companies will leverage the vast amounts of data they possess to enable targeted marketing, tailored offerings and effective pricing strategies. There is definitely no threat of traditional TV going anywhere anytime soon. But, given the historical data over the past few years, it is likely that consumers will continue to shift their media consumption away from traditional TV and toward other channels. In retail, brands will need to be integrated across physical, digital and media touch points in order to be present and interact with consumers wherever they happen to be.


