DIpil Das
The Coresight Research US Retail Traffic and In-Store Metrics series reviews changes in selected store-based metrics, as reported by RetailNext. In this month’s report, we review store traffic changes through December 2021—which saw an overall deceleration in traffic growth, with trends impacted by rise in Covid-19 cases. This series usually reviews year-over-year changes in store-based metrics; however, all March, April, May, June and July 2021 data in this report are compared to 2019, while August, September, October, November and December 2021 data are compared to 2020—since stores began closing in March 2020 due to Covid-19 and most stores were closed in April, May, June and July 2020, but began reopening in August and most were open in September, October, November and December.
December saw decelerated growth in traffic trends: Traffic registered 32.6% growth in December, lower than November’s 39.3% increase year over year.
Figure 1. US Store-Based Nonfood Retail Metrics: YoY % Change [caption id="attachment_139628" align="aligncenter" width="700"]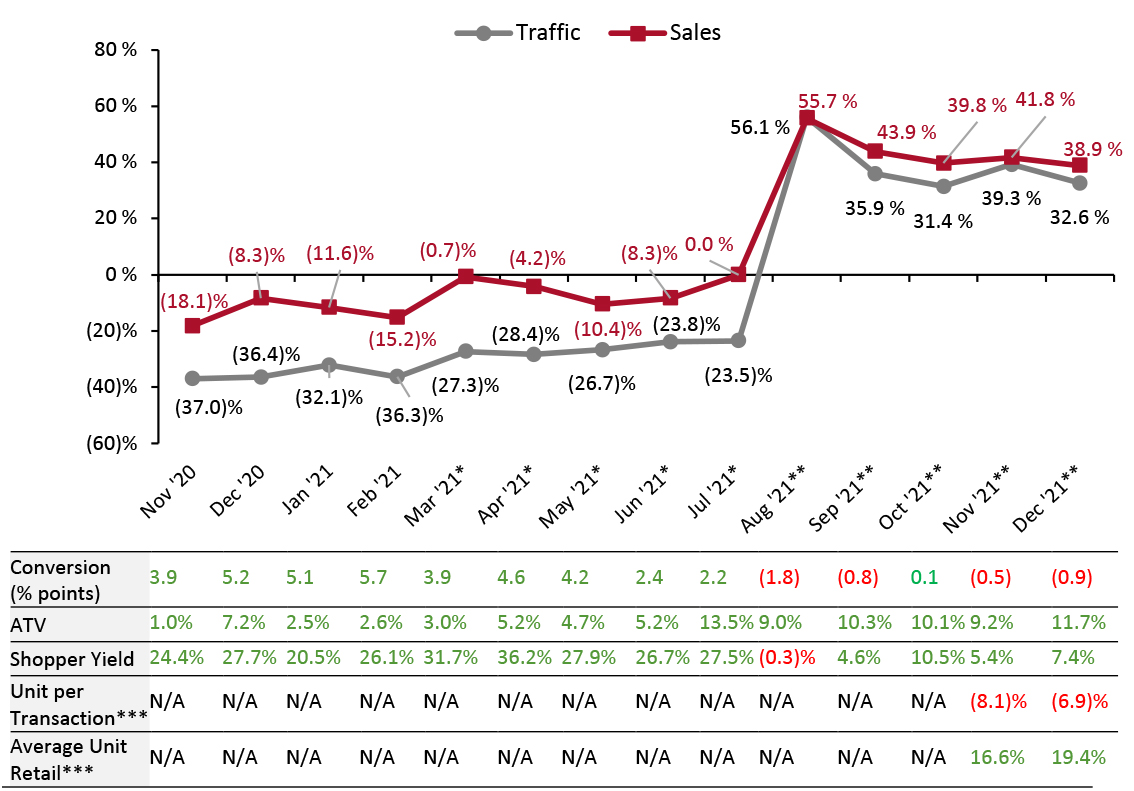 ATV=average transaction value; Shopper yield=Sales divided by traffic
*March, April, May, June and July 2021 numbers are compared to 2019 as stores began closing in March 2020 due to Covid-19 and most stores were closed in April, May, June and July 2020.
**August, September, October and November 2021 numbers are compared to 2020 as stores began reopening in August and most were open by September, October, November and December.
***RetailNext started providing data on these from November 2021.
Source: RetailNext [/caption] Weekly Shopper Traffic Trends Weekly data for December tracks the progress of store traffic over five weeks (November 28, 2021–January 1, 2022):
Figure 2. US Retail Traffic by Industry Vertical: YoY % Change [caption id="attachment_139629" align="aligncenter" width="700"]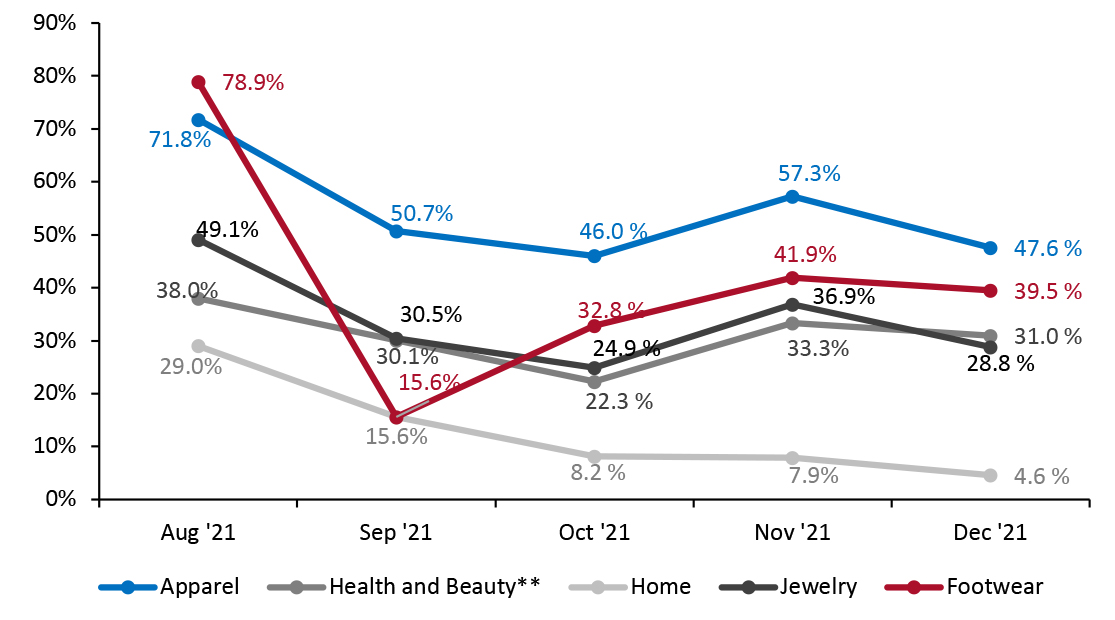 RetailNext started providing traffic trends by vertical on a year-over-year basis from August 2021.
Source: RetailNext [/caption] Regional Traffic Trends The number of new Covid-19 cases surged in December as the contagious Omicron variant swept across the country with the first case confirmed in California on December 1. Early in Week 4, Washington D.C. reintroduced mask requirements for most indoor public areas, including gyms and grocery stores, in response to an increase in Covid-19 cases. In Week 4, the city of Atlanta reimposed indoor mask mandates for retailers and other enterprises. Retail traffic in December varied across regions:
- In December, ATV (average transaction value, or sales divided by transactions) increased by 11.7%, 2.5 percentage points higher than November’s growth of 9.2%, reflecting a trend toward the consolidation of shopping trips (fewer visits, bigger baskets) when Covid-19 cases increase.
- The conversion rate (sales transactions as a percentage of traffic) decreased by 0.9 percentage points in December, deteriorating from November’s 0.5 percentage points decline.
- Shopper yield (sales divided by traffic) increased by 7.4% in December, up from November’s 5.4% growth year-over-year.
- Unit per transaction (number of items purchased divided by number of transactions) decreased by 6.9% against November’s 8.1% decline.
- Average unit retail (net sales divided by units sold) increased by 19.4%, up from November’s 16.6% growth.
Figure 1. US Store-Based Nonfood Retail Metrics: YoY % Change [caption id="attachment_139628" align="aligncenter" width="700"]
ATV=average transaction value; Shopper yield=Sales divided by traffic *March, April, May, June and July 2021 numbers are compared to 2019 as stores began closing in March 2020 due to Covid-19 and most stores were closed in April, May, June and July 2020.
**August, September, October and November 2021 numbers are compared to 2020 as stores began reopening in August and most were open by September, October, November and December.
***RetailNext started providing data on these from November 2021.
Source: RetailNext [/caption] Weekly Shopper Traffic Trends Weekly data for December tracks the progress of store traffic over five weeks (November 28, 2021–January 1, 2022):
- On a week-by-week basis, traffic performance displayed a mixed trend as the month progressed, recording the strongest performance in the third week on a year-over-year basis and the weakest in the fourth—likely impacted by the rise in Covid-19 cases.
- In the first week, traffic increased by 33.8%—deteriorating from the final week of November, which saw a traffic increase of 47.2%.
- Traffic growth decelerated to 30.4% in the second week of December before accelerating to 34.4% in the third week. In the fourth week, traffic growth again decelerated to 28.1% but accelerated to 31.8% in the fifth week.
- Apparel was the strongest performing category in December, witnessing a 47.6% increase in traffic, as shoppers purchased outfits for holiday gatherings and gifts.
- In December, footwear was the second-strongest category, increasing by 39.5% year-over-year and 240 basis points lower than November.
- The health and beauty category saw a traffic increase of 31.0% on a year-over-year basis; and decreased by 230 basis points from November.
- Traffic in the jewelry category increased by 28.8% year-over-year, declining 810 basis points below its November level.
- The softest growth was seen in the home category, which recorded a 4.6% year-over-year traffic increase.
Figure 2. US Retail Traffic by Industry Vertical: YoY % Change [caption id="attachment_139629" align="aligncenter" width="700"]
RetailNext started providing traffic trends by vertical on a year-over-year basis from August 2021. Source: RetailNext [/caption] Regional Traffic Trends The number of new Covid-19 cases surged in December as the contagious Omicron variant swept across the country with the first case confirmed in California on December 1. Early in Week 4, Washington D.C. reintroduced mask requirements for most indoor public areas, including gyms and grocery stores, in response to an increase in Covid-19 cases. In Week 4, the city of Atlanta reimposed indoor mask mandates for retailers and other enterprises. Retail traffic in December varied across regions:
- The West was the best performer, as traffic increased by 42.5% year-over-year. The traffic trend in mid to end of December was lower than the first two weeks, likely caused by the colder and wetter weather.
- The traffic in Northeast was the second-best performer, increasing by 37.2% compared to 2020. The trend declined throughout the first fourweeks but began to rise near the end of the month. In Week 3, New York City enacted mask laws in indoor public areas to mitigate the number of Covid-19 cases.
- The Midwest’s traffic increased by 30.2% year-over-year. The storm that brought record-breaking winds and tornadoes to Iowa, Kansas, and Wisconsin affected the third and fourth weeks in December, resulting in the lowest comp.
- The South experienced the softest traffic trend impacted by the storm causing devastating damage to Kentucky and other states as it registered overall growth of 20.6%.
- Traffic by mall location type increased between 7.0% and 58.9% year over year.
- Luxury locations outperformed all other location types, increasing by 58.9%.
- Other locations, including airports, casinos and hotels, performed next best with traffic increasing by 56.1%, followed by outlet locations, which saw a 40.5% traffic increase year over year.
- Traditional malls and lifestyle centers registered growth of 39.8% and 38.9%, respectively.
- Strip malls registered growth of 18.2% while the street-front/freestanding locations witnessed the softest trend with traffic growth of 7.0% year over year.