
albert Chan
US Retail Sales: December 2021
Coresight Research’s measure of core retail sales is the unadjusted year-over-year change, excluding sales of gasoline and motor vehicle and parts dealers. This metric remained strong in December, as US retail sales grew 13.3% when compared to 2020. However, this is a slight deceleration from November’s revised 14.7% year-over-year growth, according to data released by the US Census Bureau on January 14, 2022.
For the final quarter—our benchmark of total holiday demand—retail sales increased by an unusually strong 12.9% year over year to $1.25 trillion. This exceeded even our bullish estimate of 9–10% growth year over year. The two-year pace of change for the holiday quarter came in at 23.3%.
Retail sales growth slowed sequentially in December, possibly reflecting some shopping pulled forward into November, when sales were up almost 15% versus 2020. In our most recent check on holiday expectations in November, around 30% of consumers indicated that they were starting holiday shopping earlier than in pre-pandemic years and nearly 40% of consumers indicated they were concerned about product availability for holiday purchases. At the same time, October was the weakest month of the holiday quarter on a year-over-year basis, suggesting that November was the main beneficiary.
Figure 1. US Total Retail Sales Excluding Gasoline and Automobiles: YoY % Change [caption id="attachment_139566" align="aligncenter" width="700"]
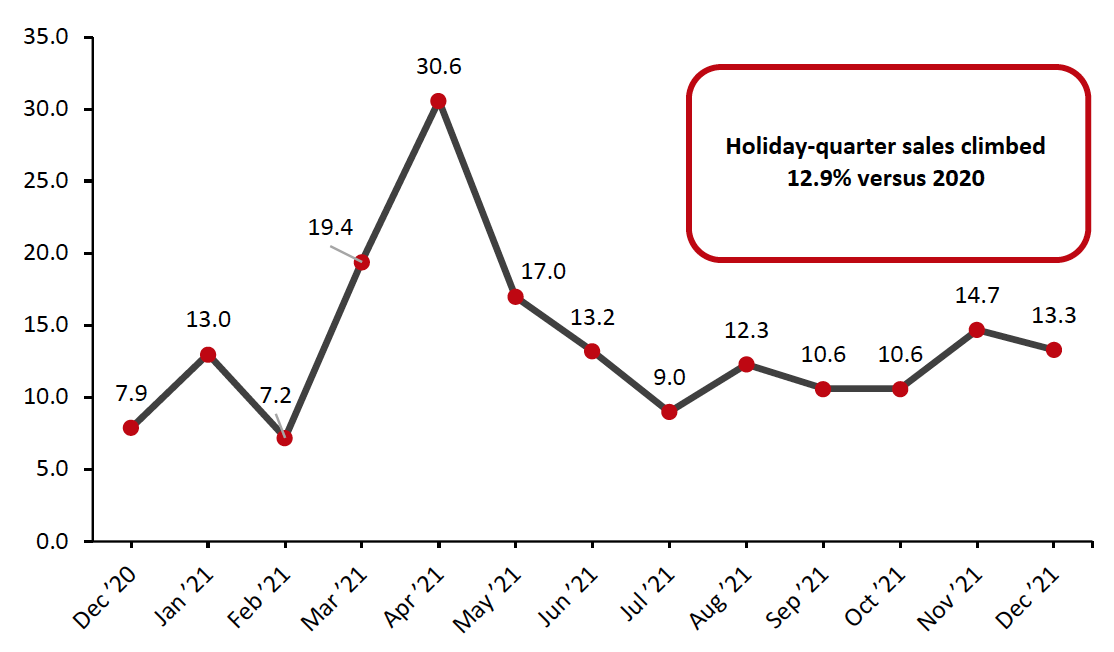 Data are not seasonally adjusted
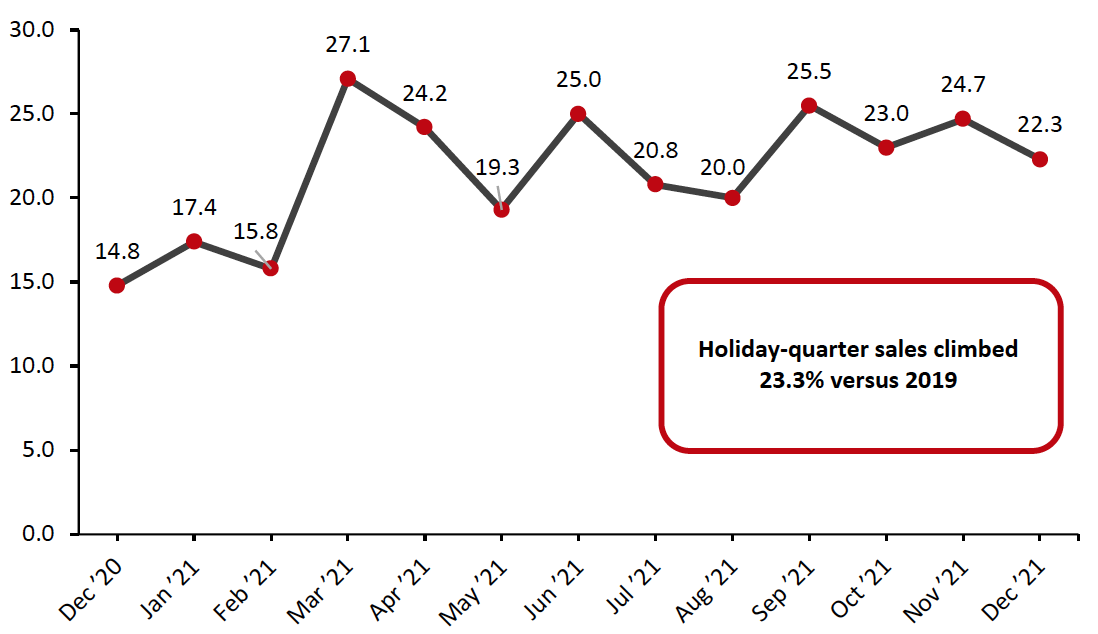
Source: US Census Bureau/Coresight Research[/caption] In relation to the more consistent comparatives of 2019, December retail sales remained in line with recent two-year growth trends, although lagging slightly behind October and November’s two-year growth. Retail sales grew 22.3% from 2019 values in December.
Figure 2. US Total Retail Sales Excluding Gasoline and Automobiles: % Change from Two Years Prior [caption id="attachment_139544" align="aligncenter" width="700"]
 Source: US Census Bureau/Coresight Research[/caption]
Seasonally adjusted retail sales, including automobiles and gasoline, grew 14.4% year over year, decelerating from November’s 16.2% growth. In December, the sales of motor vehicles and parts dealers very slightly declined compared to November, remaining mostly flat, reflecting the persistent impact of the global semiconductor shortage on the auto industry. Additionally, sales at gasoline stations declined month-over-month as gas prices began to fall in December. On November 22, President Biden announced that his administration would utilize the Strategic Petroleum Reserve (SPR) to release 50 million barrels of oil in attempt to combat fuel price inflation. Consequently, gas prices began to decline in December but remain high.
Figure 3. US Total Retail Sales Including Gasoline and Automobiles: Seasonally Adjusted YoY % Change [caption id="attachment_139545" align="aligncenter" width="700"]
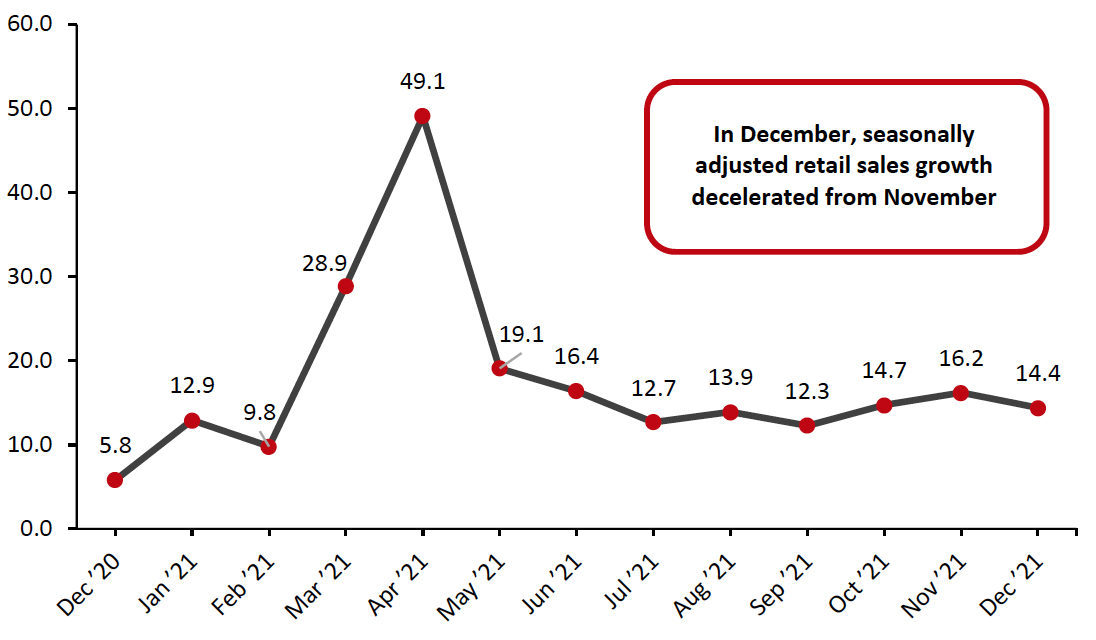 Data are seasonally adjusted
Source: US Census Bureau/Coresight Research[/caption]
Sales Decrease Month-over-Month
On a month-over-month basis, seasonally adjusted sales (excluding automobiles and gas) were negative in December, as consumers likely wrapped up holiday shopping earlier this year compared to previous years. Despite the month-over-month slowdown in sales, the holiday season performed strongly.
Figure 4. US Total Retail Sales ex. Gasoline and Automobiles: MoM % Change
[caption id="attachment_139546" align="aligncenter" width="700"]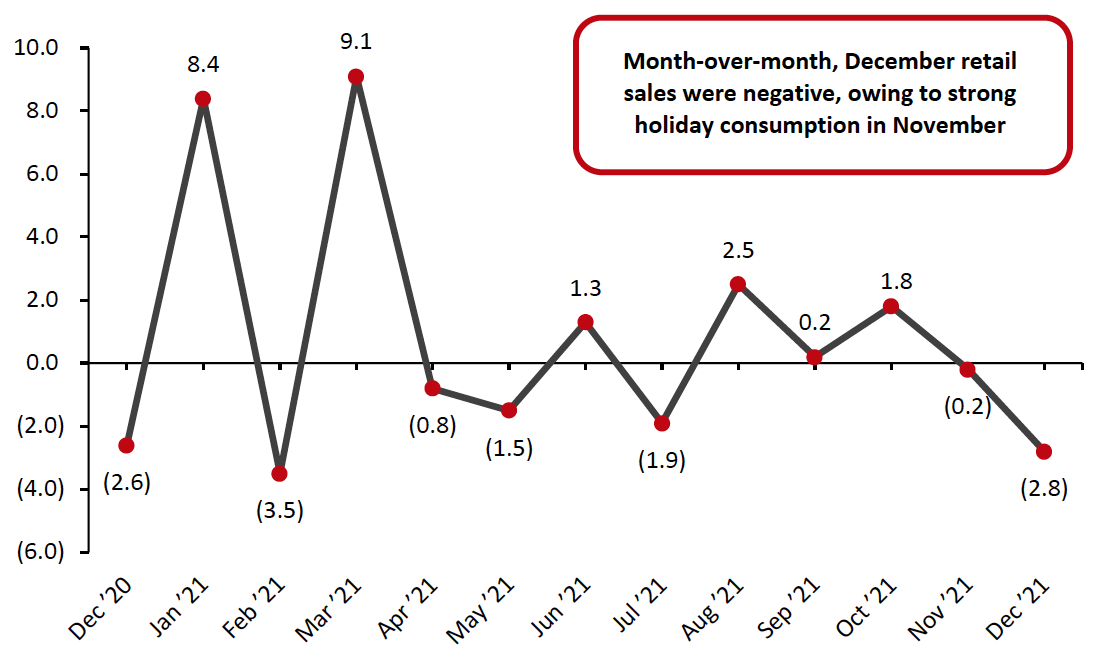 Data are seasonally adjusted
Source: US Census Bureau/Coresight Research[/caption]
Retail Sales Growth by Sector
To control for the effects of the pandemic in 2020’s retail sales figures, we largely compare December’s 2021 sales to pre-pandemic December 2019 sales in this section.
In a very strong month, several sectors saw sales growth of roughly 15% or more from 2019 levels:
- To close out the year, miscellaneous store retailers saw the highest two-year growth of any sector in December, growing 39.6% compared to 2019. Year-over-year, miscellaneous store retailers saw sales grow by 22.5%
- Sporting goods, hobby, musical instrument and bookstores continued to see high two-year growth of 39.5%, remaining in-line with November’s two-year growth of 39.8%. Compared to a year ago, the sector saw sales increase by 19.1%
- Clothing and clothing accessory stores continued to perform strongly in December, growing a strong 18.5% compared to pre-pandemic 2019 values, and 29.3% when compared to December 2020. This supports our expectation of strong recovery in the overall US apparel and footwear market in 2021.
- Nonstore retailers saw sales grow by 28.6% on a two-year basis. While this metric remains strong, it is a considerable slowdown from November’s 44.8% two-year growth. Compared to a year ago, nonstore retailers saw sales increase by 9.7%. Healthy sales growth in this sector, even as stores across the country are open without restrictions, suggest that e-commerce is continuing to grow as we close out 2021.
- General merchandise stores sales grew by 14.8% on a two-year basis, remaining largely in line with November’s two-year growth. The department stores subsector saw sales modestly increase by 1.2% compared to pre-pandemic 2019.
- Furniture and home-furnishings stores—which did not perform nearly as well as home-improvement retailers amid the outbreak of Covid-19—continued a strong year of recovery, growing 20.6% in December from 2019 levels.
- Food and beverage stores continued to see elevated sales, rising 20.5% from 2019 levels while year-over-year growth stood at 9.3%. Grocery stores saw 19.8% growth from 2019 and 8.9% growth from 2020.
- Electronics and appliance stores are feeling the tangible impact of the global microchip shortage, seeing sales increase only incrementally compared to 2019. On a two-year basis, sales grew by 0.2%, after growing 0.8% (revised) in November. Compared to 2020, electronics and appliance store sales growth was more positive, at 15.1%.
Figure 5. US Total Retail Sales, by Sector: YoY % Change from 2020 (Top) and 2019 (Bottom) [wpdatatable id=1617] [wpdatatable id=1618] Data are not seasonally adjusted Source: US Census Bureau/Coresight Research