DIpil Das
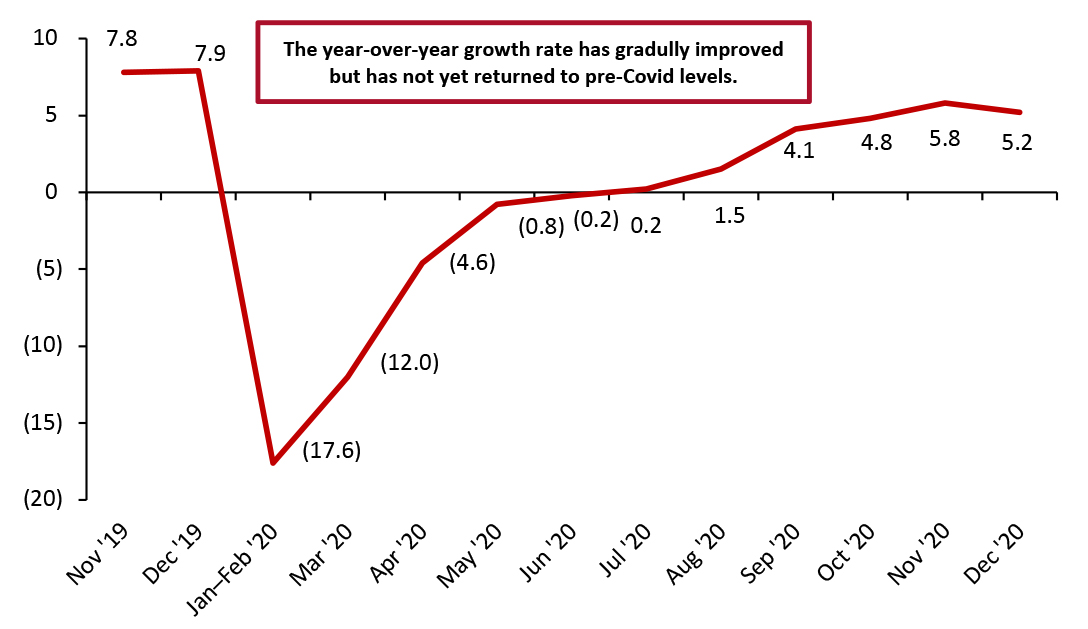
In December, China’s total retail sales (ex. food service, but incl. automobiles and gasoline) jumped 5.2% year over year, maintaining similar overall growth to November’s 5.8%. In 2020, retail sales totaled ¥35.2 trillion ($5.5 trillion) with a 2.3% year-over-year decrease, which is very close to Coresight Research’s estimate of ¥35.4 trillion with a 3% year-over-year decrease.
The 2.3% decrease is fairly moderate given the early impact of the Covid-19 crisis on retail in China, with sales falling more than 17% year over year in January and February—a period that would usually see strong sales leading up to Chinese New Year.
Figure 1 shows that total retail sales gradually recovered throughout the year. July saw the first positive year-over-year growth rate in 2020. By November, that growth rate had steadily increased to 5.8%.
Figure 1. Total China Retail Sales (Ex. Food Service; Incl. Automobiles and Gasoline): YoY % Change [caption id="attachment_122368" align="aligncenter" width="725"] January and February figures reported together
Source: National Bureau of Statistics/Coresight Research [/caption] Retail Sales Growth by Sector Several sectors saw strong year-over-year sales growth:
Figure 2. China Total Retail Sales (Ex. Food Service; Incl. Gasoline and Automobiles), by Sector: YoY % Change [wpdatatable id=714]
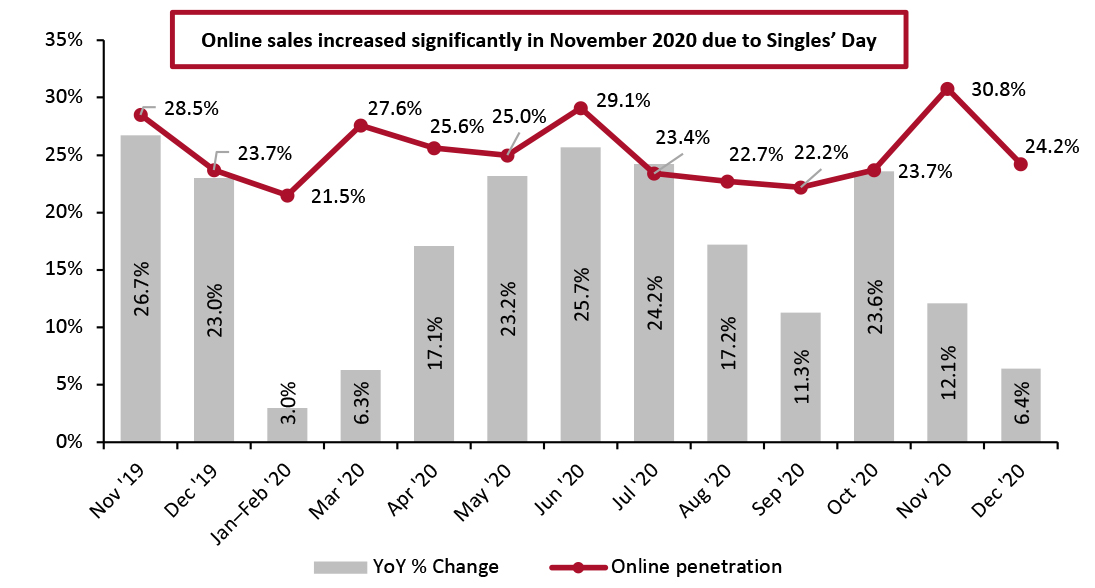
The sector breakdown is based on surveys from enterprises above a designated size, which refers to those with annual sales of ¥5 million (around $730,000) and above. Source: National Bureau of Statistics Online Retail Sales Account for 24.2% of Total Retail Sales In December, online retail sales growth slowed to single digits, as shown below. The channel accounted for 24.2% of total retail sales in December, a decline from 30.8% in November, which likely reflects the significant sales generated during the Singles’ Day shopping festival. In 2020, online retail sales climbed 14.8% year over year in, accounting for 24.9% of total retail sales. This is an increase from 20.7% in 2019. Online retail sales include food service as the National Bureau of Statistics does not provide online data that exclude or break out food service. In the chart below, online sales are benchmarked to total retail sales including automobiles, gasoline and food service.
Figure 3. Online Retail Sales as % of Total Retail Sales (Incl. Automobiles, Gas and Food Service) [caption id="attachment_122370" align="aligncenter" width="724"] Online retail sales include food service
Source: National Bureau of Statistics [/caption]
Figure 1. Total China Retail Sales (Ex. Food Service; Incl. Automobiles and Gasoline): YoY % Change [caption id="attachment_122368" align="aligncenter" width="725"]
 January and February figures reported together
 Source: National Bureau of Statistics/Coresight Research [/caption] Retail Sales Growth by Sector Several sectors saw strong year-over-year sales growth:
- The beverage sector saw a 17.1% year over year increase in December, versus November’s 21.6%, as shown in Figure 2. For 2020 overall, sales growth in this sector increased by 14.0%—the strongest performance across all sectors.
- Alcohol and tobacco retailers again saw strong growth, with sales jumping 20.9% year over year in December, following strong growth of 11.4% in November. December’s strength is partly due to demand for gifts as people prepare for Chinese New Year—in 2019 alcohol and tobacco retailers saw 12.5% year over year growth. For 2020 overall, sales growth in this sector increased by 5.4%.
- Retailers of communication equipment, such as mobile phones, saw 21% year over year growth in December—falling short of November’s 43.6% growth. For 2020 overall, sales growth in this sector increased by 12.9%. November’s significant growth rate is partly due to new releases by popular phone brands, such as Apple’s iPhone 12 and Huawei’s Mate 40, which came in mid and late October, setting up November to peak in sales of new products. Moreover, the Singles’ Day shopping festival, which ran over 11 days in November on Alibaba and JD.com, recorded sales totaling ¥769.7 billion ($115 billion) in GMV. Sales of Huawei’s Mate 40 phone exceeded ¥100 million in just seven seconds during the shopping festival on JD.com.
- Gold, silver and jewelry retailers saw 11.6% year over year sales growth—a slowdown from 24.8% in November. For 2020 overall, sales growth in this sector decreased by 4.7%. The growth is reflected in some retailers’ reported sales, for instance, Chow Tai Fook Jewellery Group saw sales in Mainland China increase 26.1% year over year for the three months ended December 31, 2020, accounting for 83.3% of the group's total sales.
- Sales by household appliance retailers jumped 11.2% year over year in December, versus 5.1% in November. For 2020 overall, sales growth in this sector decreased by 3.8%.
- Sales by Chinese and Western medicine retailers maintained high growth, with a year-over-year increase of 12.1% in December, following on from 12.8% in November. For 2020 overall, sales growth in this sector increased by 7.8%. The growth likely reflects consumers’ health concerns relating to the Covid-19 crisis.
- The construction and decoration material sector saw strong growth of 12.9% in December, an increase from 7.1% in November. For 2020 overall, sales growth in this sector decreased by 2.8%. The growth in November and December is likely partly due to the deferral of house construction to late 2020, as the first half of 2020 was disturbed by the pandemic and heavy rainfall in the middle of the year in Mainland China.
- Food saw steady growth of 8.2% in December, following on from 7.7% in November, as shown in Figure 2. The food sector has performed quite steadily overall, with little fluctuation related to the Covid-19 crisis—food saw 9.9% year-over-year growth in 2020 and 10.2% in 2019.
- The apparel and footwear sector grew 3.8% year over year, versus 4.6% in November. For 2020 overall, sales growth in this sector decreased by 6.6%.
- Beauty retailers saw disappointing growth in December, with a rise of 9.0% year over year but falling short of November’s 32.3% growth. This may be partly attributed to the Singles’ Day festival in November—JD.com saw a year-over-year increase of 50% in its sales of beauty products during the shopping festival. For 2020 overall, sales growth in this sector increased by 9.5%.
- Daily necessities sales growth increased by 8.0% in December, versus 8.1% in November.Daily necessities cover a range of everyday products, such as children’s toys, eye glasses, household tableware and lighting appliances. For 2020 overall, sales growth in this sector increased by 7.5%.
- Sales by furniture retailers grew 0.4% in December, an improvement on November’s 2.2% decrease. For 2020 overall, sales growth in this sector decreased by 7.0%.
- Sales by automobile retailers grew 6.4% year over year in December. For the year overall, the sector’s sales growth decreased by 1.8%. However, according to the China Passenger Car Association, this sector will see year-over-year growth of 4% in 2021 as pent-up consumer demand is gradually released following control of the pandemic and in response to new policies from the Chinese government in November 2020 on the development of the automobile industry.
Figure 2. China Total Retail Sales (Ex. Food Service; Incl. Gasoline and Automobiles), by Sector: YoY % Change [wpdatatable id=714]
The sector breakdown is based on surveys from enterprises above a designated size, which refers to those with annual sales of ¥5 million (around $730,000) and above. Source: National Bureau of Statistics Online Retail Sales Account for 24.2% of Total Retail Sales In December, online retail sales growth slowed to single digits, as shown below. The channel accounted for 24.2% of total retail sales in December, a decline from 30.8% in November, which likely reflects the significant sales generated during the Singles’ Day shopping festival. In 2020, online retail sales climbed 14.8% year over year in, accounting for 24.9% of total retail sales. This is an increase from 20.7% in 2019. Online retail sales include food service as the National Bureau of Statistics does not provide online data that exclude or break out food service. In the chart below, online sales are benchmarked to total retail sales including automobiles, gasoline and food service.
Figure 3. Online Retail Sales as % of Total Retail Sales (Incl. Automobiles, Gas and Food Service) [caption id="attachment_122370" align="aligncenter" width="724"]
 Online retail sales include food service
 Source: National Bureau of Statistics [/caption]