Jan 25, 2019
2 min

December 2018 US Monthly Retail Traffic and In-Store Metrics Report: Traffic Recovers After an Early-December Lull

Insight Report
Insight Reports Gated Insight Reports

albert Chan
Our US Monthly Retail Traffic and In-Store Metrics Report reviews year-over-year changes in selected store-based metrics, including sales, traffic and conversion rates. U.S. store-based traffic and sales declined in December, while the conversion rate declined by 0.7 percentage points, according to RetailNext. ATV grew 3.1%, maintaining its strong showing since October. The rate of product returns climbed significantly, by 1 percentage point, its biggest increase since November 2017. 
  • Retail traffic declined 5.9% year over year in December, following a steep 8.3% decline in November, the largest decline in 2018. 
  • Shopper yield (sales divided by traffic) declined 0.3% year over year in December in  the first decline since September. This follows the 4.6% increase in November, which was the largest increase in shopper yield recorded last year.
The last two weeks of December (weeks 4 and 5), inclusive of Christmas and New Year’s Day, recorded robust traffic and sales, in sharp contrast to the decreases at the beginning of the month (weeks 1-3). Traffic increased 11.9% and 9.1% respectively in these two weeks while net sales increased by 9.8% and 13.3% respectively. ATV stood out as the only metric that registered growth in each week of the month. All geographic regions posted sales and traffic declines in December compared to the same period last year. The Northeast experienced the largest year-over-year decline in traffic of all regions at 9.6%, thanks to weather conditions. Despite colder conditions in the Midwest, the region registered the smallest decline, at 2.8%, due to less precipitation than other regions. The South experienced its wettest weather conditions since 2009, resulting in the largest year-over-year in-store sales decline among all regions, down 8.8%, whereas the Midwest reported the smallest decline, down 3.0%. [caption id="attachment_67153" align="aligncenter" width="664"] 
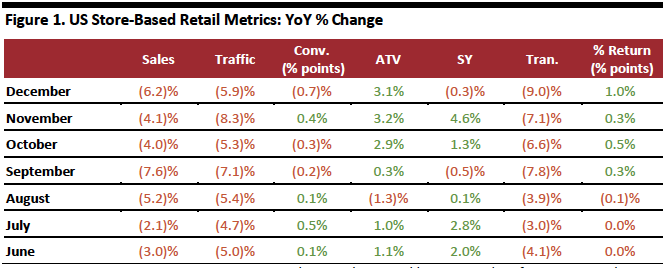
Conv. = conversion rate, ATV = average transaction value, SY = shopper yield, Tran. = number of transactions and % Return = percentage of goods returned to stores.
Source: RetailNext[/caption]

Trending Reports

US Consumer Tracker: Shopper Shifts Amid Summertime Cyclicality

December 2020 Monthly Consumer Update: US, UK and China

US Consumer Tracker: Shopper Shifts Amid Summertime Cyclicality

The C-Suite’s Evolution: Embracing Technology and Adapting to Hybrid Working …

For You

This is a Demo Report

Weekly US and UK Store Openings and Closures Tracker 2023, …

Woolworths (ASX: WOW) Company Profile

Signet Jewelers (NYSE: SIG) Company Profile

Recently Read

US Consumer Tracker: Shopper Shifts Amid Summertime Cyclicality

December 2020 Monthly Consumer Update: US, UK and China

US Consumer Tracker: Shopper Shifts Amid Summertime Cyclicality

The C-Suite’s Evolution: Embracing Technology and Adapting to Hybrid Working …