DIpil Das
Costco Global Comps Accelerate; Online Comp Growth Decelerates
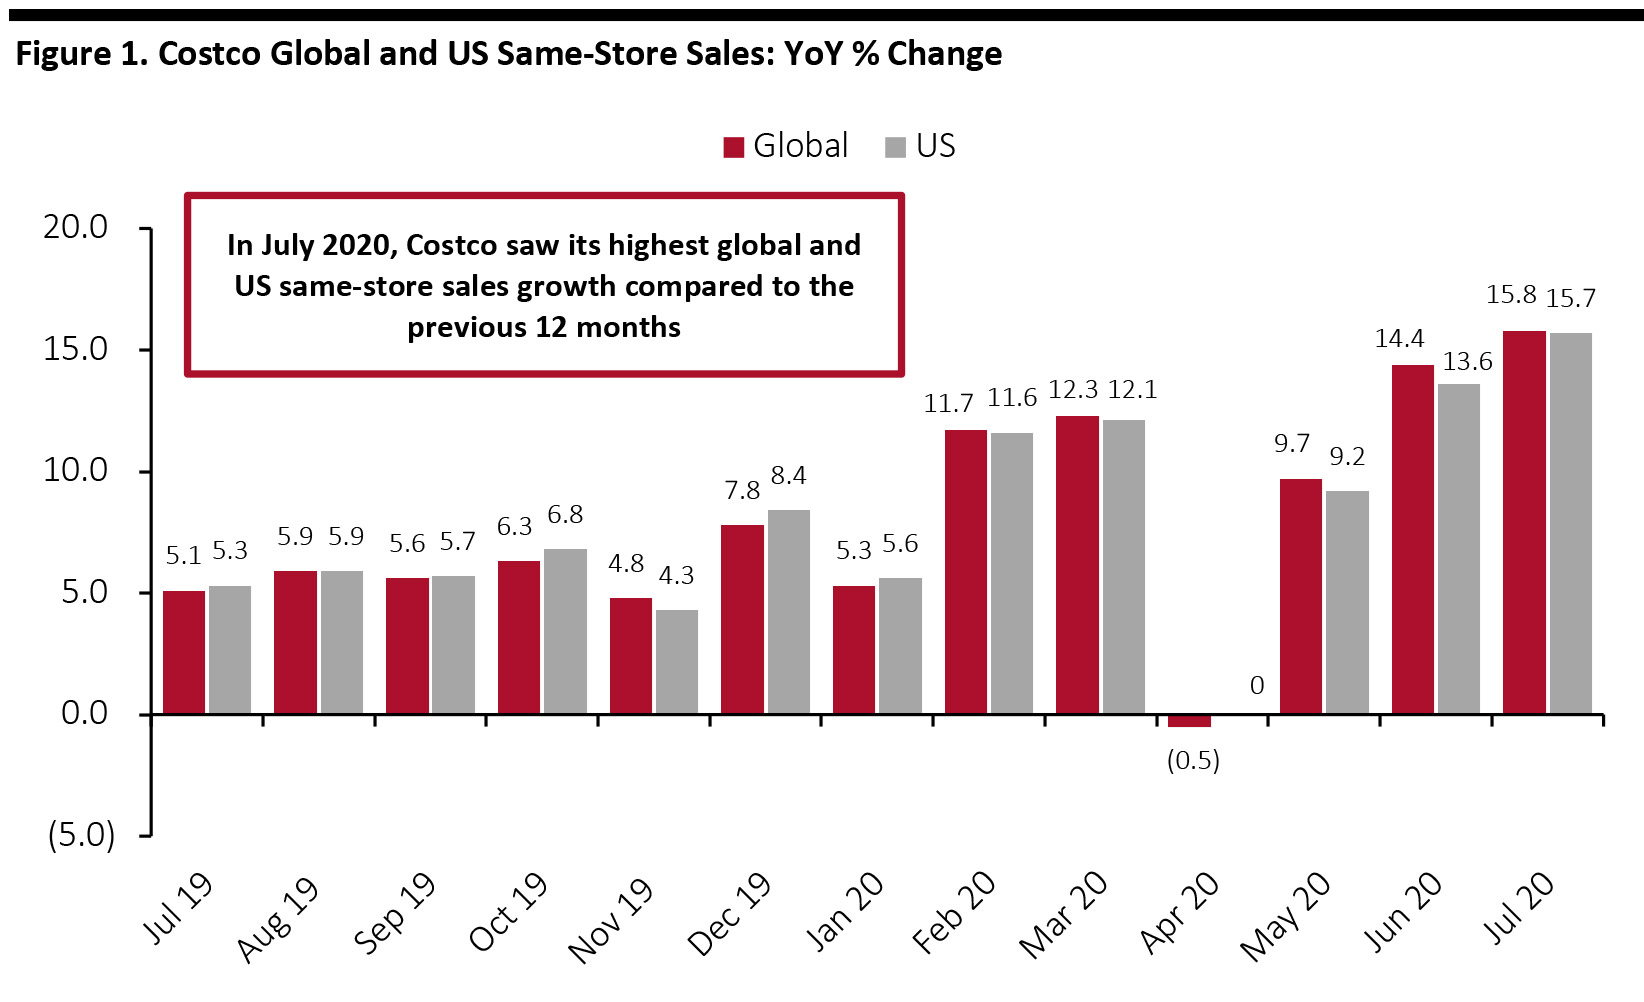
In July 2020 (specifically, the four weeks ended August 2), Costco’s merchandise sales were strong, while its ancillary business continued to underperform. Year-over-year sales growth in the optical and hearing-aid departments was in the low, single digits.- Global: Same-store sales grew 13.2% in July, up from June’s 11.5% growth. Excluding the impact from changes in gasoline prices and exchange rates, global comps were up 15.8% in July, the highest in the past year and increasing from 14.4% growth in June (as shown in Figure 1). Excluding currency effects, Costco’s global online comparable sales experienced 76.1% growth in July, compared to June’s 86.7% growth. The slowing of e-commerce growth reflects the easing of lockdowns and the return to stores by shoppers (although warehouse clubs in the US were allowed to remain open during the lockdown period).
- US: Same-store sales grew by 13.3% in July, compared to June’s 11.0% growth. Excluding gasoline price changes, Costco’s comparable sales were up 15.7% in July (as shown in Figure 1), versus June’s 13.6% growth.
 Global same-store sales exclude the impact from changes in gasoline prices and exchange rates; US same-store sales exclude the impact from changes in gasoline prices
 Source: Company reports [/caption] In July, Costco’s sales and comp traffic at its warehouses recovered to some extent. Comparable traffic for the month was up 1.6% worldwide and 4.5% in the US. The average transaction was up 11.4%, including negative impacts from currency fluctuations and gasoline deflation. In July, currency fluctuations negatively impacted overall comps by about 0.6%. Same-store sales in Canada were negatively impacted by around 3.2%, while Costco’s “Other International” segment was hurt by about 1.4%. Gasoline price deflation negatively impacted total comps by a little less than 2% in July, with the overall average selling price decreasing to $2.40 per gallon this year from $2.93 last year. In the US, the regions with the strongest results were the Northeast, Southeast and Texas. Internationally, Costco saw the strongest results in Japan, Mexico and the UK.
Performance by Segments
- In the merchandise segment, excluding currency effects, comparable growth for food and sundries was positive, in the low 20s in percentage terms: Food, frozen food and liquor showed the strongest results. Hardlines posted positive comps in the mid-20s in percentage terms: Consumer electronics, hardware, automotive, garden and health and beauty performed better than other departments. Softlines were positive, in the low teens in percentage terms: Women’s apparel, home furnishings and small appliances showed the strongest results.
- Fresh-food comparable sales were up, in the mid-20s in percentage terms, with meat and produce performing better than other departments.
- The ancillary businesses were down, in the mid-teens in percentage terms, as a result of low gasoline, photo and food court sales.