albert Chan
Introduction
This report presents the results of Coresight Research’s latest weekly survey of US consumers on the coronavirus outbreak, undertaken on July 1. This report explores the trends we are seeing from week to week, following prior surveys on June 24, June 17, June 10, June 3, May 27, May 20, May 13, May 6, April 29, April 22, April 15, April 8, April 1, March 25 and March 17–18.
Online continues to hold appeal for apparel shopping, while in-store shopping remains at lower levels. Avoidance of public places remains high, and we are seeing fewer consumers say that they have recently visited shopping centers. These trends may reflect consumers’ responses to regional resurgences of the coronavirus, with 19 US states pausing or rolling back reopening plans as of July 1, according to CNN.
Three in 10 Have Switched Apparel Spending to an Online-Only Retailer
This week, we asked consumers about the impact of the coronavirus outbreak on how they shop for clothing and footwear, giving them 10 options (as well as “none”).
Three in 10 respondents have switched some or all of their spending to an online-only retailer such as Amazon.com, reflecting that shoppers have not simply switched to the websites of the stores that they could no longer visit and that e-commerce pure plays have been capturing a growing online market share. One-fifth of respondents have been buying more casual clothing and less formal clothing.
Consumers have also started adopting pickup options for their online purchases. Some 16.7% of respondents have begun using curbside pickup, a new service rolled out by several fashion retailers such as Kohl’s, Macy’s and Old Navy. In-store pickup remains a popular option, with 13.7% of respondents reporting that they have started using the service since the outbreak, and one in 10 are using the service more often than they used to.
A greater proportion of consumers have been buying less second-hand clothing and footwear than those buying more or having begun to buy this category. This could be due to consumers’ hygiene concerns regarding pre-owned fashion pieces.
One in six respondents have avoided trying on clothes when shopping in a store, but only 5% of all respondents have tried using digital tools such as augmented reality for fit or sizing.
[caption id="attachment_112393" align="aligncenter" width="700"]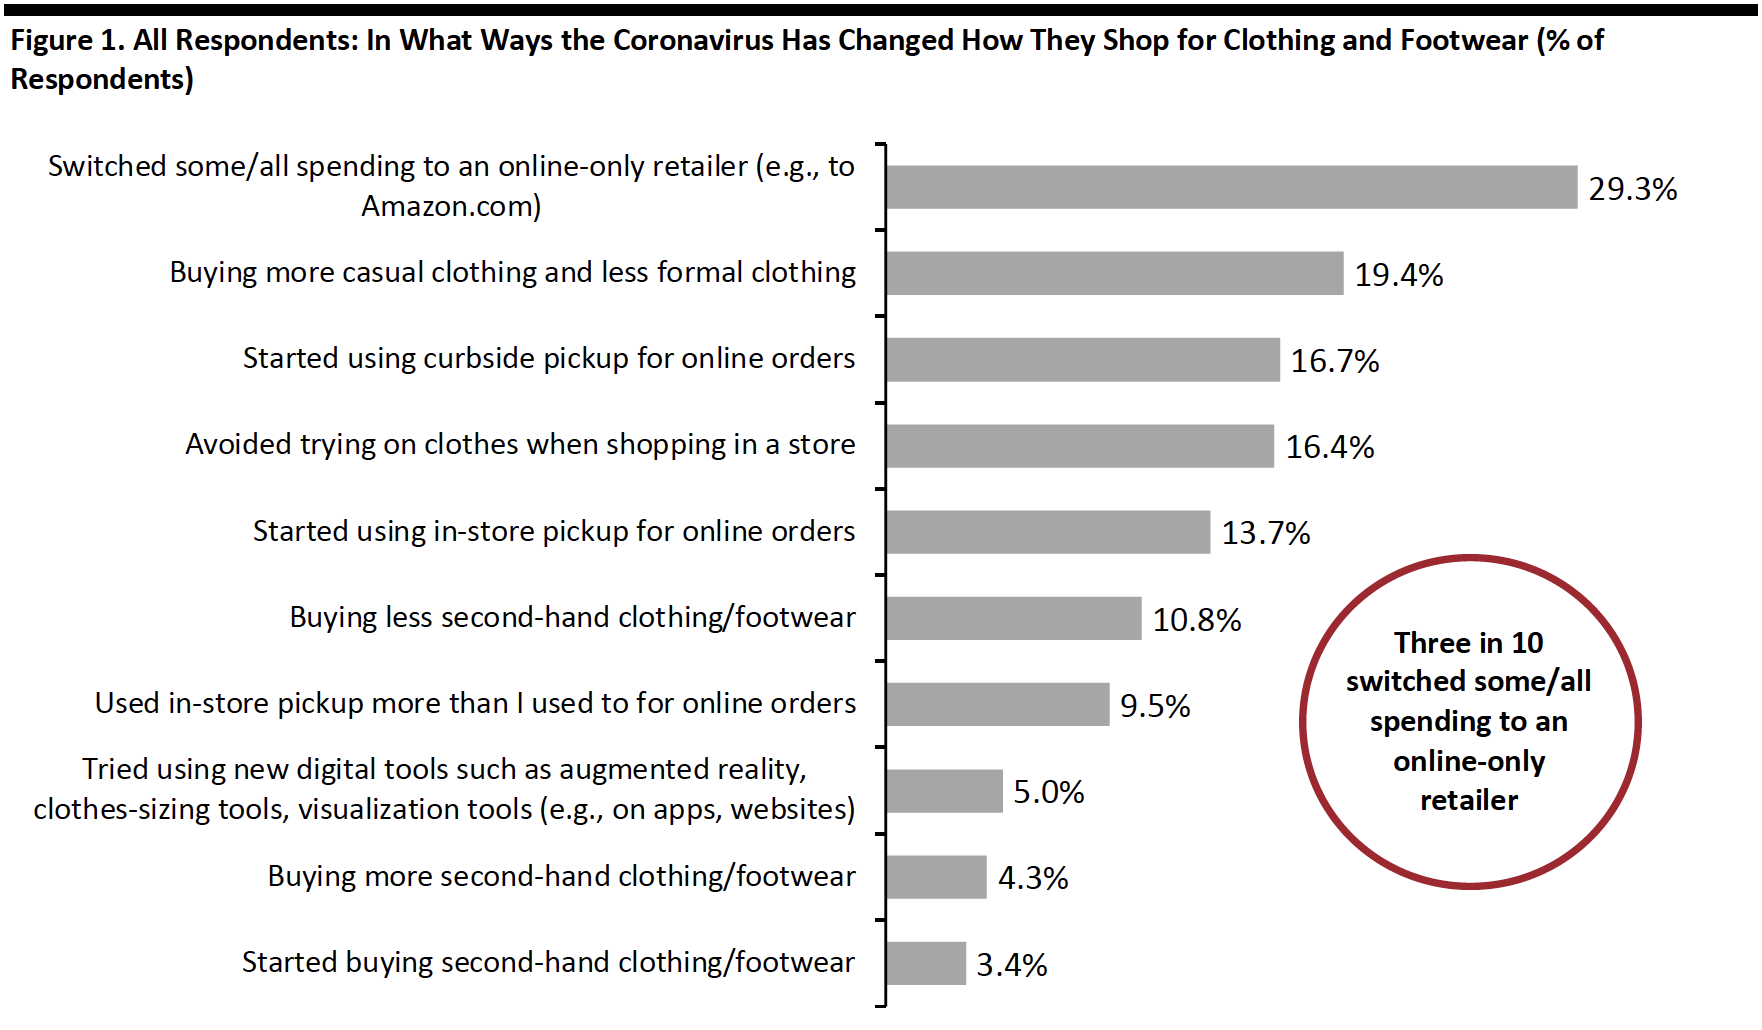 Respondents could select multiple options
Base: US Internet users aged 18+
Source: Coresight Research[/caption]
We continue to see more consumers shopping for apparel online: The proportion of respondents buying more apparel online than they used to increased again this week to about three in 10 (as shown in figure 2). This trend, coupled with consumers’ fear of trying on apparel in store, may result in more returns for fashion retailers—a theme we discuss in the next section.
[caption id="attachment_112394" align="aligncenter" width="700"]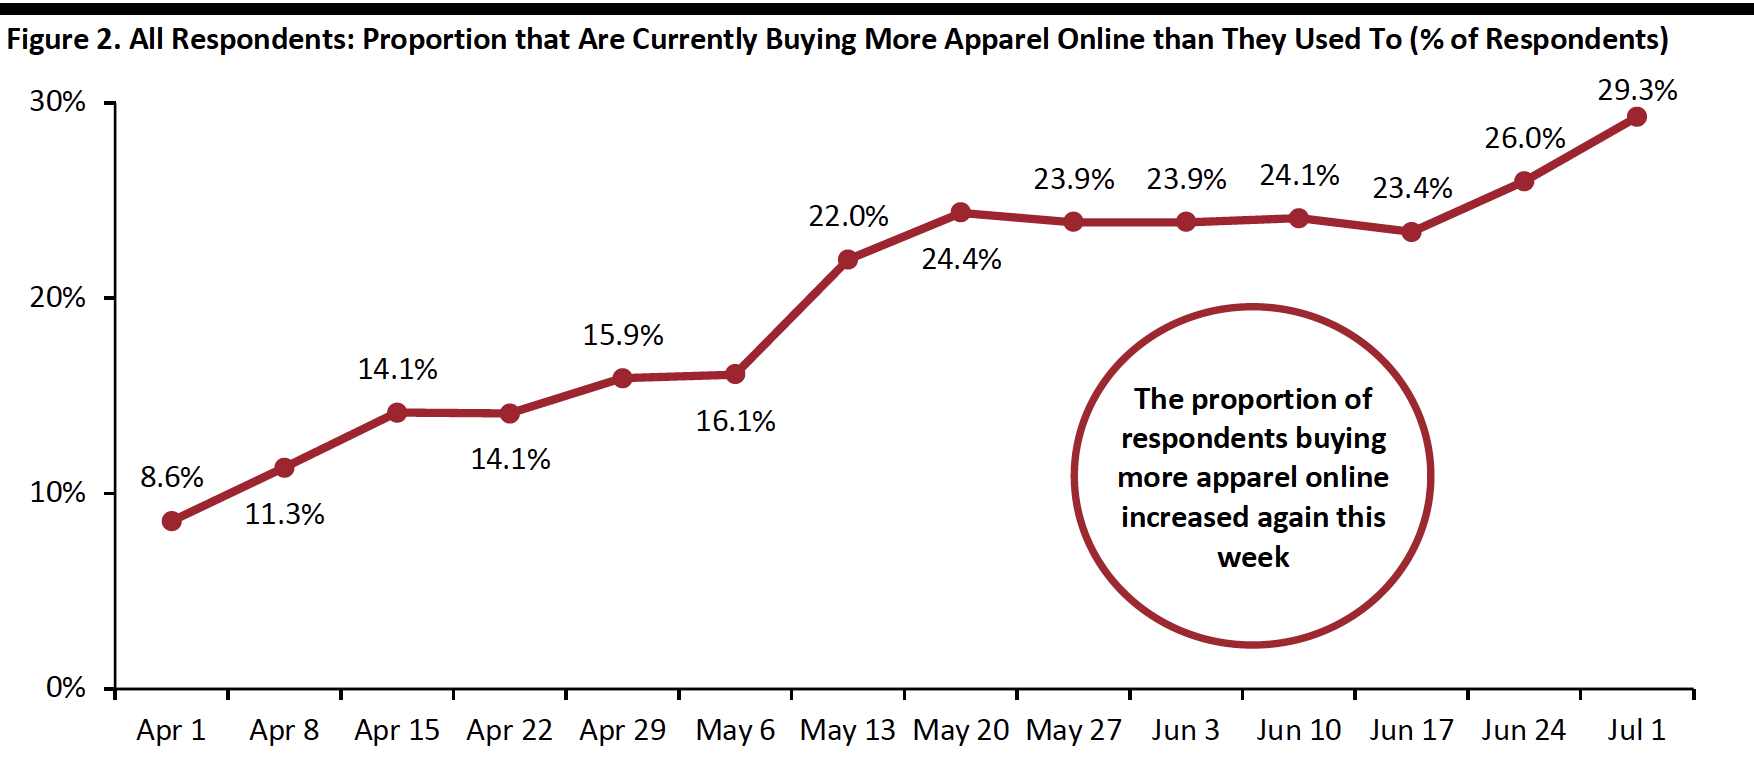 Base: US Internet users aged 18+
Source: Coresight Research[/caption]
How Lockdown and Store Closures Have Impacted Returns
We asked consumers two questions this week about the impact of lockdown or store closures on the return of unwanted purchases.
- We asked respondents if lockdowns, or stores being closed, had prevented them from returning any unwanted purchases.
- We asked those whose returns have been prevented by lockdowns or store closures what they have done with their unwanted purchases.
One-third of all respondents reported that lockdowns or store closures had prevented them from returning their unwanted purchases. Among those consumers, 34.7% ended up keeping the products. Some 30% have yet to return unwanted items and expect to do so in store, versus 12% that will return products by mail. Some 22.7% of respondents have already returned products in store since lockdowns lifted, compared to only 9.3% who did it by mail post lockdowns.
[caption id="attachment_112395" align="aligncenter" width="700"]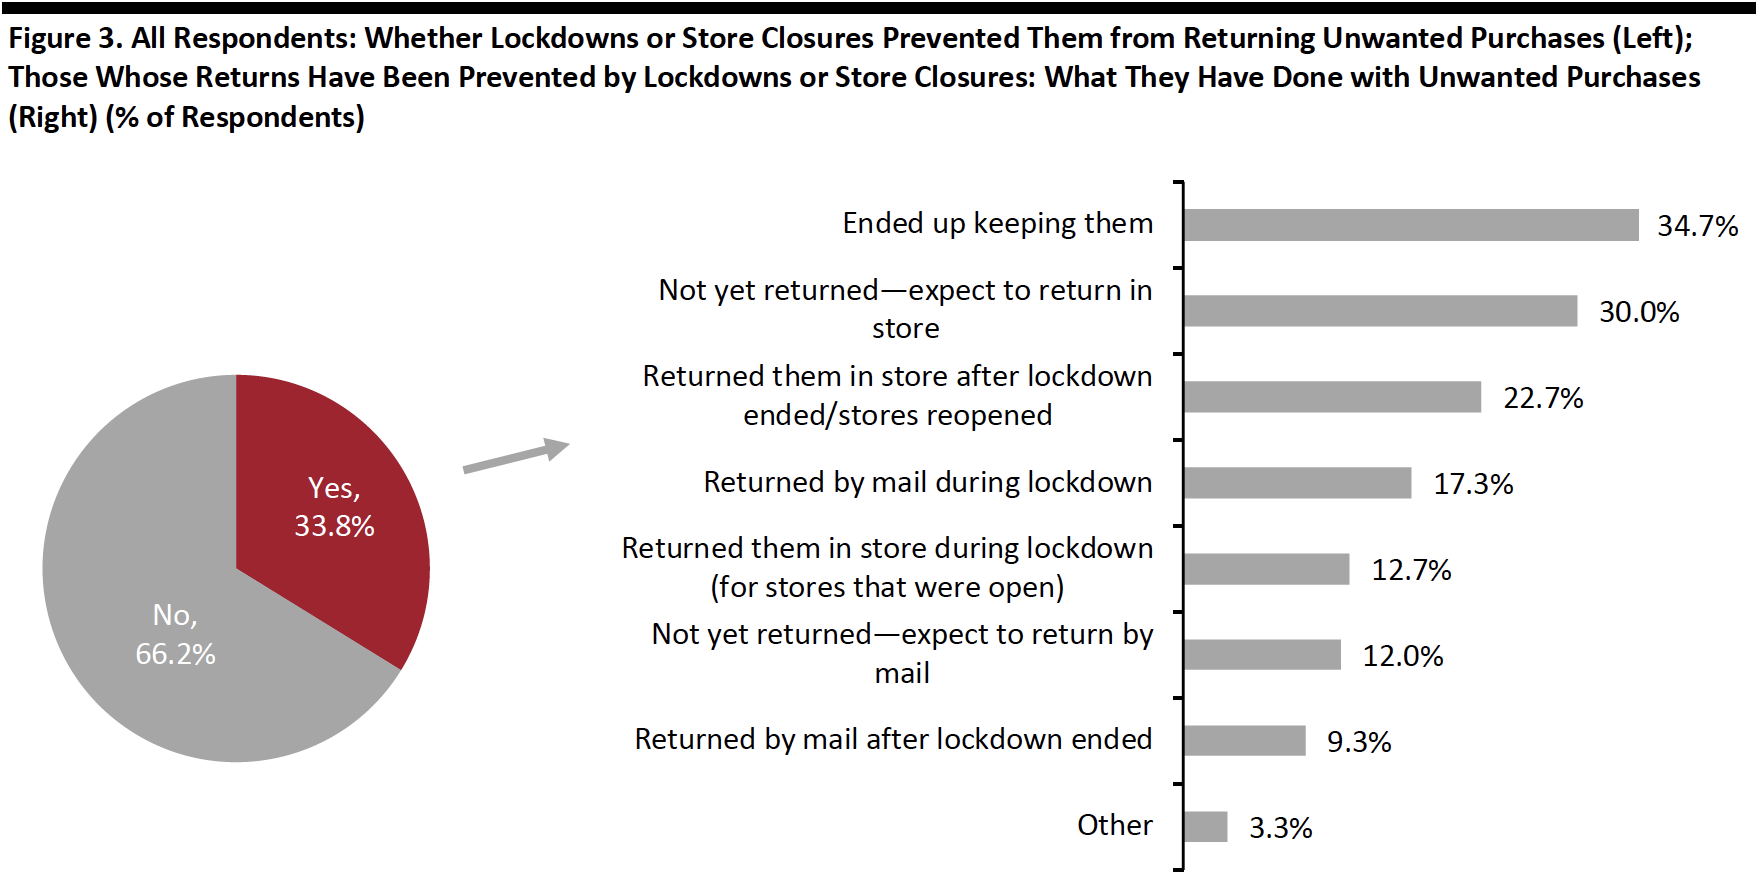 Respondents could select multiple options in the question asking respondents how they have done with unwanted purchases
Base: US Internet users aged 18+
Source: Coresight Research[/caption]
What Shoppers Are Doing and Where They Are Going
Online Shopping For Apparel Remains the Top Spending Activity in the Past Two Weeks
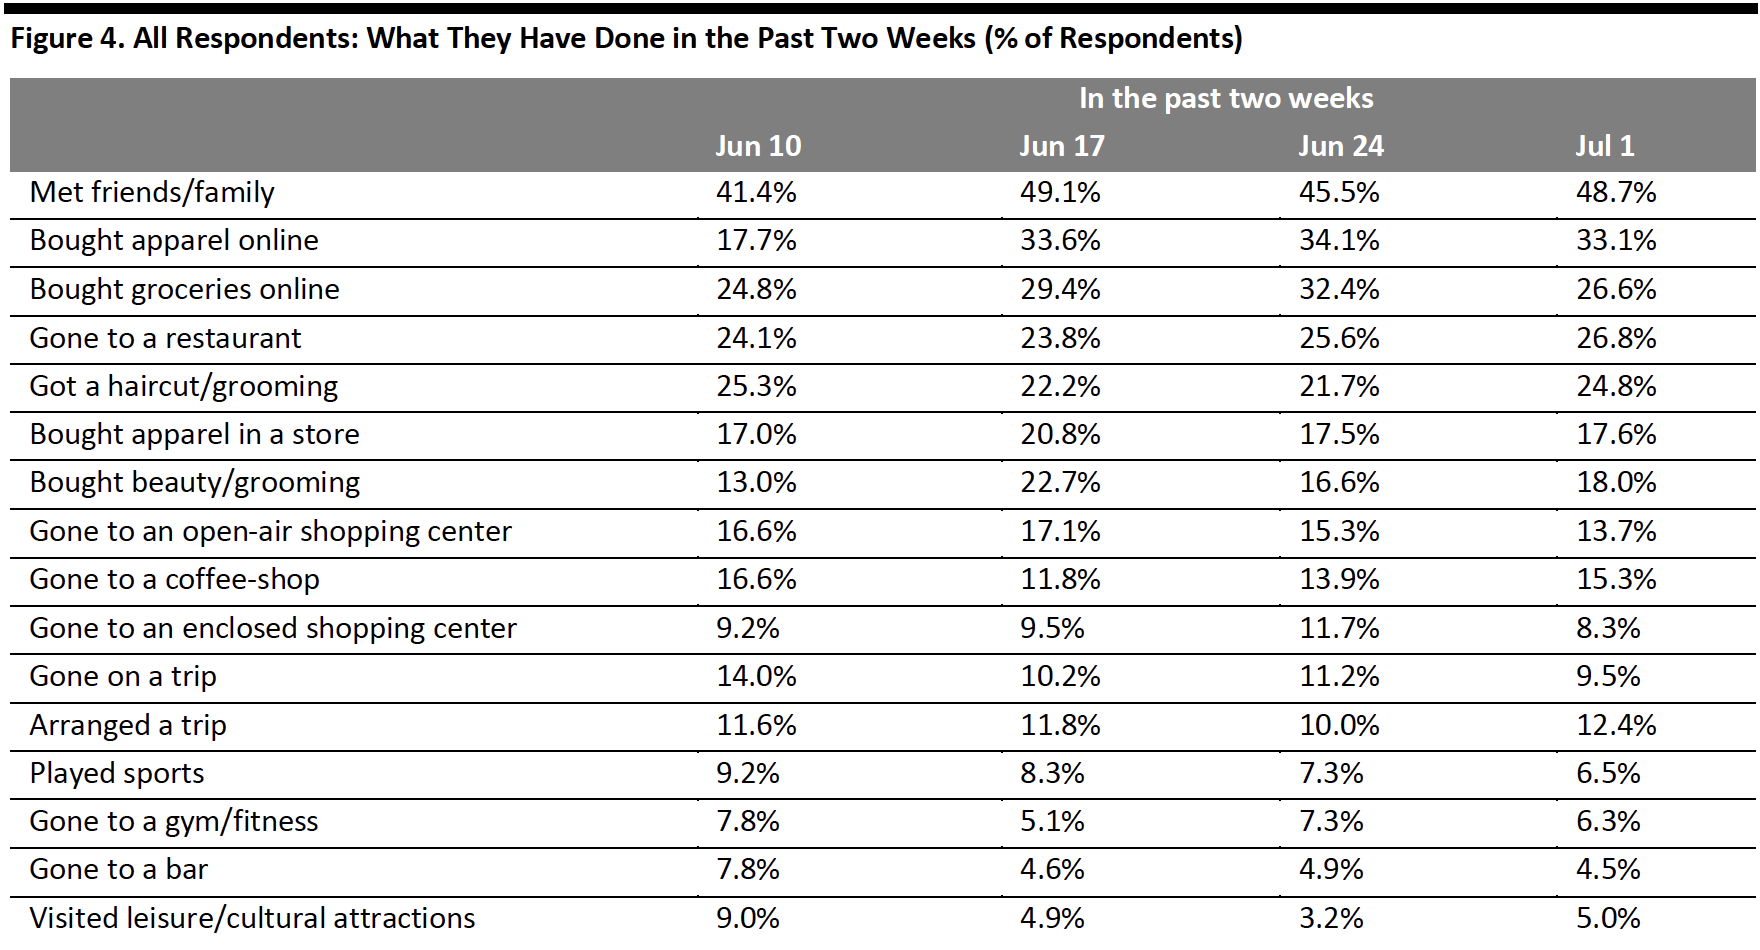
We saw increases in the proportion of respondents for eight of the 16 options we provided for activities done over the past two weeks, although most are within the margin of error.
- Online shopping for apparel continues to top the list of spending-related activities: We saw a stable proportion of around one-third of respondents saying they had done so in the past two weeks. The proportion of respondents who had bought apparel in a store also stayed consistent with last week’s figure, at 17.6%.
- Online grocery shopping fell back after a jump in last week: Some 26.6% of respondents had bought grocery online in the past two weeks, down from 32.4% last week.
- The proportion of respondents who dined in a restaurant in the past two weeks increased again, with more than one-quarter saying they had done so, versus 25.6% last week.
- We noticed slight declines in the proportions of respondents that visited both types of shopping centers—open-air and enclosed. A little below one in seven had gone to an open-air mall in the past two weeks, and only 8.3% had visited an enclosed shopping center. These declines could reflect consumers’ responses to regional resurgences of the virus, as well as the pausing or rolling back of reopening plans in some states.
 Respondents could select multiple options
Base: US Internet users aged 18+
Source: Coresight Research[/caption]
Fewer than One in Six Plan To Buy Apparel in Store in the Next Two Weeks
Below, we chart what respondents have done in the past two weeks and what they expect to do in the next two weeks. We saw a lower proportion of consumers expecting to do shopping-related activities than actual behavior in the past two weeks—likely due in part to some activities being unplanned.
Although only 19.6% expect to buy apparel online in the next two weeks, we expect actual behavior to be higher, based on the results of the past couple of weeks.
Fewer respondents expect to buy apparel in store or buy beauty products in the next two weeks than the number of respondents that had done these activities over the prior two weeks. Some 15.5% expect to buy clothes or footwear in store, and 12.4% expect to buy beauty products, in the next two weeks.
[caption id="attachment_112397" align="aligncenter" width="700"]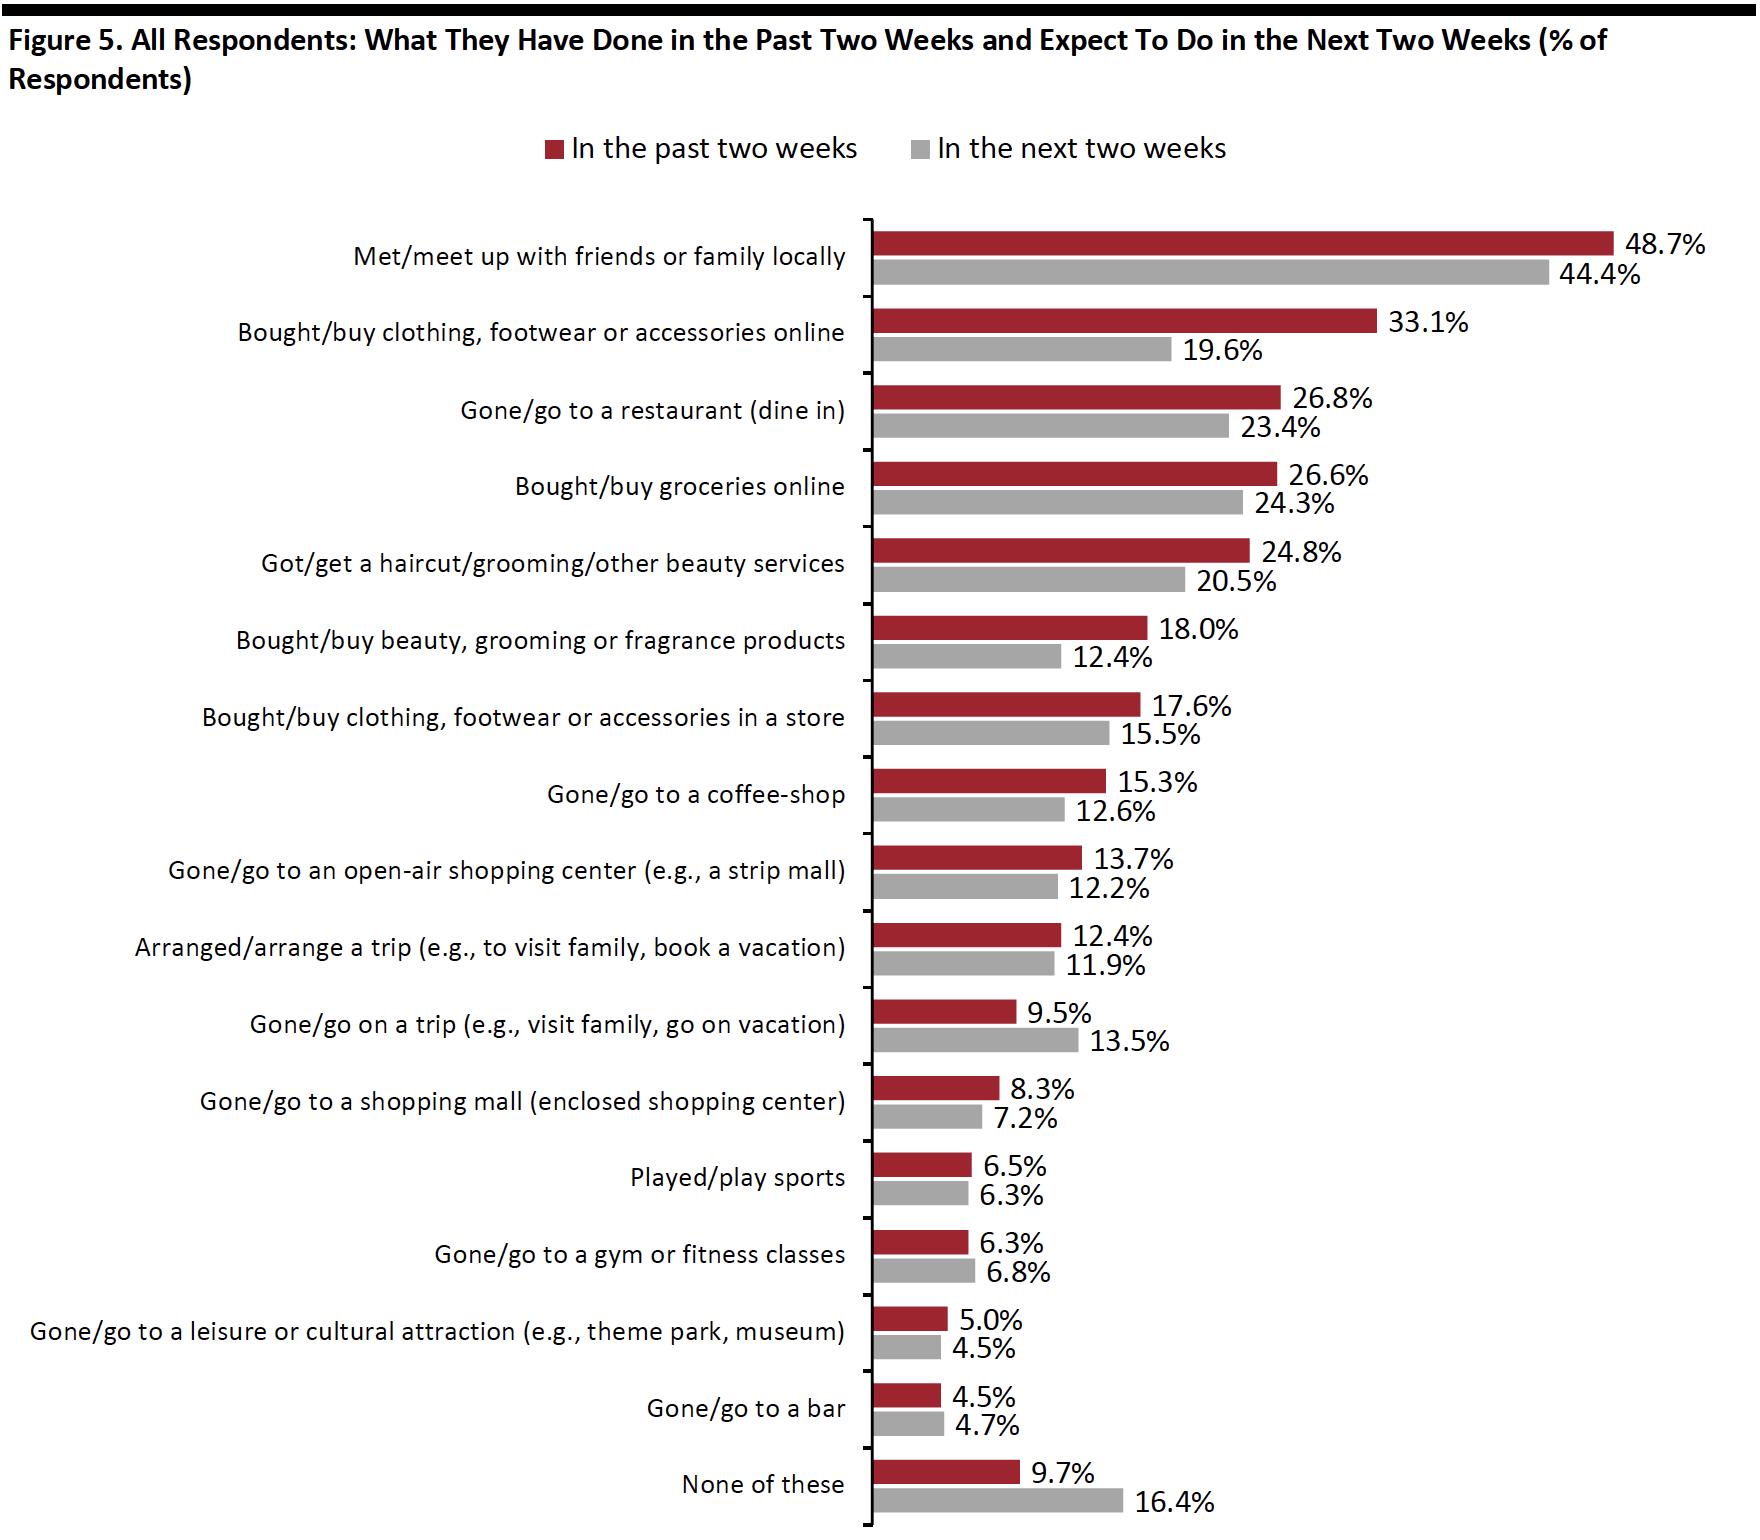 Respondents could select multiple options
Base: US Internet users aged 18+
Source: Coresight Research[/caption]
Eight in 10 Are Currently Avoiding Public Places
Last week, we changed our “avoidance” question from asking about which types of places respondents expect to avoid after lockdowns end to where they are currently avoiding.
This week, we saw 79.7% of respondents saying they are avoiding any public area, roughly in line with the result from last week. This high avoidance figure could be due to the recent spike in coronavirus cases.
Shopping centers/malls continue to be the number-one avoided place, with 60.4% of respondents stating that they are currently avoiding these places, versus 58.9% last week. Avoidance action of shops in general also went up slightly, to 44.8% from 42.8% last week.
Avoidance of food-service locations remains high, at 57.9% this week, consistent with last week’s figure.
[caption id="attachment_112398" align="aligncenter" width="700"]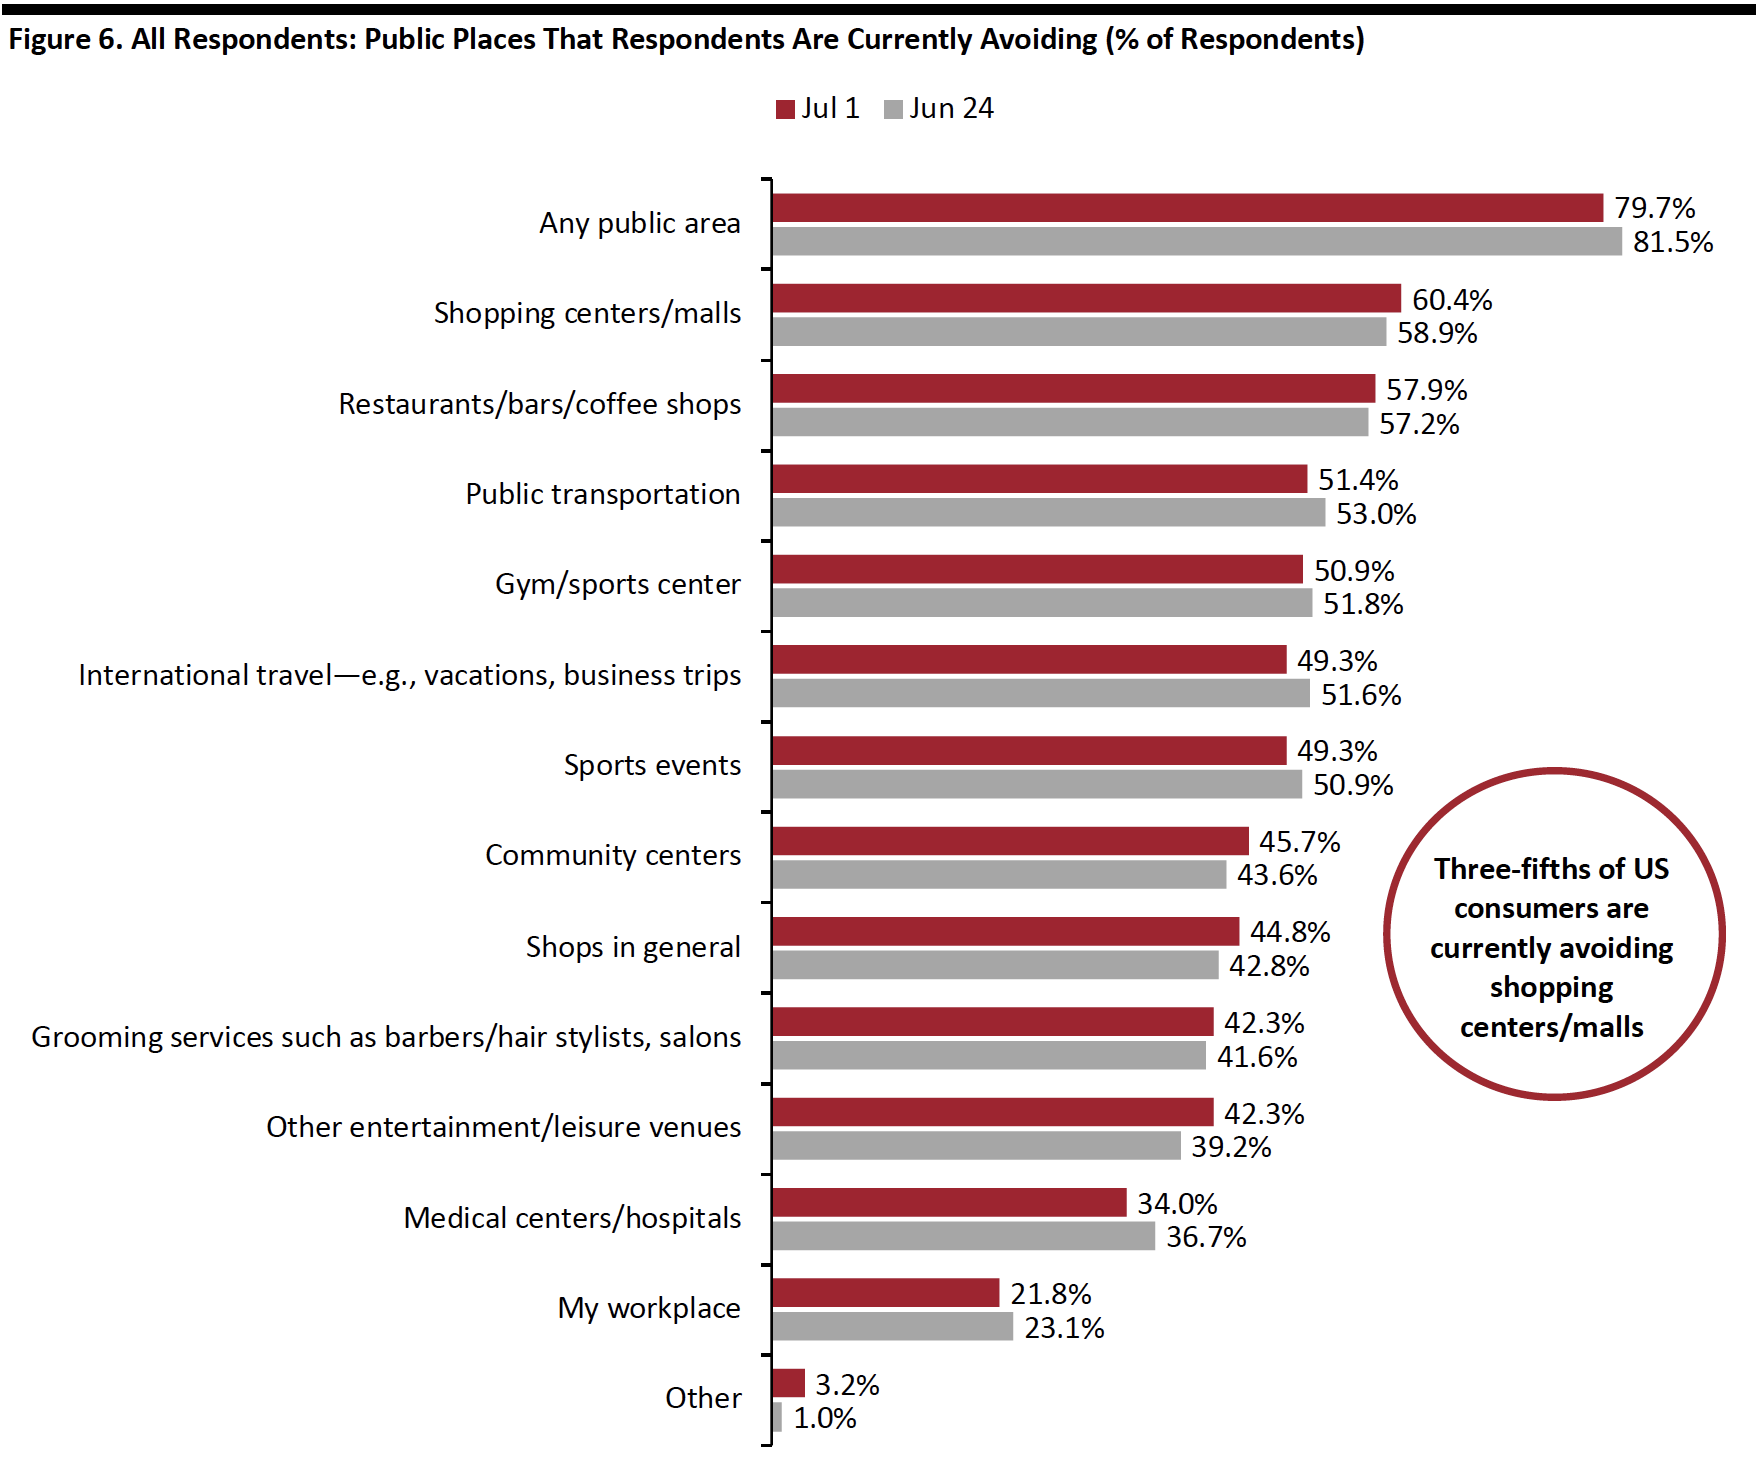 Respondents could select multiple options
Base: US Internet users aged 18+
Source: Coresight Research[/caption]
What They Are Currently Buying More Of and Less Of
The proportion of respondents who are buying more of any categories remains stable from last week: Some 60.1% of respondents are currently buying more, while 52.7% said that they are currently buying less of any categories.
- Note, buying more of certain categories and buying less of certain categories were not mutually exclusive options, so respondents could answer yes to both.
Buying more: Essentials, including household products, food and personal care products are still the top categories that consumers are currently buying more of. However, the proportion of respondents buying more food dropped week over week.
Buying less: Apparel continues to be the most-cut category, with three in 10 respondents spending less on such products. This is followed by other discretionary categories including beauty, furniture and electronics.
Ratio of less to more: Although consumers are currently buying less of discretionary products, there has been a week-over-week decline in the ratio of less to more in these categories. The ratio for apparel was 2.7 this week, versus 3.1 last week. The ratio for beauty products stood at 2.4, down from 2.9 last week.
[caption id="attachment_112399" align="aligncenter" width="700"]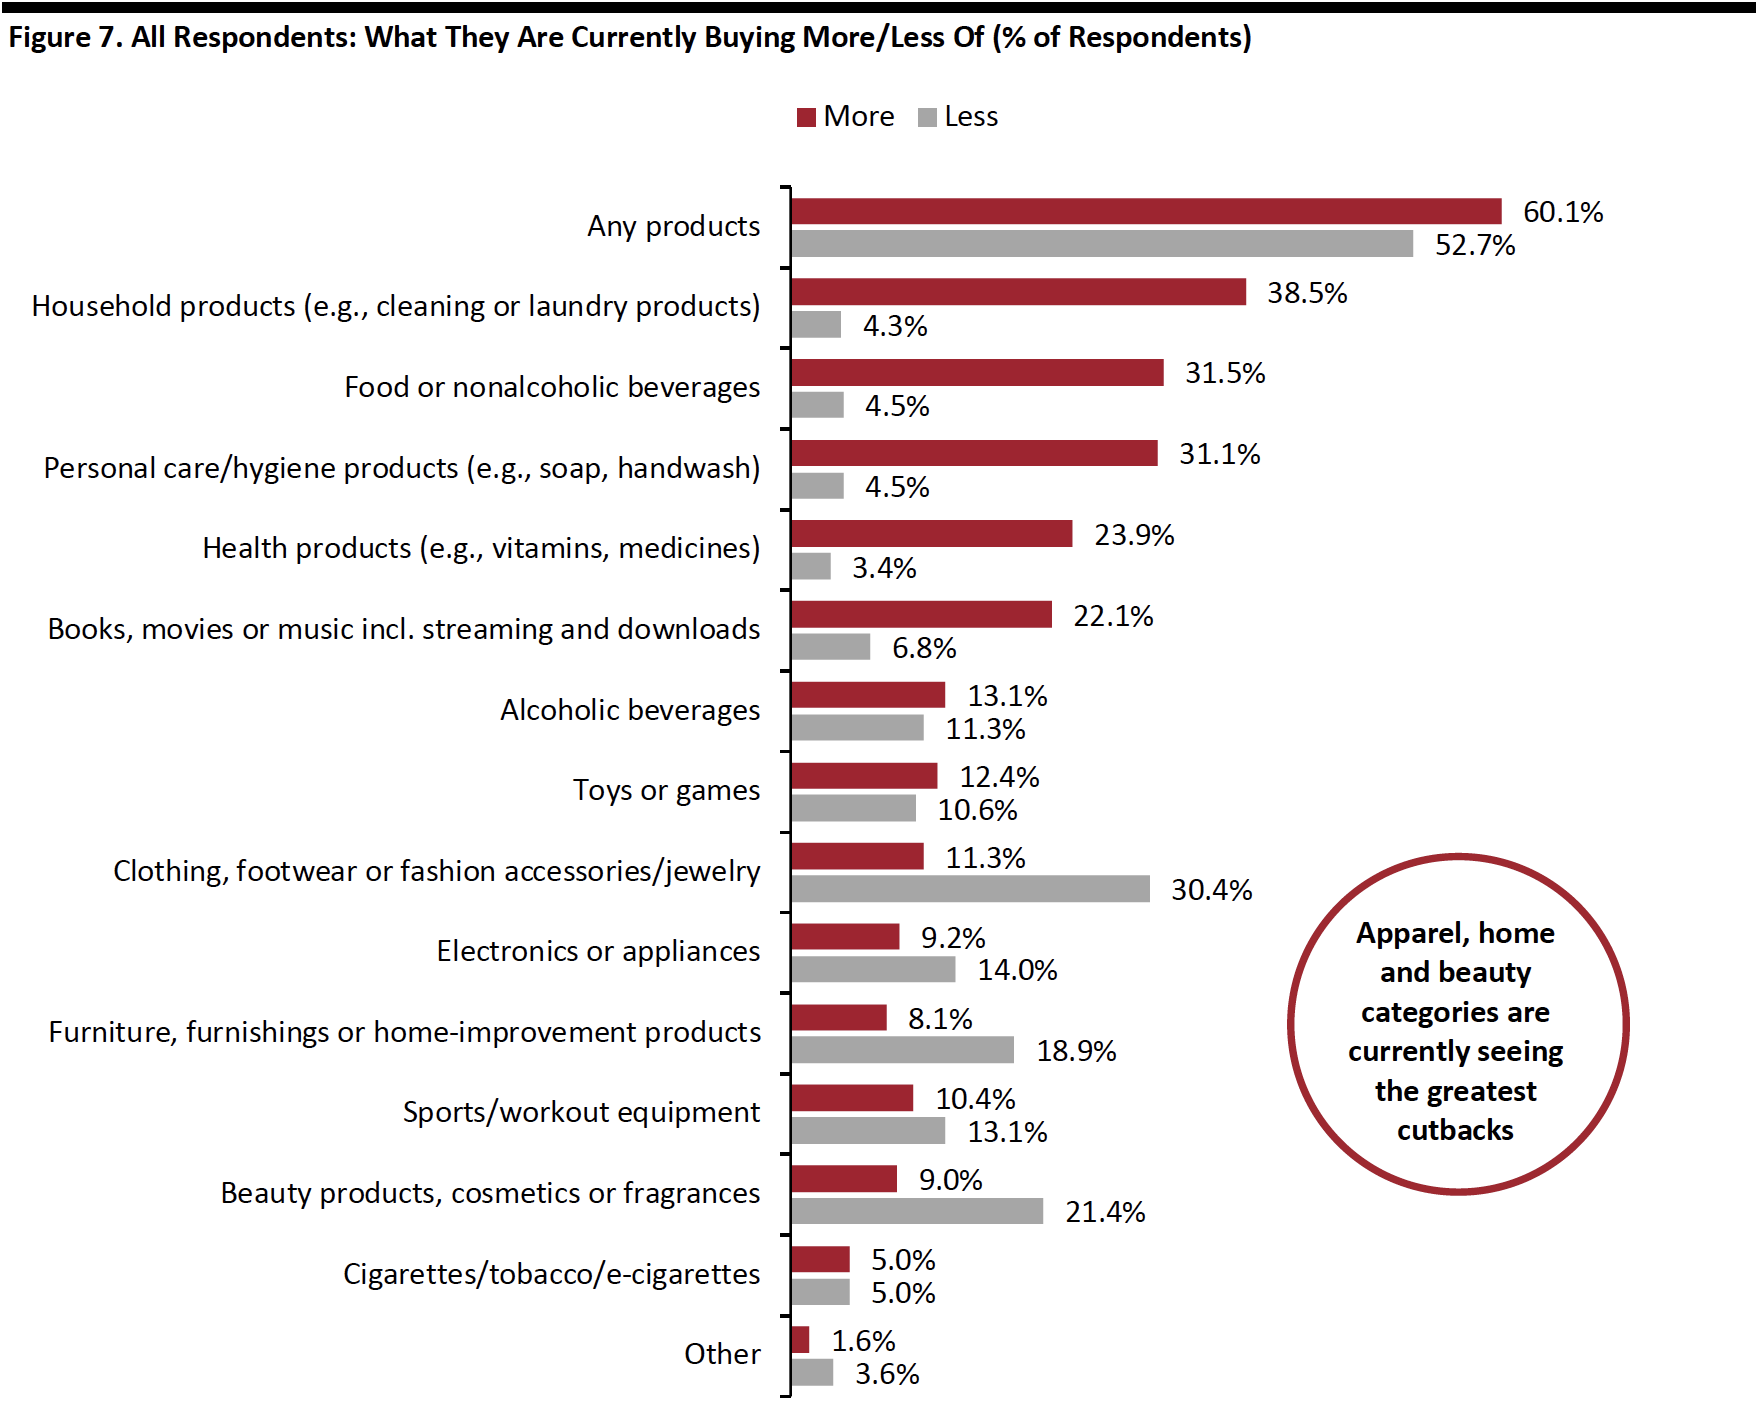 Respondents could select multiple options
Base: US Internet users aged 18+
Source: Coresight Research[/caption]
Seven in 10 Are Switching Spending Online
The proportion of consumers switching their spending to e-commerce fell back to around seven in 10 after a surge last week. Some 68.9% of consumers stated that they are buying more online this week, versus 76.4% last week.
[caption id="attachment_112401" align="aligncenter" width="700"]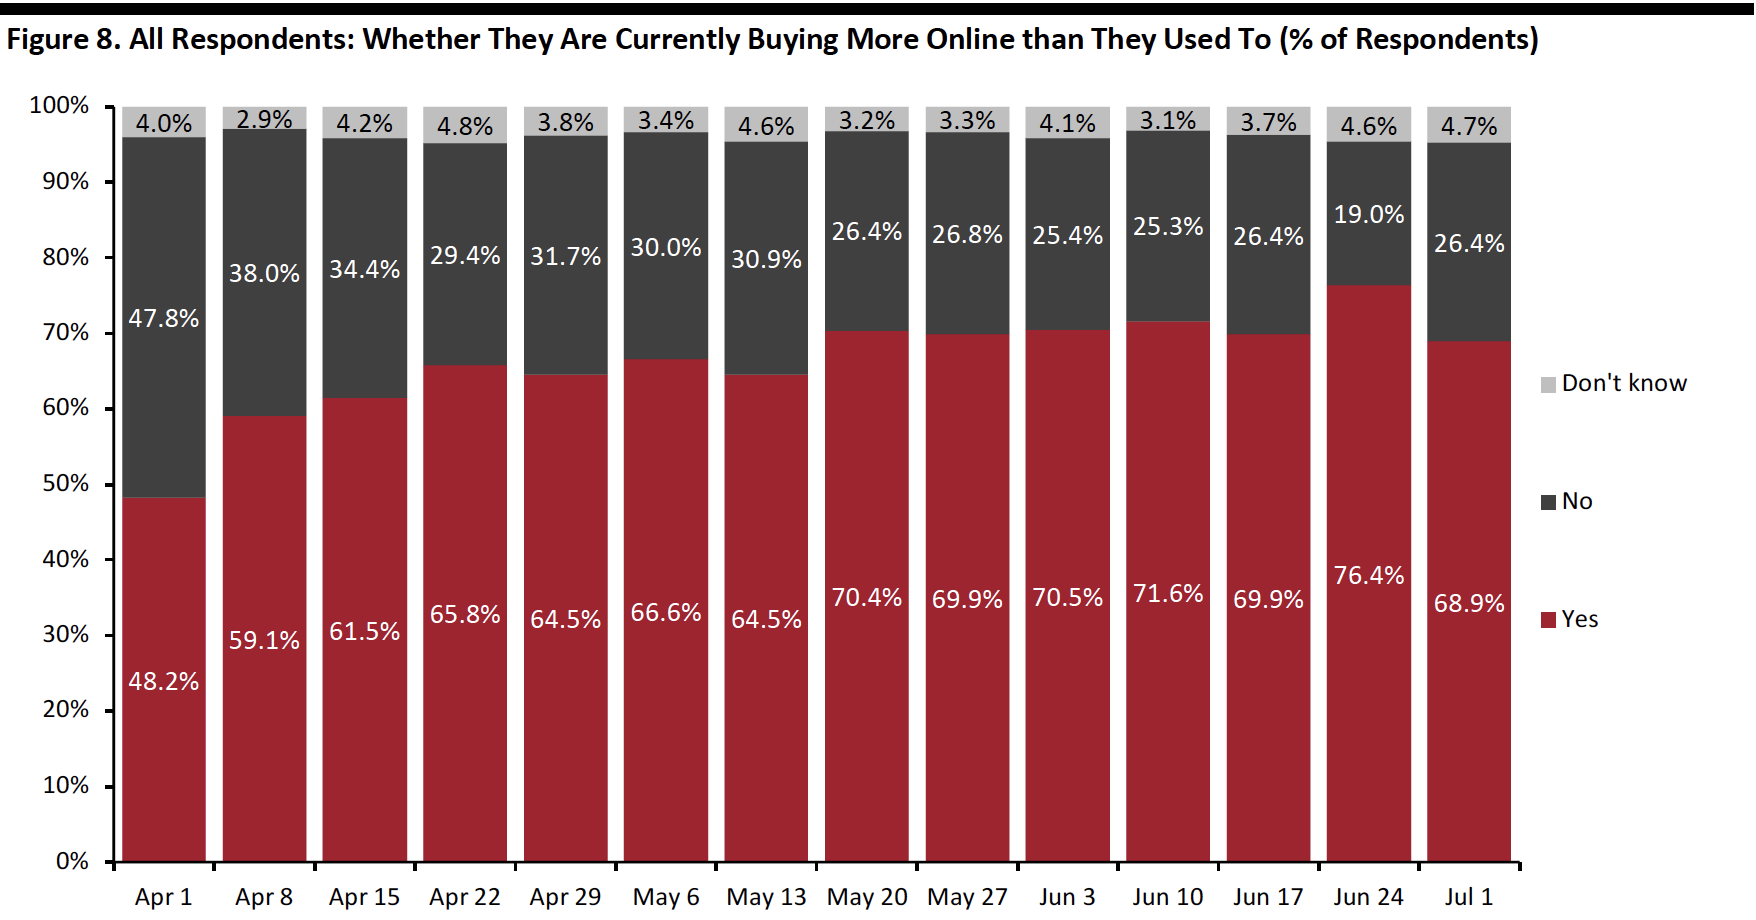 Base: US Internet users aged 18+
Source: Coresight Research[/caption]
What Consumers Are Currently Buying More Of Online
This week, apparel overtook essentials as the top category that consumers are currently buying more of online, with three in 10 respondents reporting that they are doing so, up from 26.0% last week. This is followed by essentials, including household products, food and personal care. However, the proportions of consumers who are currently buying these categories online more fell back week over week.
Online purchases for other discretionary categories broadly leveled off this week: Some 17.3% of respondents are currently buying more beauty products, and 16.7% are buying more electronics.
[caption id="attachment_112402" align="aligncenter" width="700"]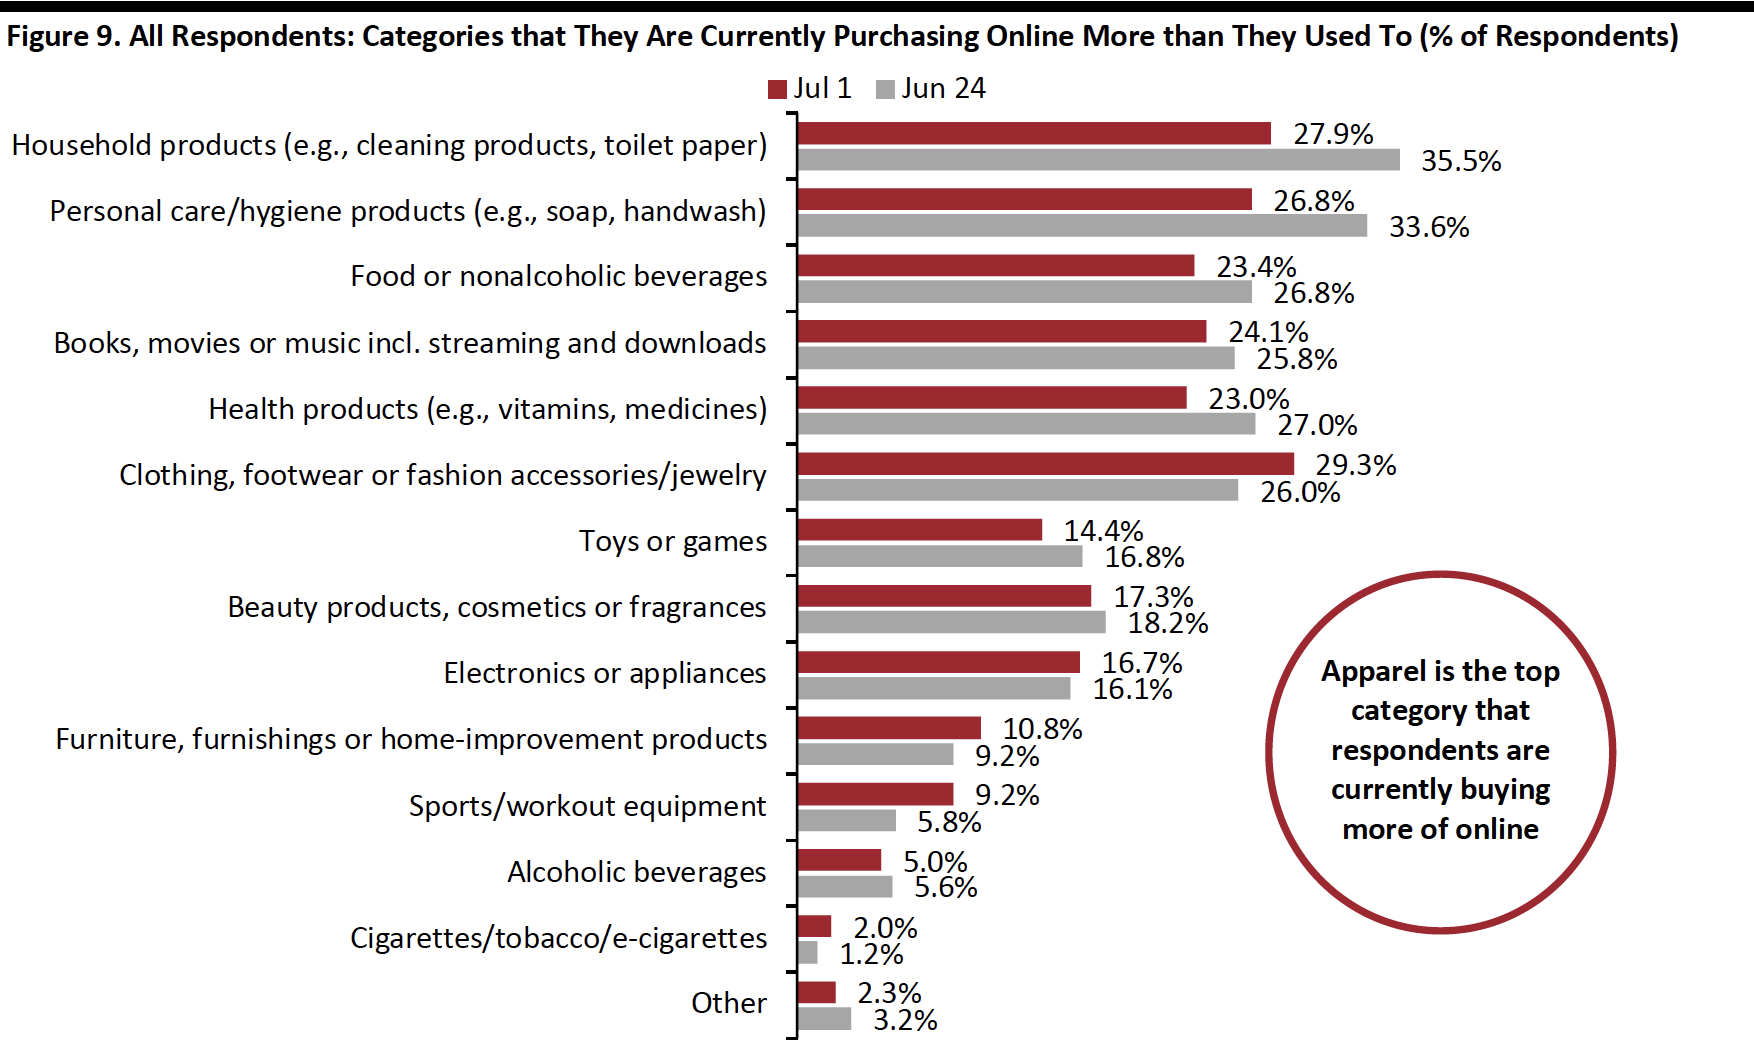 Respondents could select multiple options
Base: US Internet users aged 18+
Source: Coresight Research[/caption]
Reviewing Trend Data in Purchasing Behavior
Fewer than Six in 10 Expect To Retain Changed Behaviors over the Long Term
Each week, we ask respondents whether they think they will keep some of the behaviors they have adopted during the coronavirus crisis. This week, the proportion of respondents expecting to retain some changed behavior continued to slide, with 57.0% expecting to do so for the long term, versus 58.9% last week. This could suggest that consumers are now slightly more ready to resume regular life than they previously expected to be.
[caption id="attachment_112403" align="aligncenter" width="700"]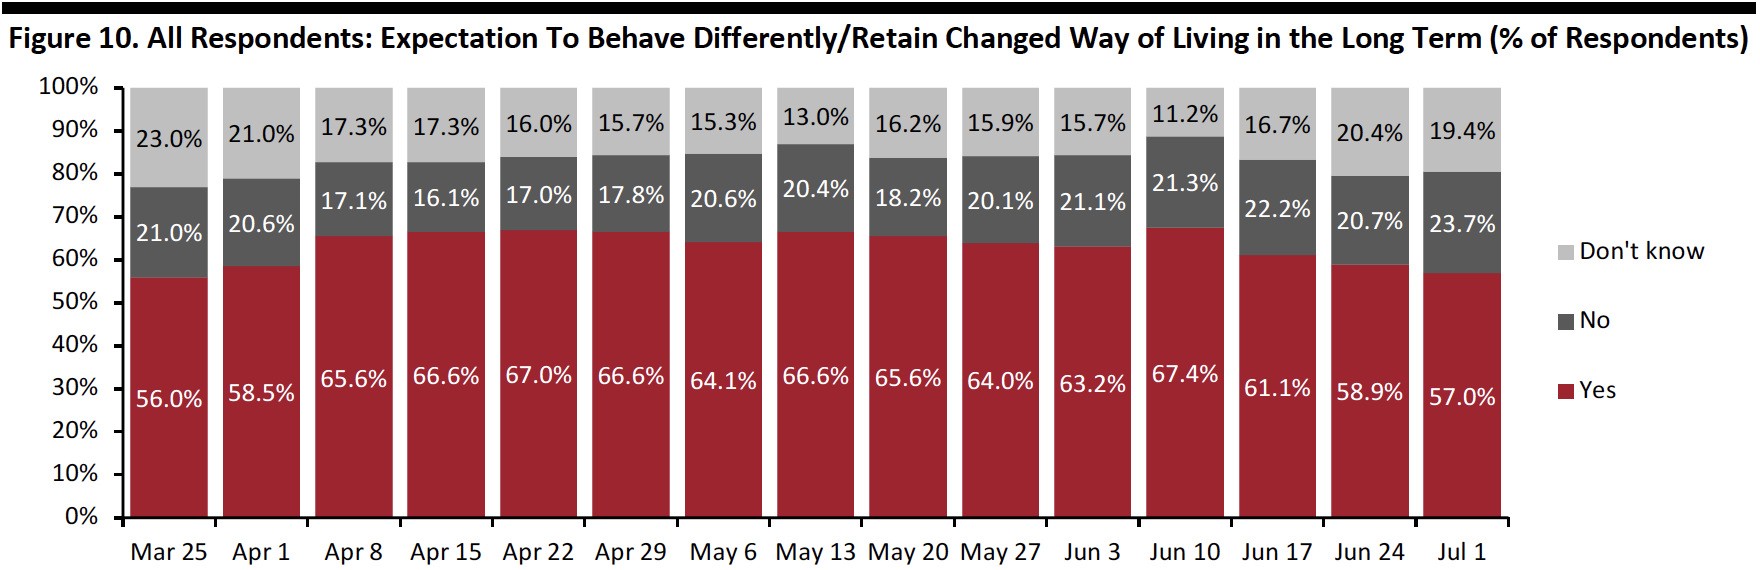 Base: US Internet users aged 18+
Source: Coresight Research[/caption]
Among those expecting to retain changed behaviors, we have seen a consistent upward trend over the past couple of weeks in expectations to have more food/supplies stockpiled, with 46.6% expecting to retain such behavior this week.
The proportion of respondents expecting to have more hygienic practices and less physical interaction returned to the levels we saw two weeks ago after significant declines last week.
The proportion of respondents expecting to use contactless payment options in stores more often than they did previously increased slightly this week, to 42.7%—the highest level since we started asking the question from the last week of May.
[caption id="attachment_112404" align="aligncenter" width="700"]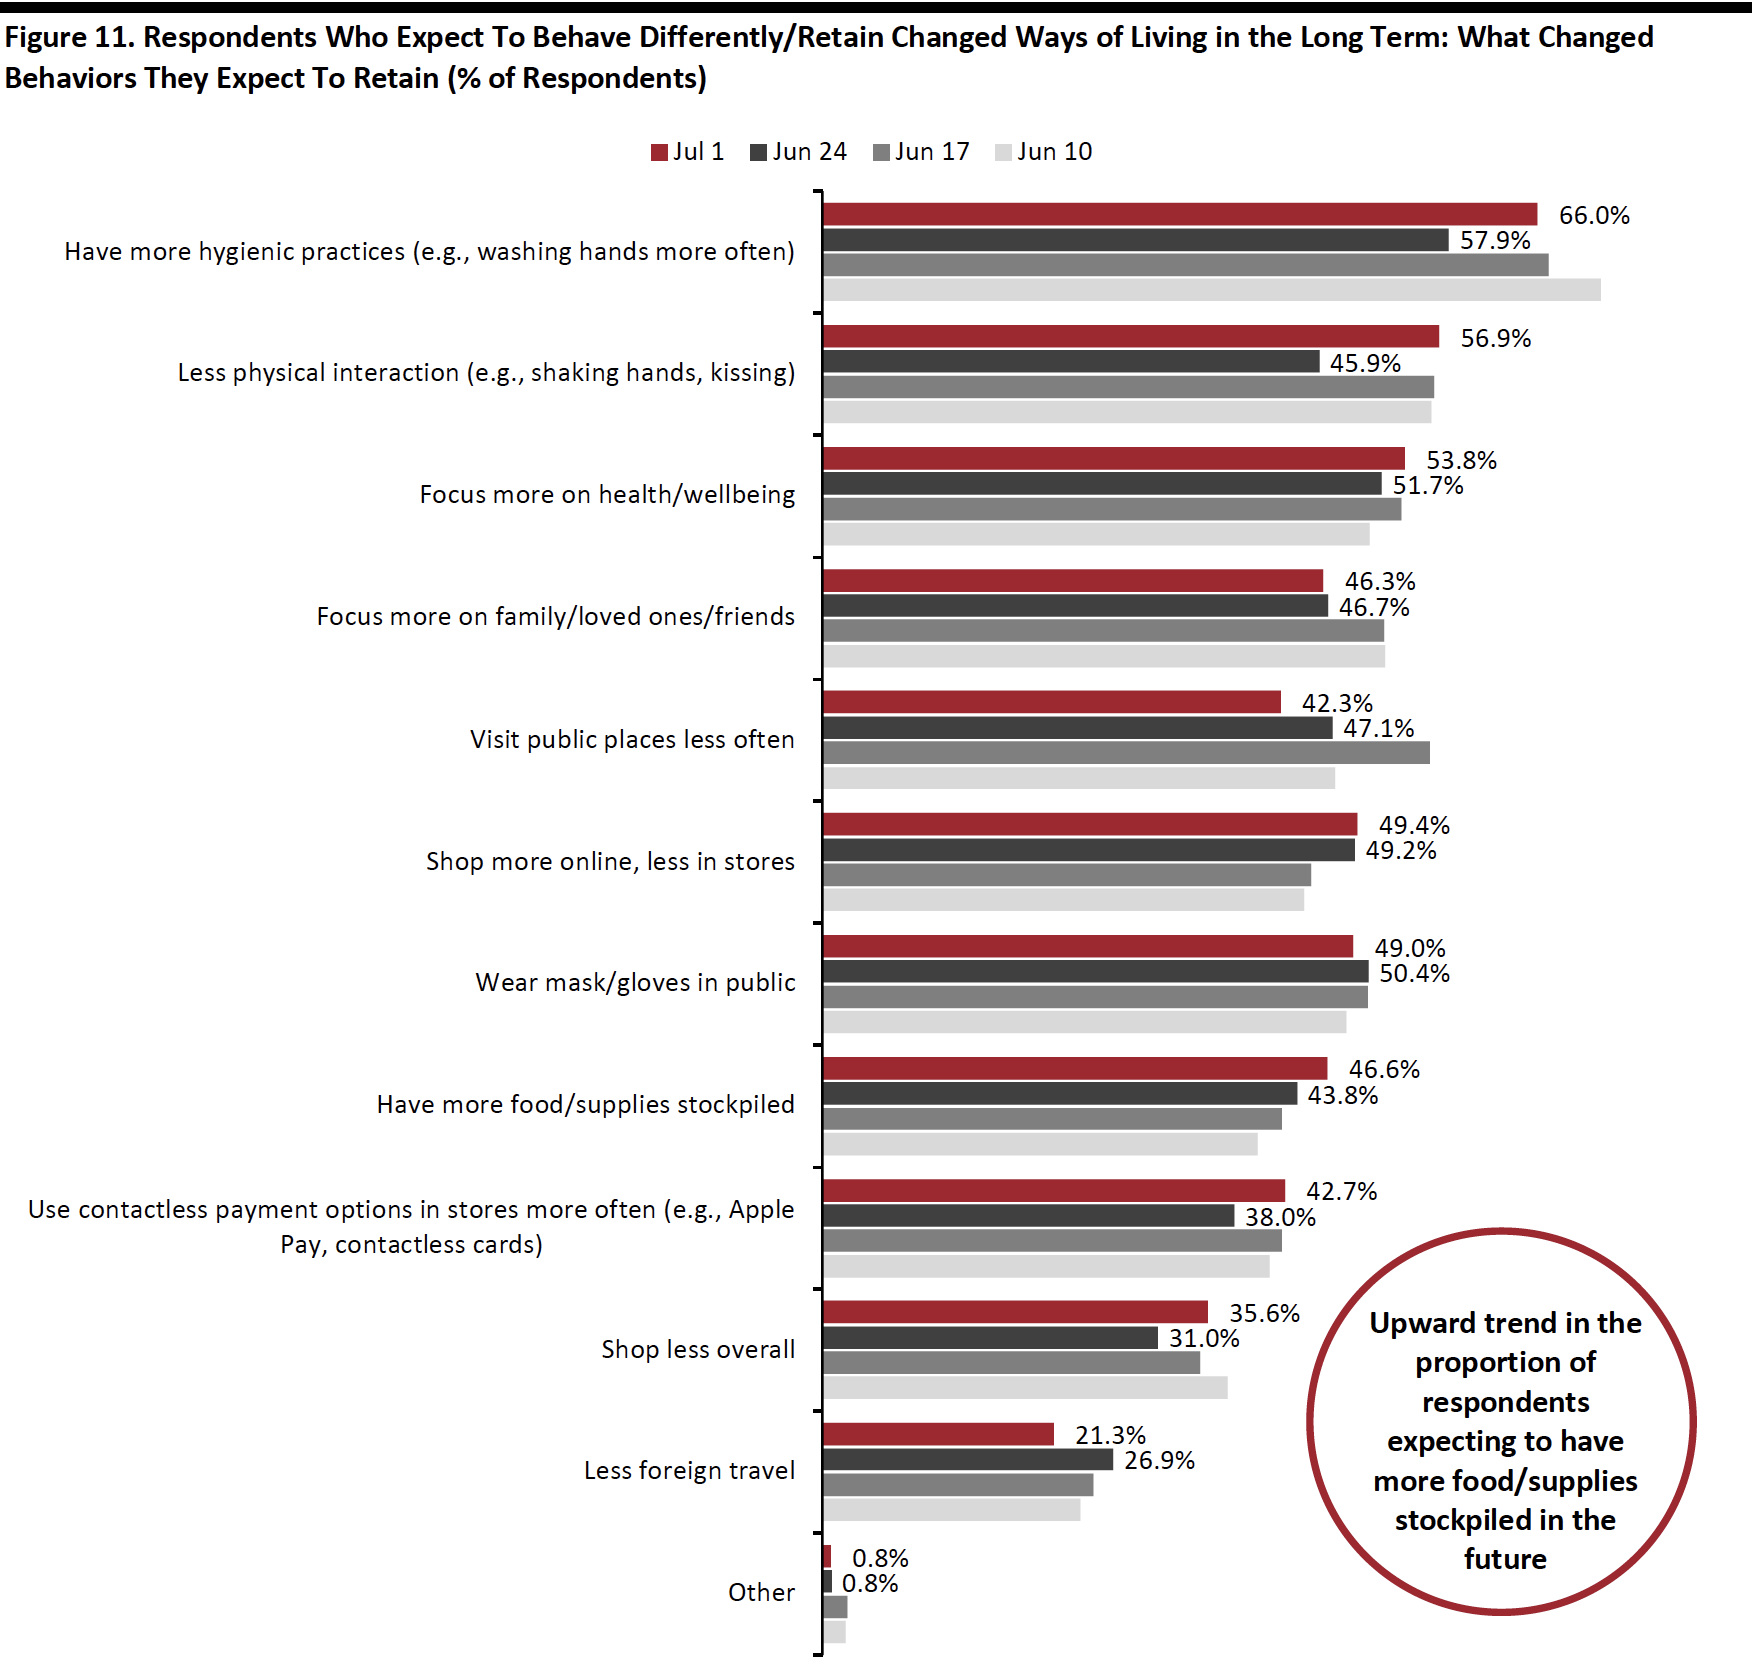 Respondents could select multiple options
Base: US Internet users aged 18+ who expect to behave differently in the long term/retain changed ways of living from the outbreak
Source: Coresight Research[/caption]
In the chart below, we focus on trending data in three of the metrics charted above. We represent these as a proportion of all respondents, to represent consumers overall, rather than as a proportion of those expecting to retain changed behaviors (which is what charted above).
Rebased to all respondents, we saw some fluctuations in the proportion of respondents who expect to shop less overall and shop more online. Although slightly more consumers expect to shop less overall this week—at 20.3% from 18.2% last week—the trend seems to be past its peak. Expectations of shopping more online broadly leveled off.
The proportion of respondents expecting to visit public places fell back again after reaching the peak of 34.3% in the week of June 17. Some 24.1% expect to do so this week, compared to 27.7% last week.
[caption id="attachment_112405" align="aligncenter" width="700"]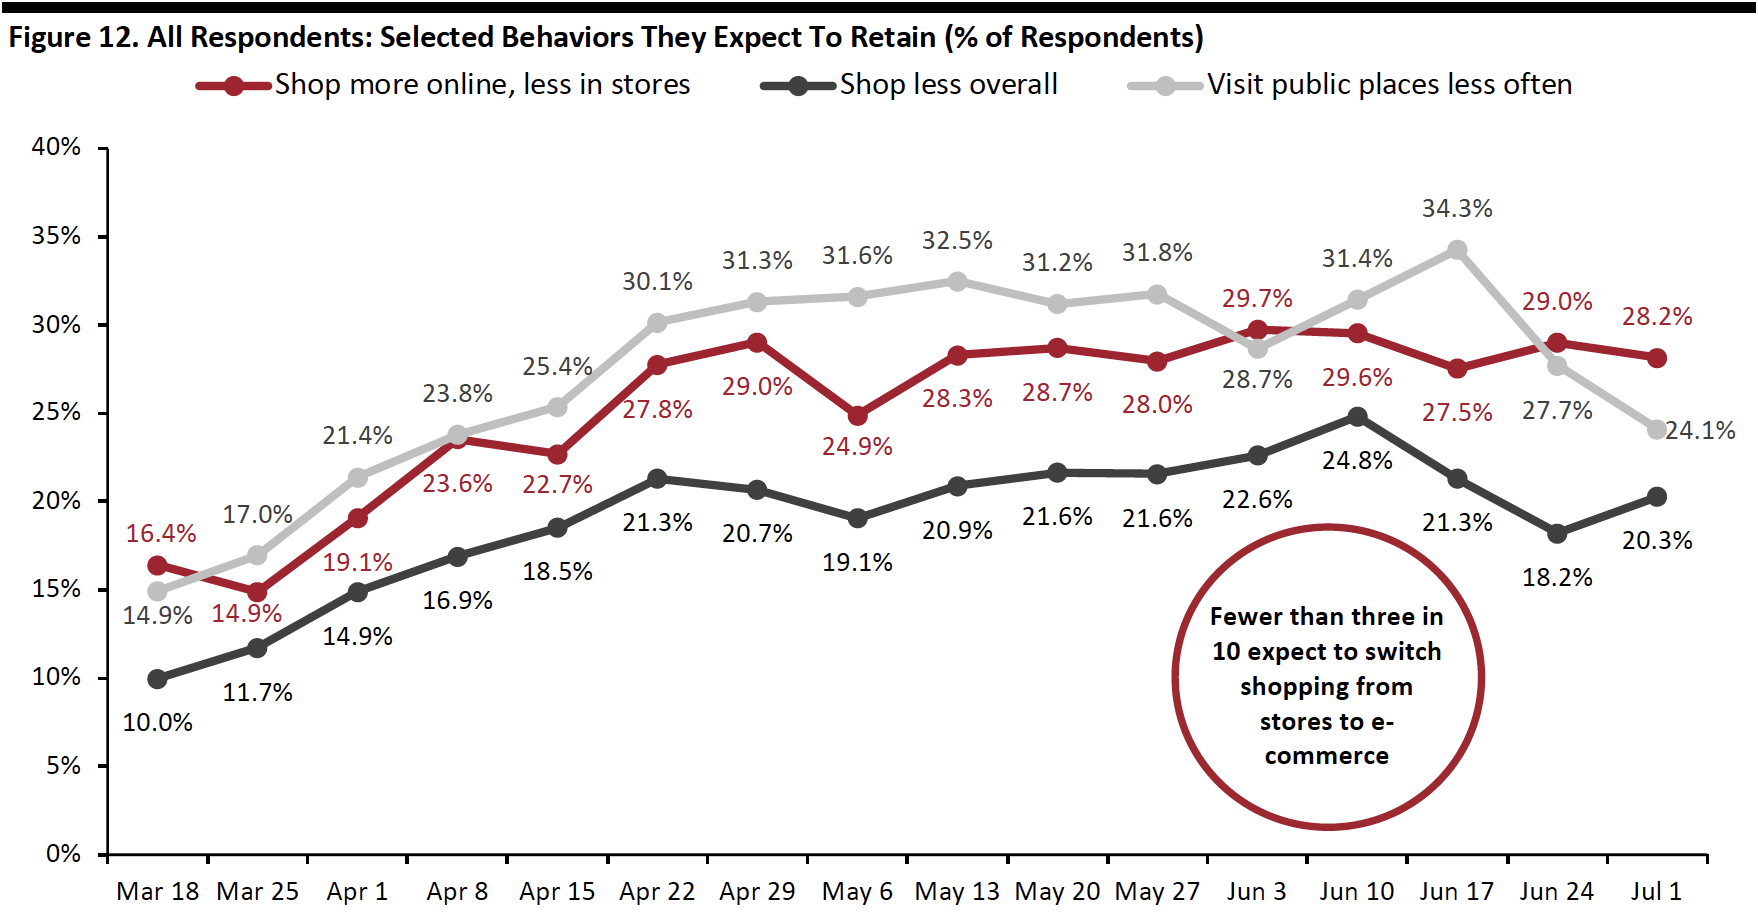 Base: US Internet users aged 18+
Source: Coresight Research[/caption]
Methodology
We surveyed respondents online on July 1 (444 respondents), June 24 (411 respondents), June 17 (432 respondents), June 10 (423 respondents), June 3 (464 respondents), May 27 (422 respondents), May 20 (439 respondents), May 13 (431 respondents), May 6 (446 respondents), April 29 (479 respondents), April 22 (418 respondents), April 15 (410 respondents), April 8 (450 respondents), April 1 (477 respondents), March 25 (495 respondents) and March 17–18 (1,152 respondents). The most recent results have a margin of error of +/- 5%, with a 95% confidence interval. Not all charted week-over-week differences may be statistically significant.