
albert Chan
Introduction
This report presents the results of Coresight Research’s latest weekly survey of US consumers on the coronavirus outbreak, undertaken on June 3. This report explores the trends we are seeing from week to week, following prior surveys on May 27, May 20, May 13, May 6, April 29, April 22, April 15, April 8, April 1, March 25 and March 17–18.
Consumers Turn Against “Made in China” Products
US Consumers Become Hostile toward China-Made Products
This week, we asked two questions about consumers’ attitudes to “Made in China” products in the wake of the coronavirus outbreak.
- We asked respondents if they agreed with the statement, “US retailers should source fewer products from China because of the coronavirus pandemic.”
- We asked respondents if the coronavirus has had any effect on their willingness to buy products that are made in China.
Almost Half Think US Retailers Should Reduce China Sourcing
A noticeable number of US respondents have a negative attitude toward Chinese products due to the coronavirus pandemic.
Some 47.8% of all respondents agree or strongly agree with the statement, “US retailers should source fewer products from China.” Alongside heightened political rhetoric, this is a further indication that US retailers should review the extent of their reliance on China as a manufacturing hub—and whether that is evident to their customers.
Some 39.7% said the pandemic has made them less willing to buy “Made in China” products, indicating a mistrust among US consumers about China-made products and a backlash over the coronavirus.
The eight-percentage-point mismatch between these two figures could be explained by some consumers already holding negative views of sourcing in China pre-crisis—so their willingness to buy China-made products hasn’t changed.
Despite heightened negative perceptions, in terms of willingness to buy China-made products, the most popular response is nevertheless “no change.”
[caption id="attachment_110929" align="aligncenter" width="700"]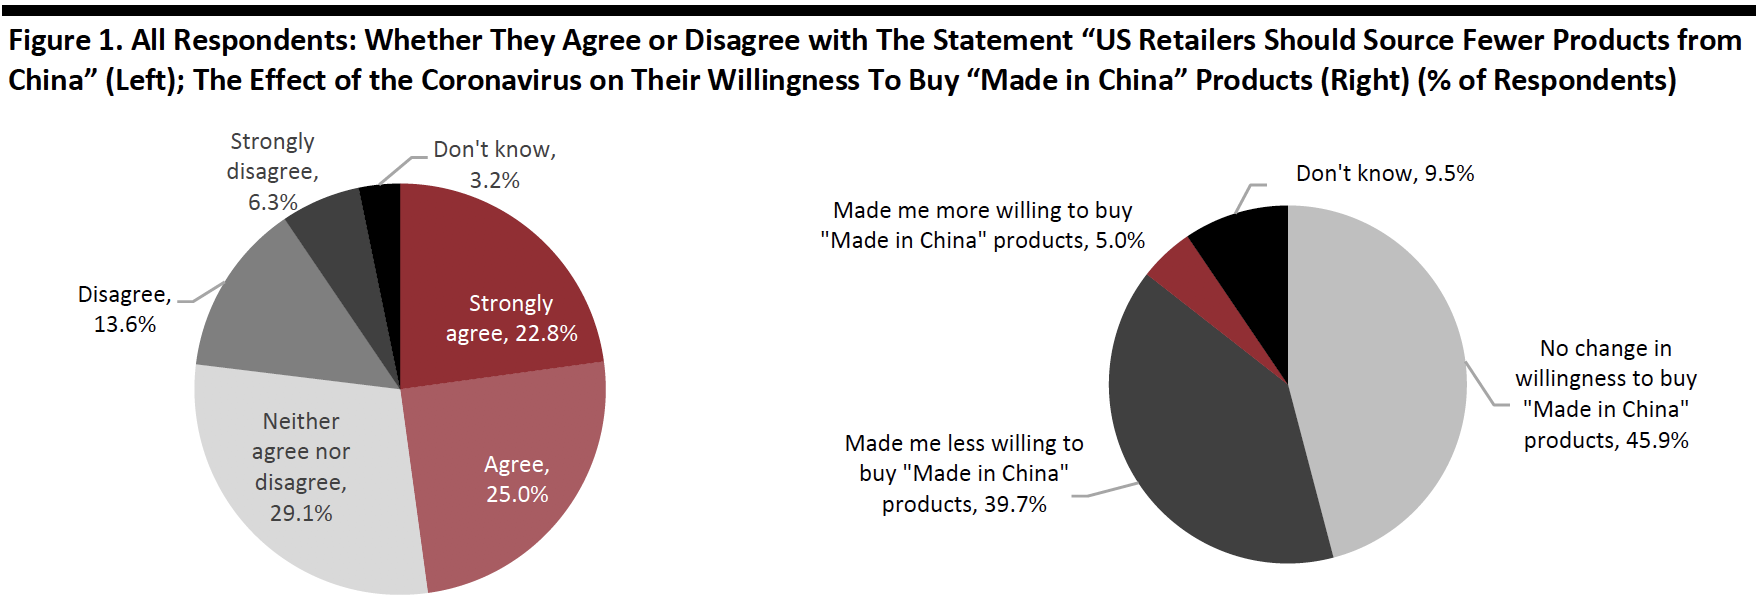 Base: US Internet users aged 18+
Source: Coresight Research[/caption]
Older Consumers Are More Likely To Turn Away from China-Made Products
Taking a closer look by age, we saw older consumers agree with the statement more than other age groups. Some 59.5% of respondents aged over 60 agree or strongly agree that US retailers should reduce the proportion of products sourced from China.
This is further supported by the result from the second question, where we saw the highest proportion of respondents who are less willing to buy “Made in China” products in the over-60 age group (at 53.7%).
[caption id="attachment_110930" align="aligncenter" width="700"]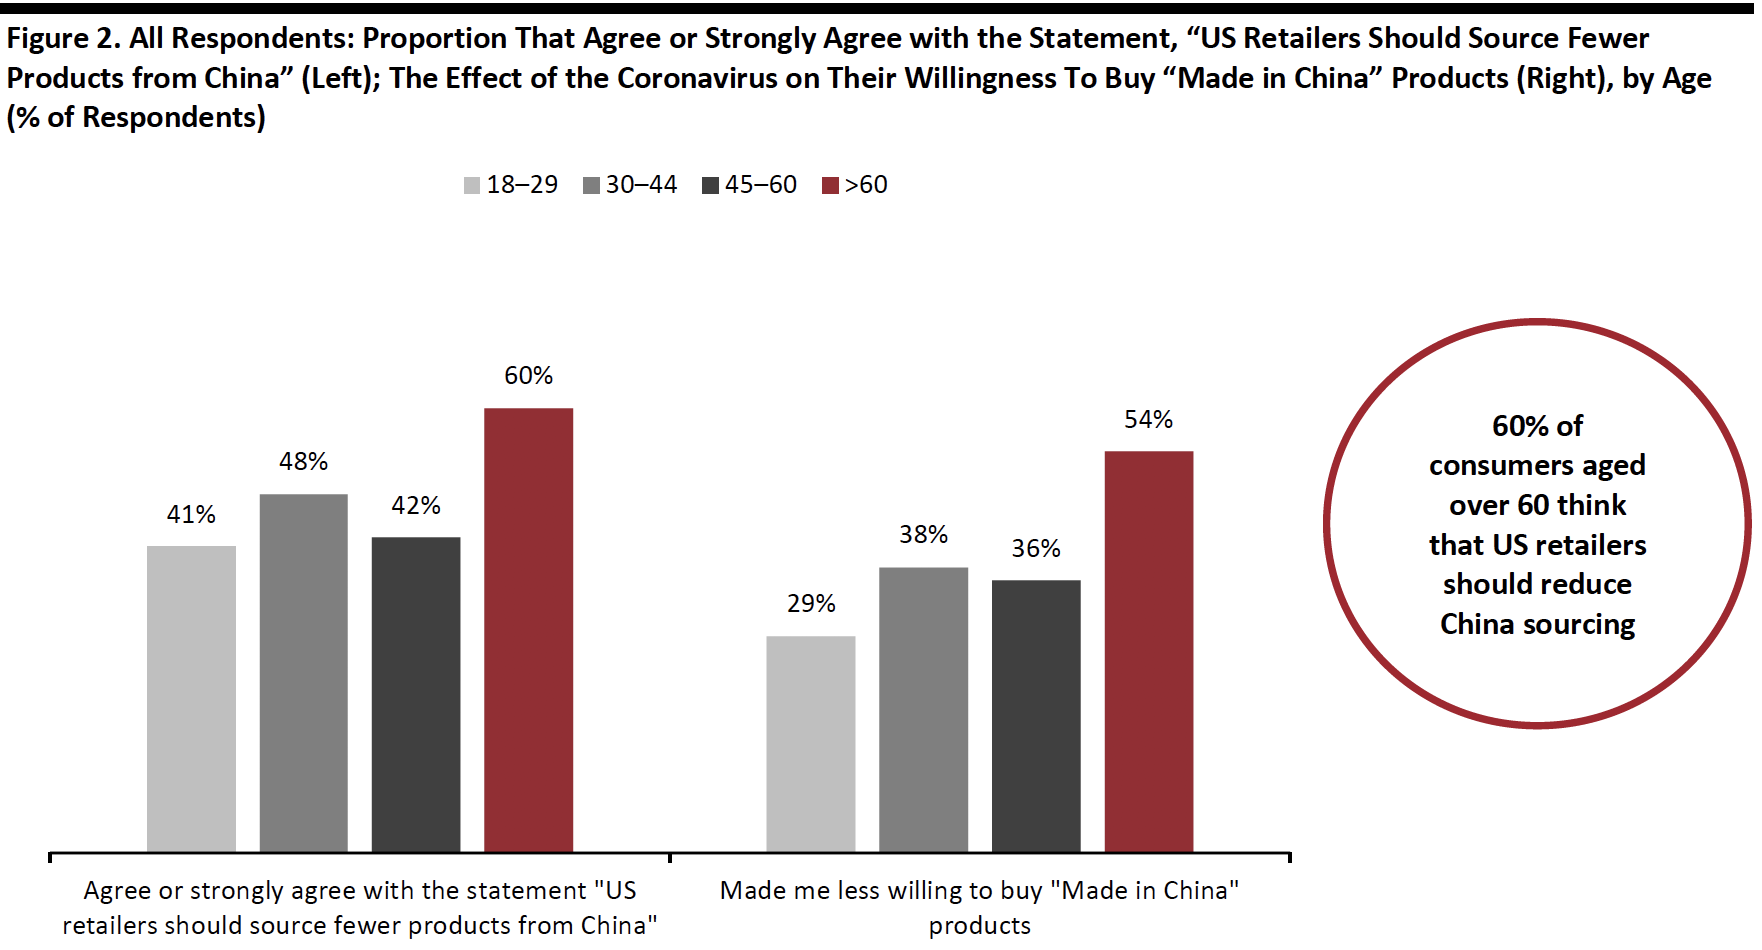 Base: US Internet users aged 18+
Source: Coresight Research[/caption]
Looking Beyond Lockdown
A Little Over Two-Fifths of Consumers Expect To Avoid Shopping Centers
Consumers’ concern about returning to public places increased a little after a meaningful decline of eight percentage points last week (albeit this week’s change is within the margin of error): 68.3% of all respondents now anticipate avoiding some kind of public place or travel after lockdowns end, versus 67.1% last week. On the positive side, this week’s figure is still much lower compared to those in the week of May 13 (73.6%) and May 20 (75.6%).
We saw a decline of avoidance in 11 of the 14 options we provided, although most within the margin of error. A notable change this week was in the expected avoidance of community centers, which saw a decrease of almost six percentage points.
The proportion of respondents expecting to avoid food-service locations and shopping centers/malls moderated this week after a decline last week. Some 45% of all consumers now expect to avoid shopping centers/malls, which is the lowest proportion of respondents since we started asking the question.
[caption id="attachment_110931" align="aligncenter" width="700"]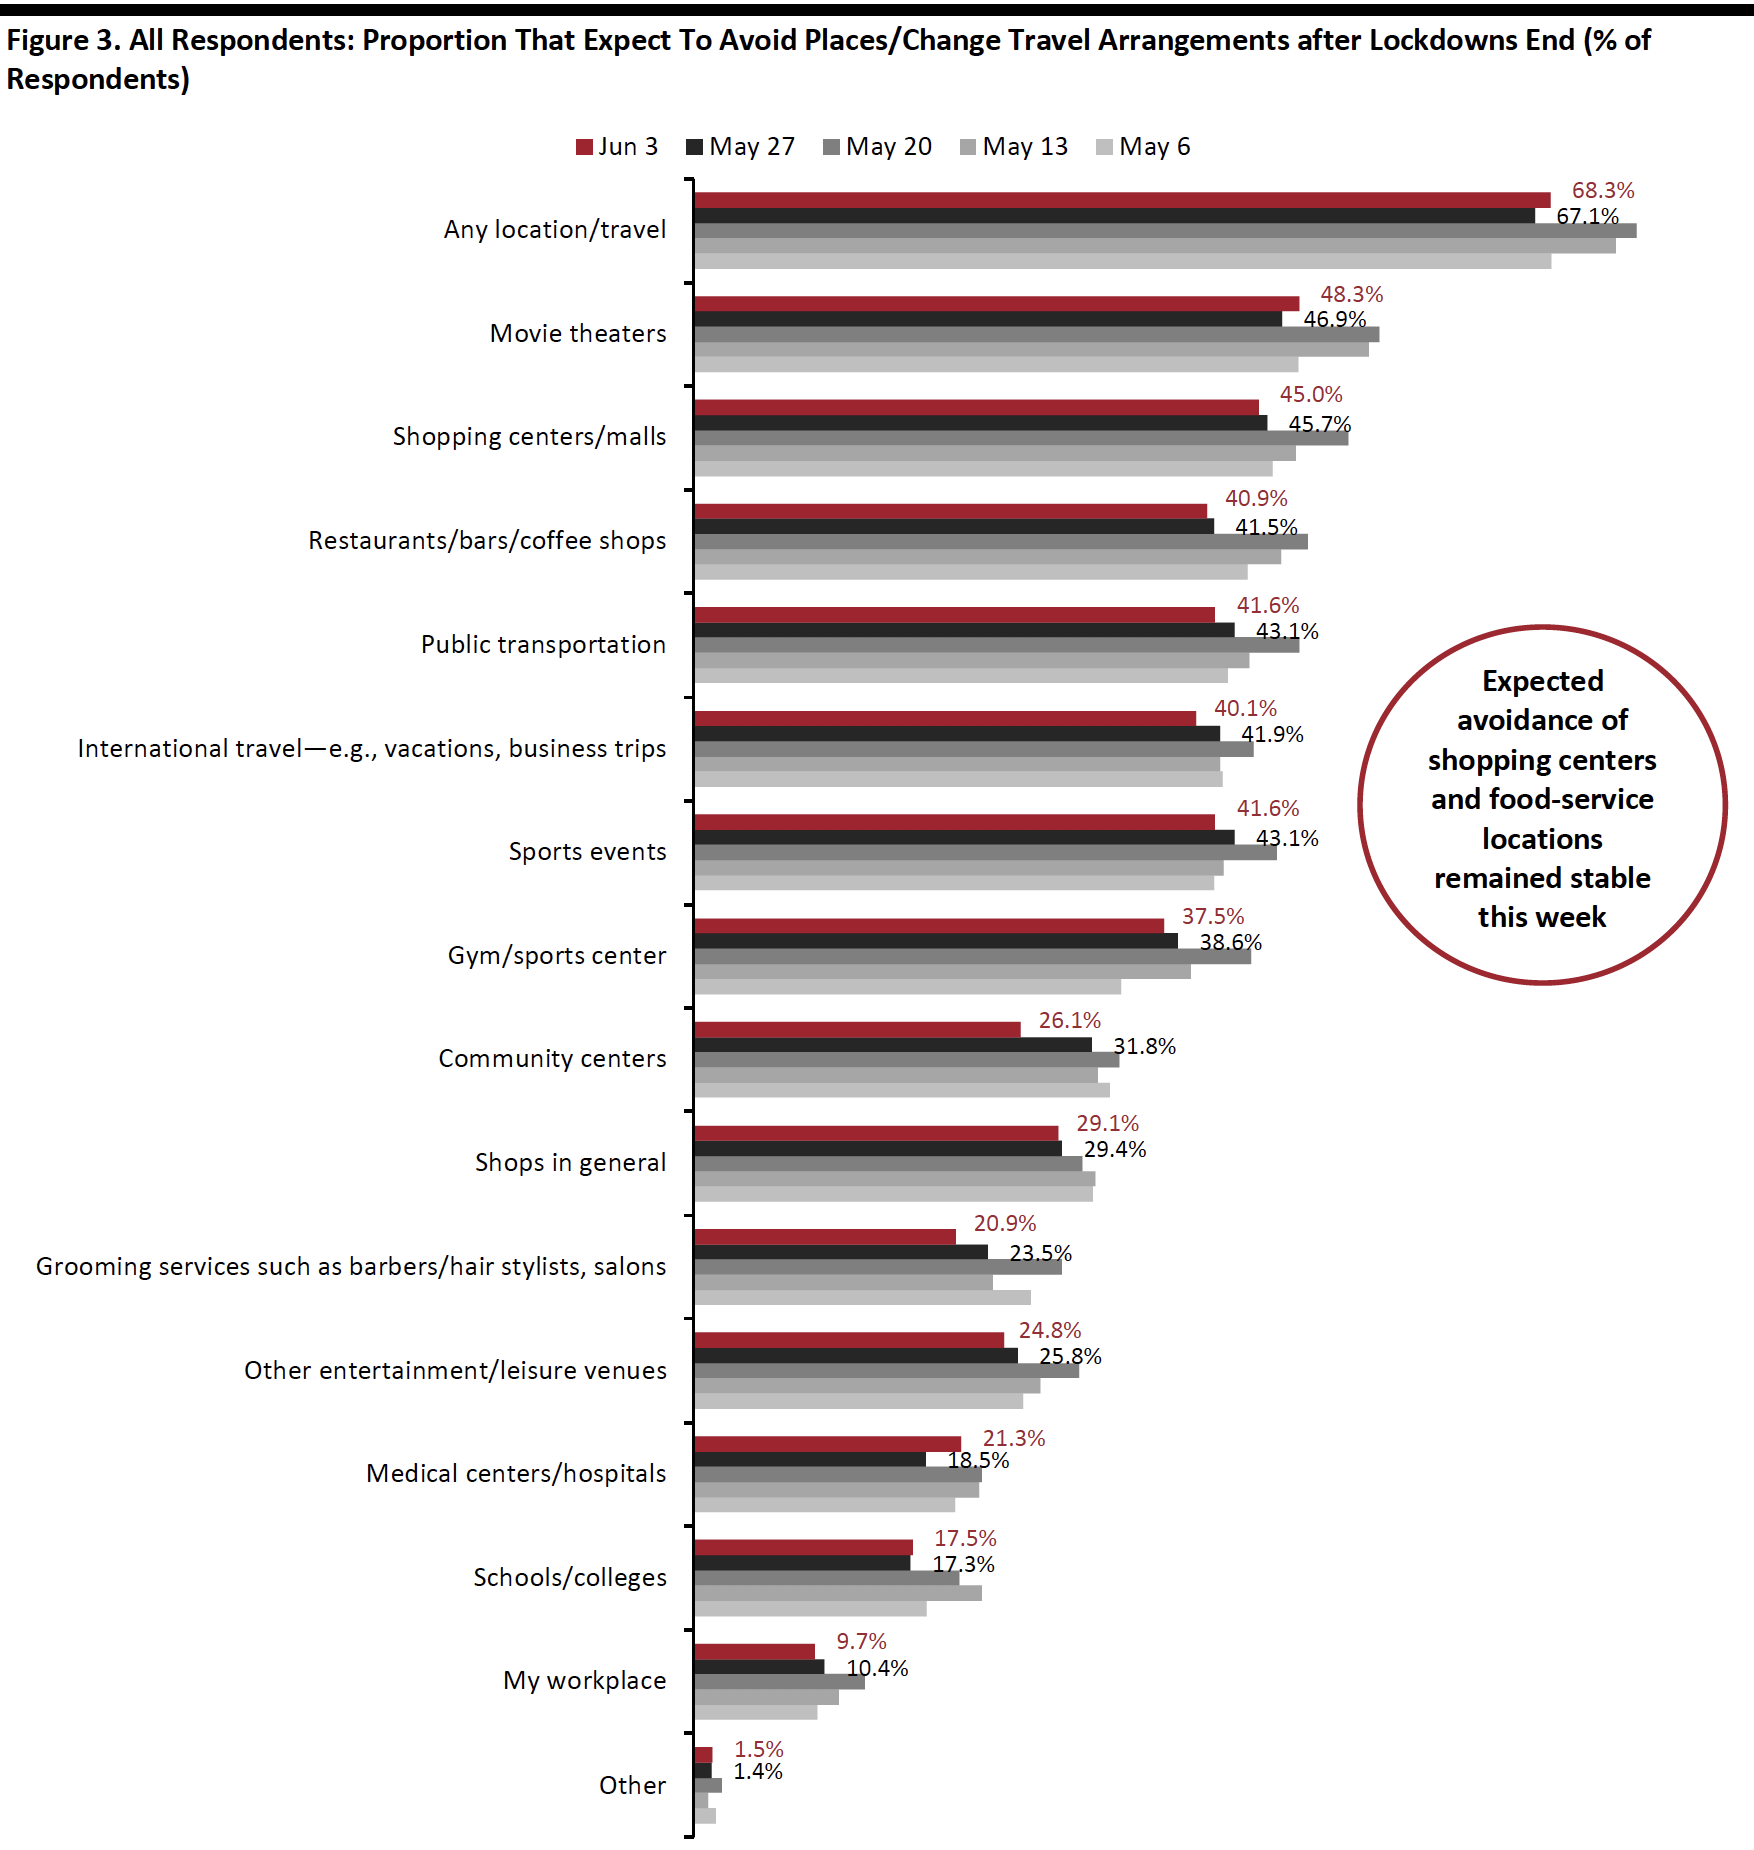 Respondents could select multiple options
Base: US Internet users aged 18+
Source: Coresight Research[/caption]
Expectation To Avoid Public Places for More Than Six Months Jumps Back Slightly
Similarly, avoidance actions in long-term also increased slightly after the drop last week. Among those expecting to avoid public places or travel after lockdowns end, 38.5% expect to do so for more than six months, up from 33.2% last week. There has been some fluctuation in this figure since the week of May 13.
Once again, we noticed only a fraction of respondents expect to avoid public places for less than one month.
A total of 75.7% of respondents expect to avoid places for three months or more, slightly up from 72.1% last week.
[caption id="attachment_110932" align="aligncenter" width="700"]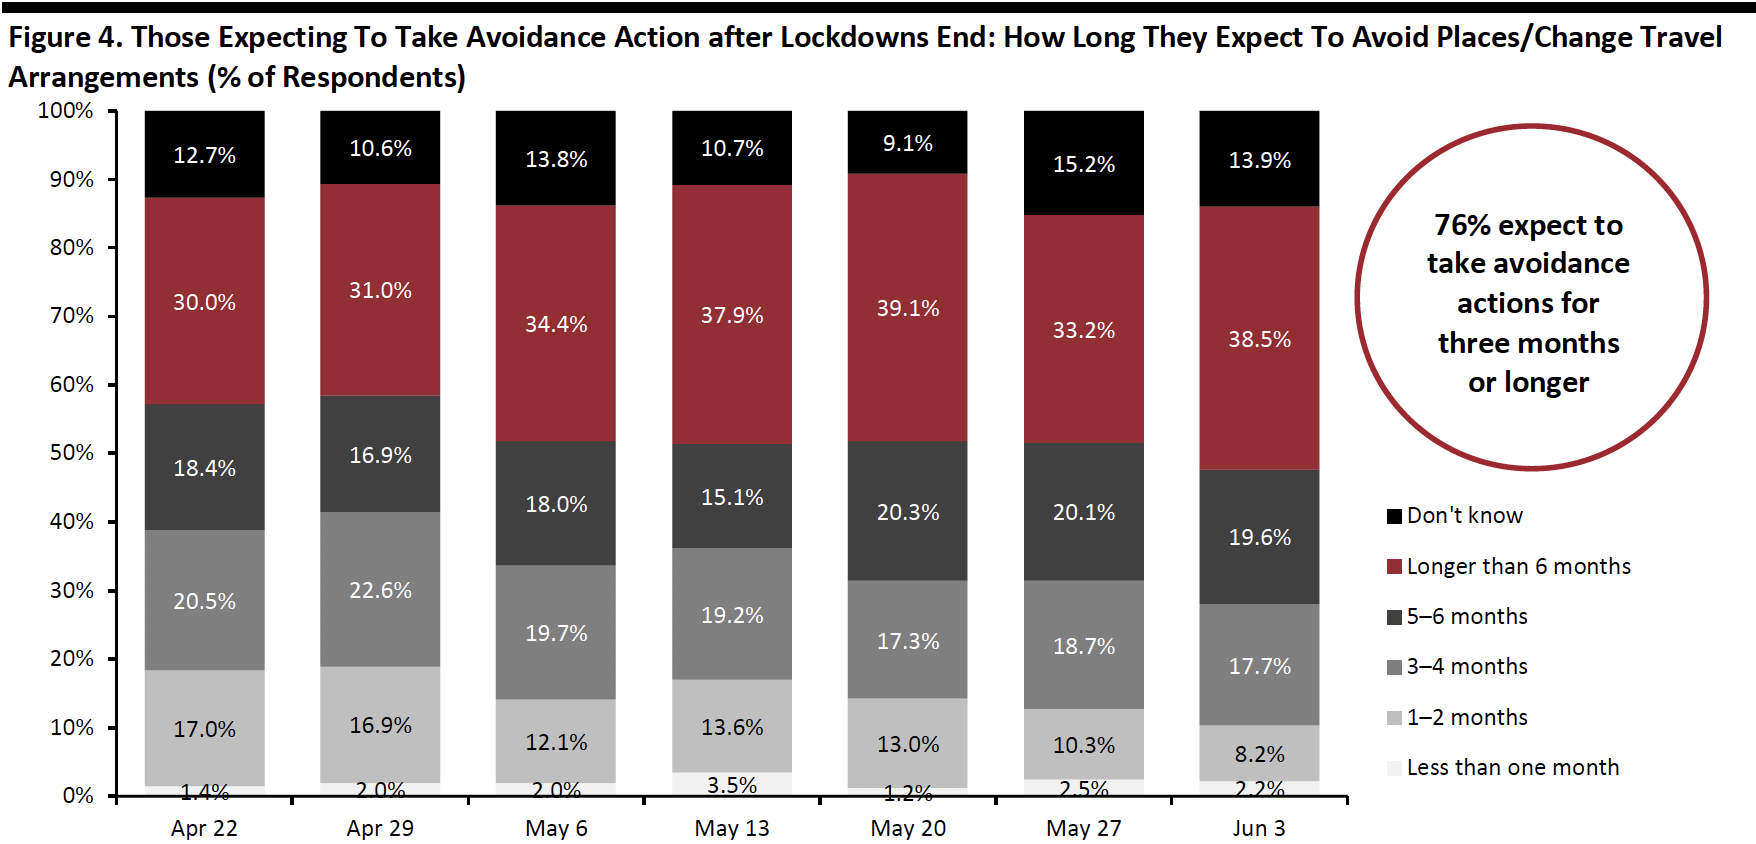 Base: US Internet users aged 18+ who expect to avoid places/change travel arrangements after lockdowns end
Source: Coresight Research[/caption]
A Little Below Two-Thirds Expect To Retain Changed Behaviors for the Long Term
Each week, we ask respondents whether they think they will keep some of the behaviors they have adopted during the coronavirus crisis. This week, some 63.2% of respondents expecting to retain some changed behaviors over the long terms, slightly down from around two-thirds in the past couple of weeks and marking the third consecutive week of slight decreases.
[caption id="attachment_110933" align="aligncenter" width="700"]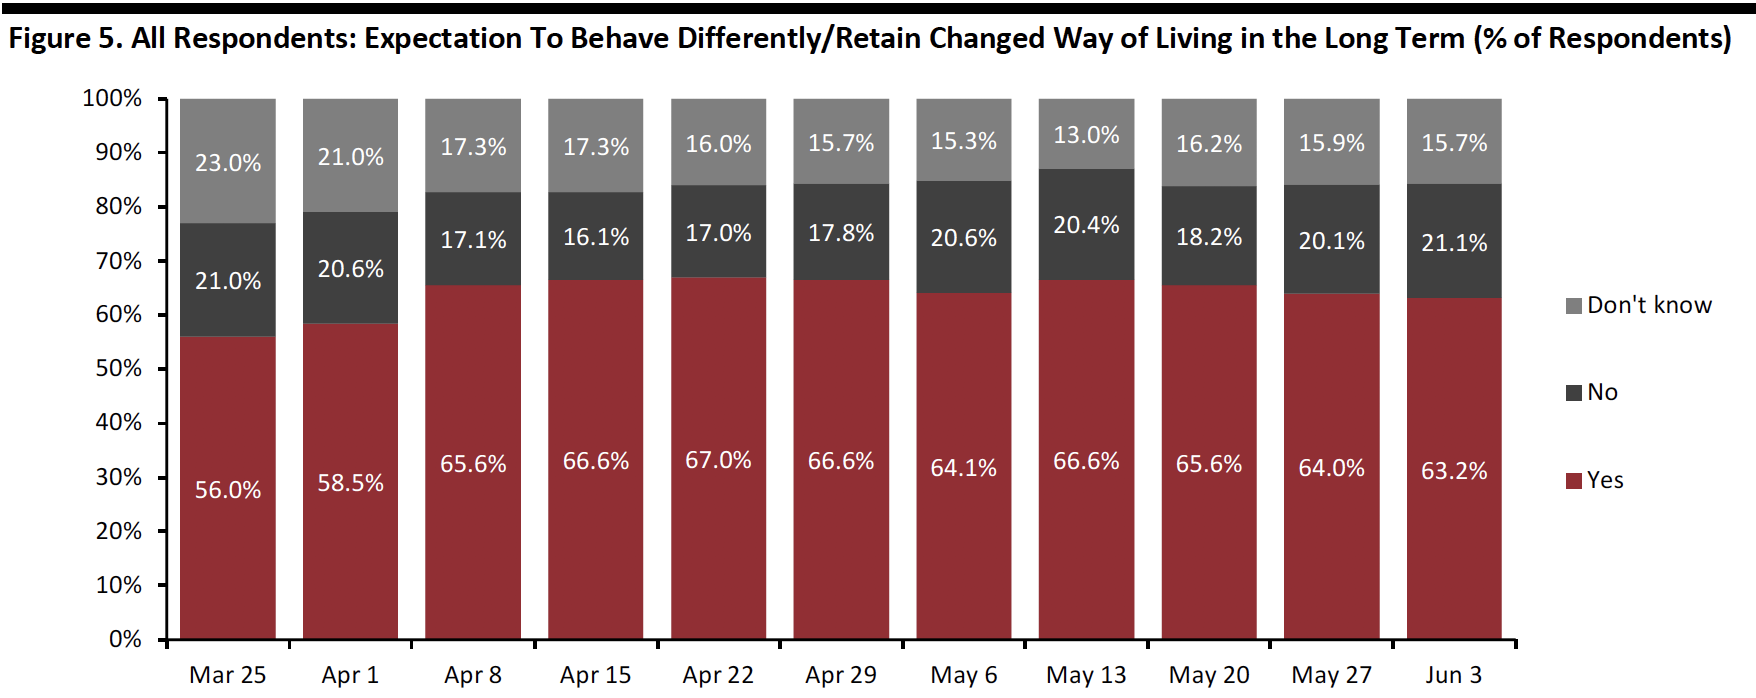 Base: US Internet users aged 18+
Source: Coresight Research[/caption]
Among those expecting to retain changed behaviors, we have seen a near-consistent upward trend in expectations to wear masks/gloves in public, with half expecting to do so this week, a five-percentage-point surge from last week. This reflects improved awareness of preventive measures that consumers could take in public places.
Another noticeable change was in the proportion of respondents expecting to travel less internationally. Almost one-third said they would do so, up from one-quarter in last week. This underscores a longer recovery for international travel.
[caption id="attachment_110934" align="aligncenter" width="700"]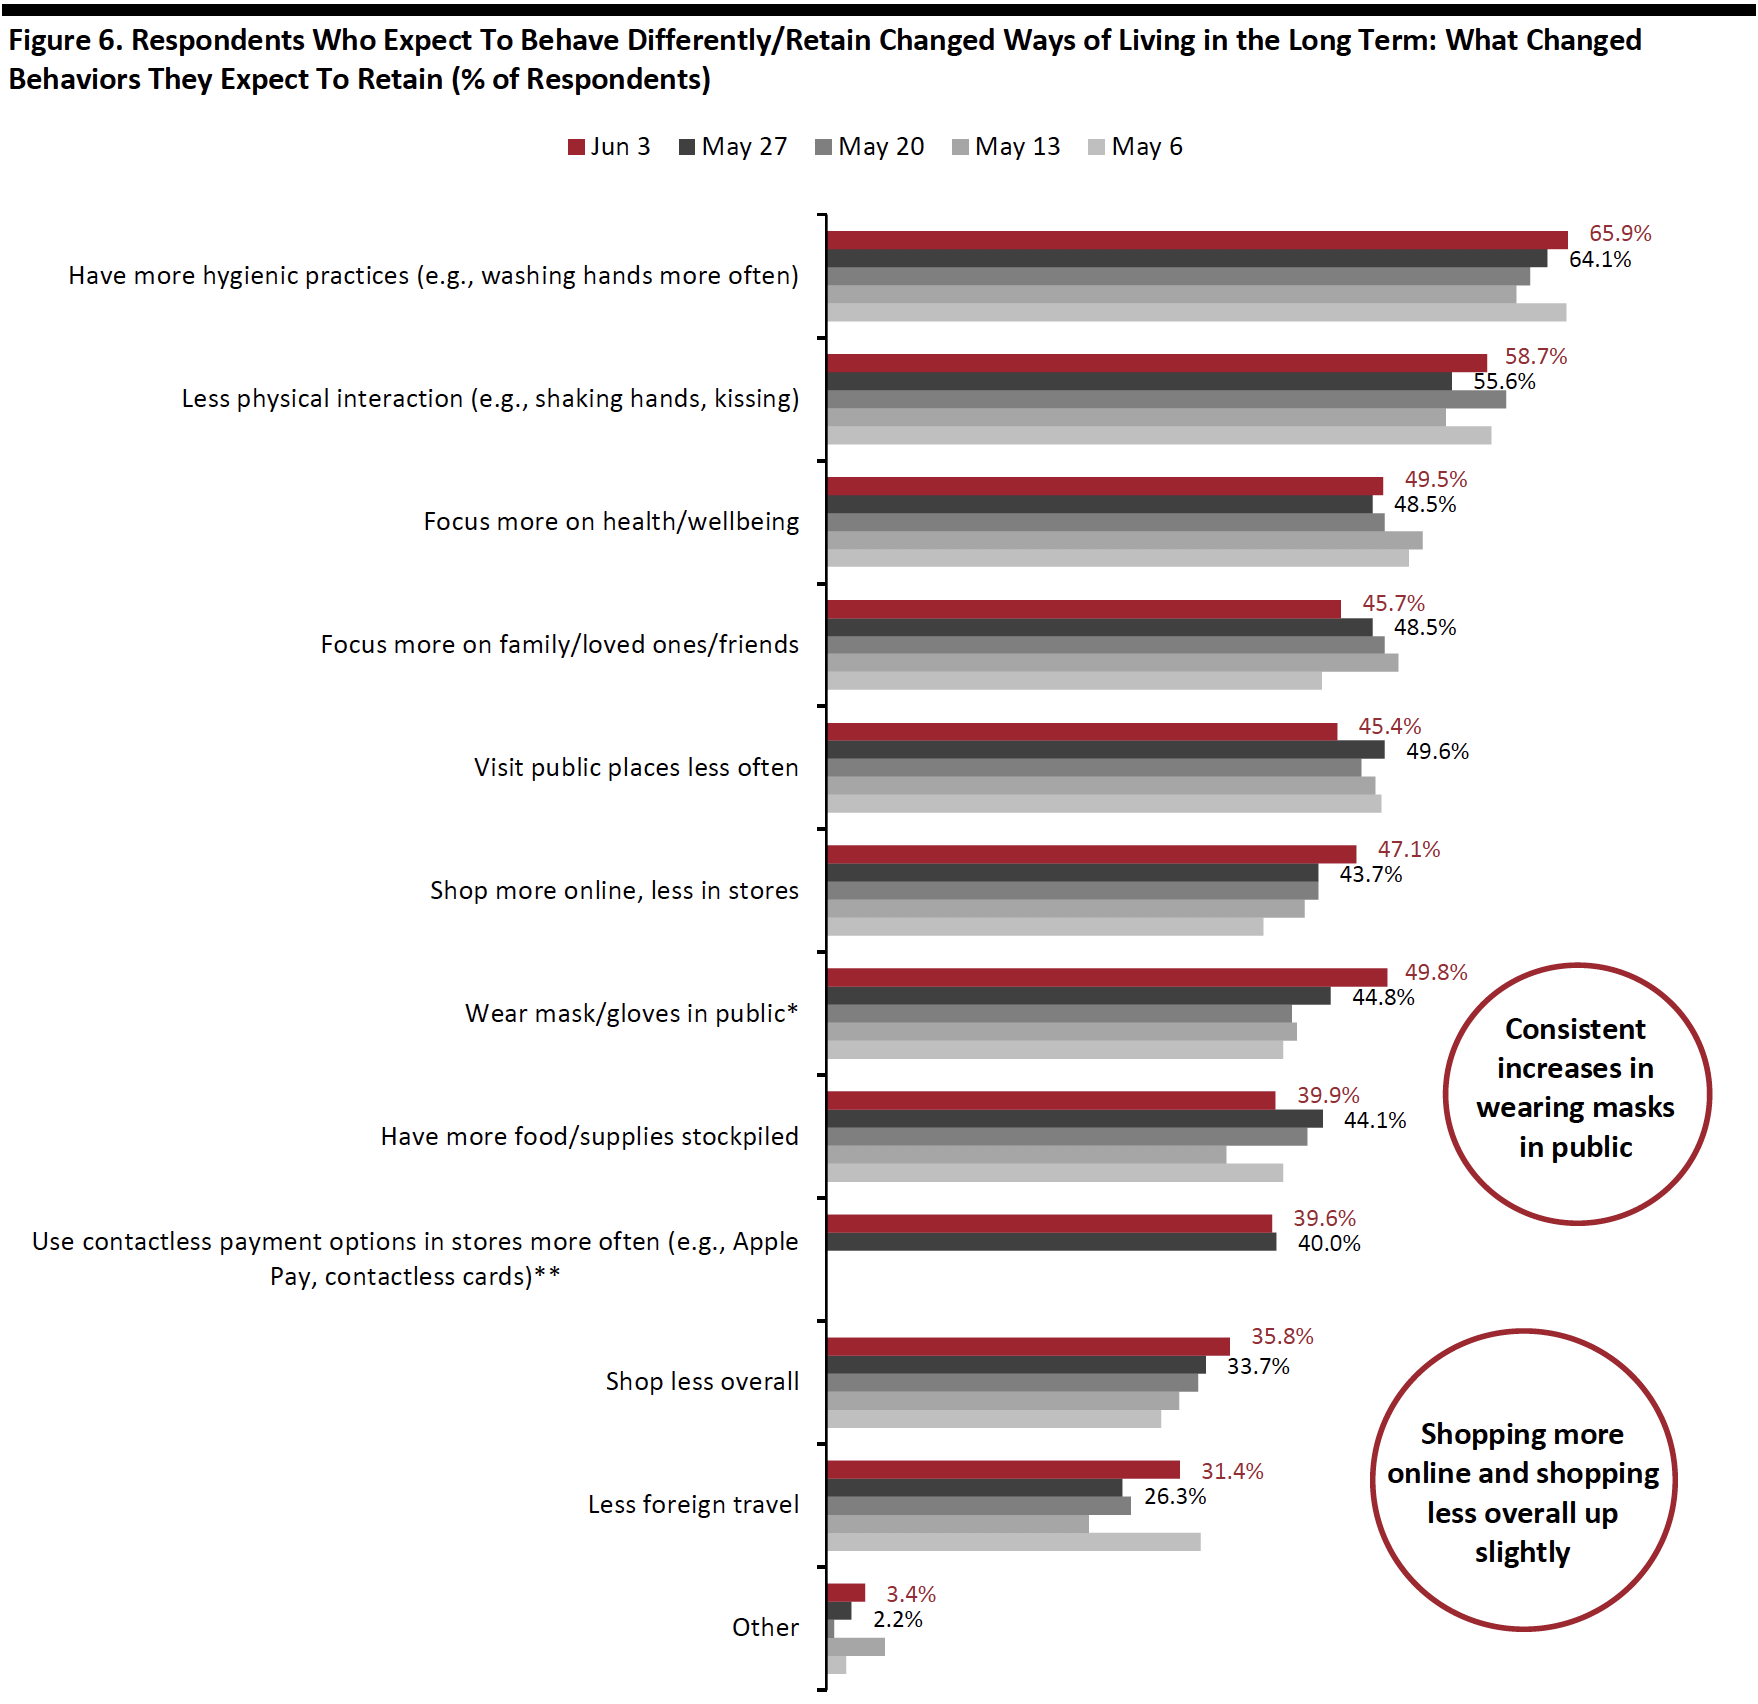 Respondents could select multiple options
*Not provided as an option before May 6
**Not provided as an option before May 27
Base: US Internet users aged 18+ who expect to behave differently in the long term/retain changed ways of living from the outbreak
Source: Coresight Research [/caption]
In the chart below, we focus on trending data in three of the metrics charted above. We represent these as a proportion of all respondents, to represent consumers overall, rather than as a proportion of those expecting to retain changed behaviors (which is what is charted above).
Rebased to all respondents, we have seen overall upward trends in expectations to retain changed shopping habits after tending to moderate in the past few weeks. Over one-fifth of respondents expect to shop less overall. Three in 10 expect to switch shopping to e-commerce, which is almost double that of when we first asked the question in mid-March.
On the other hand, the proportion of respondents expecting to visit public places less often fell back a little to 28.7% this week, compared to 31.8% last week and down from the 32.5% peak we saw in mid-May.
[caption id="attachment_110935" align="aligncenter" width="700"]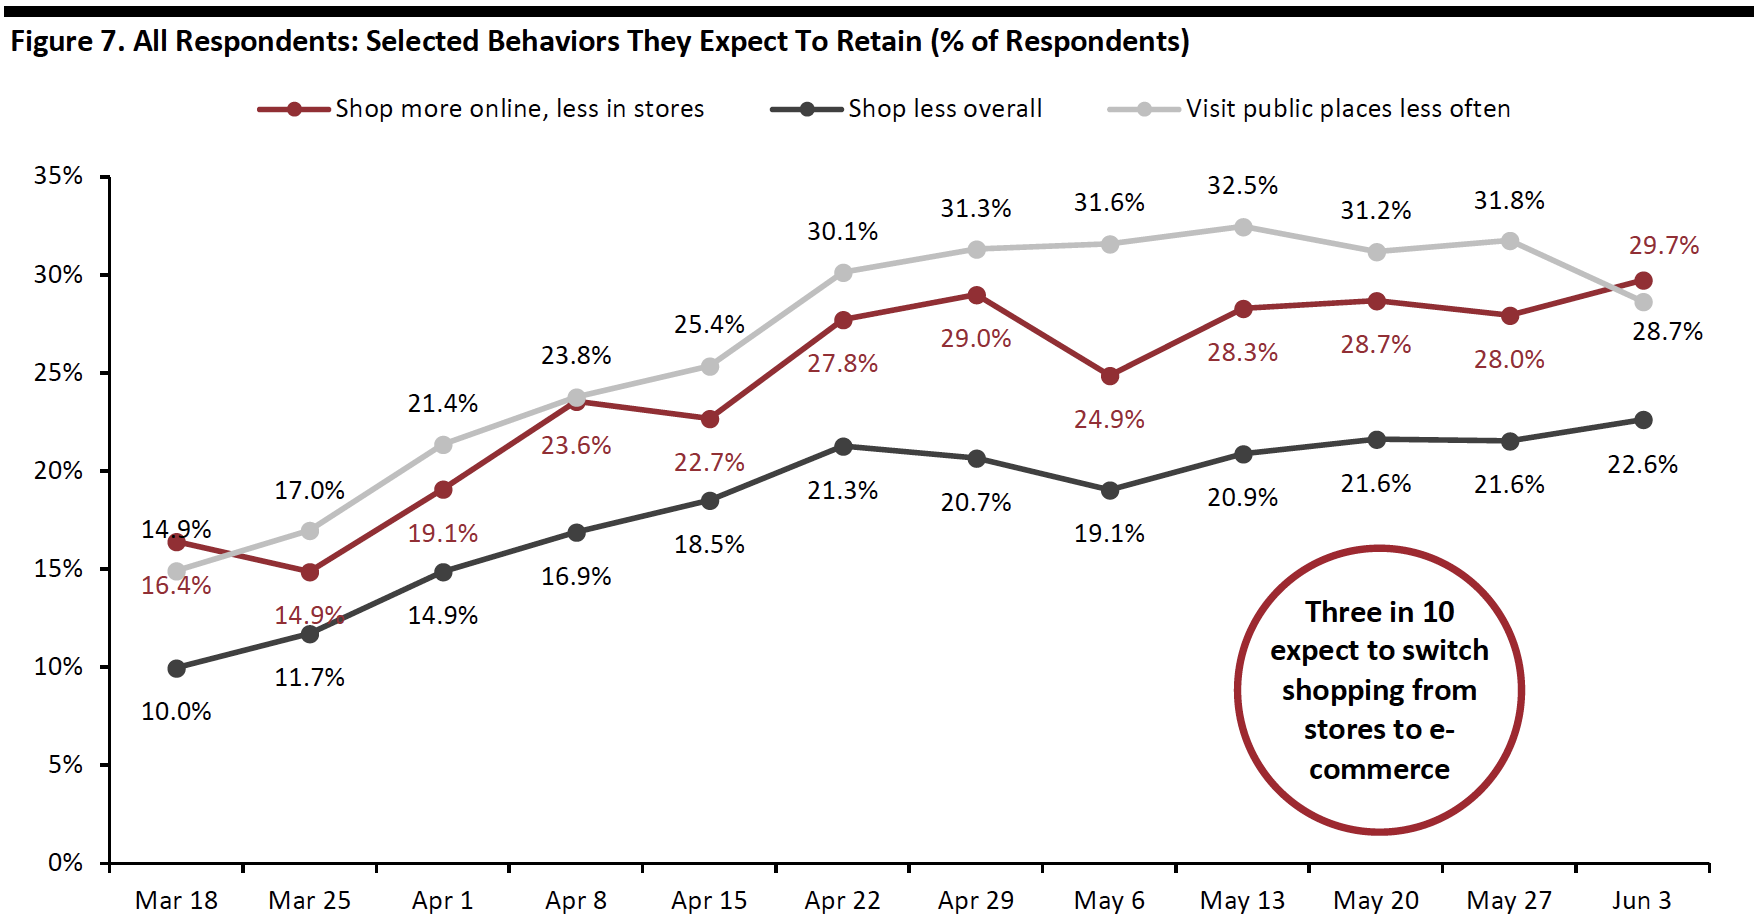 Base: US Internet users aged 18+
Source: Coresight Research[/caption]
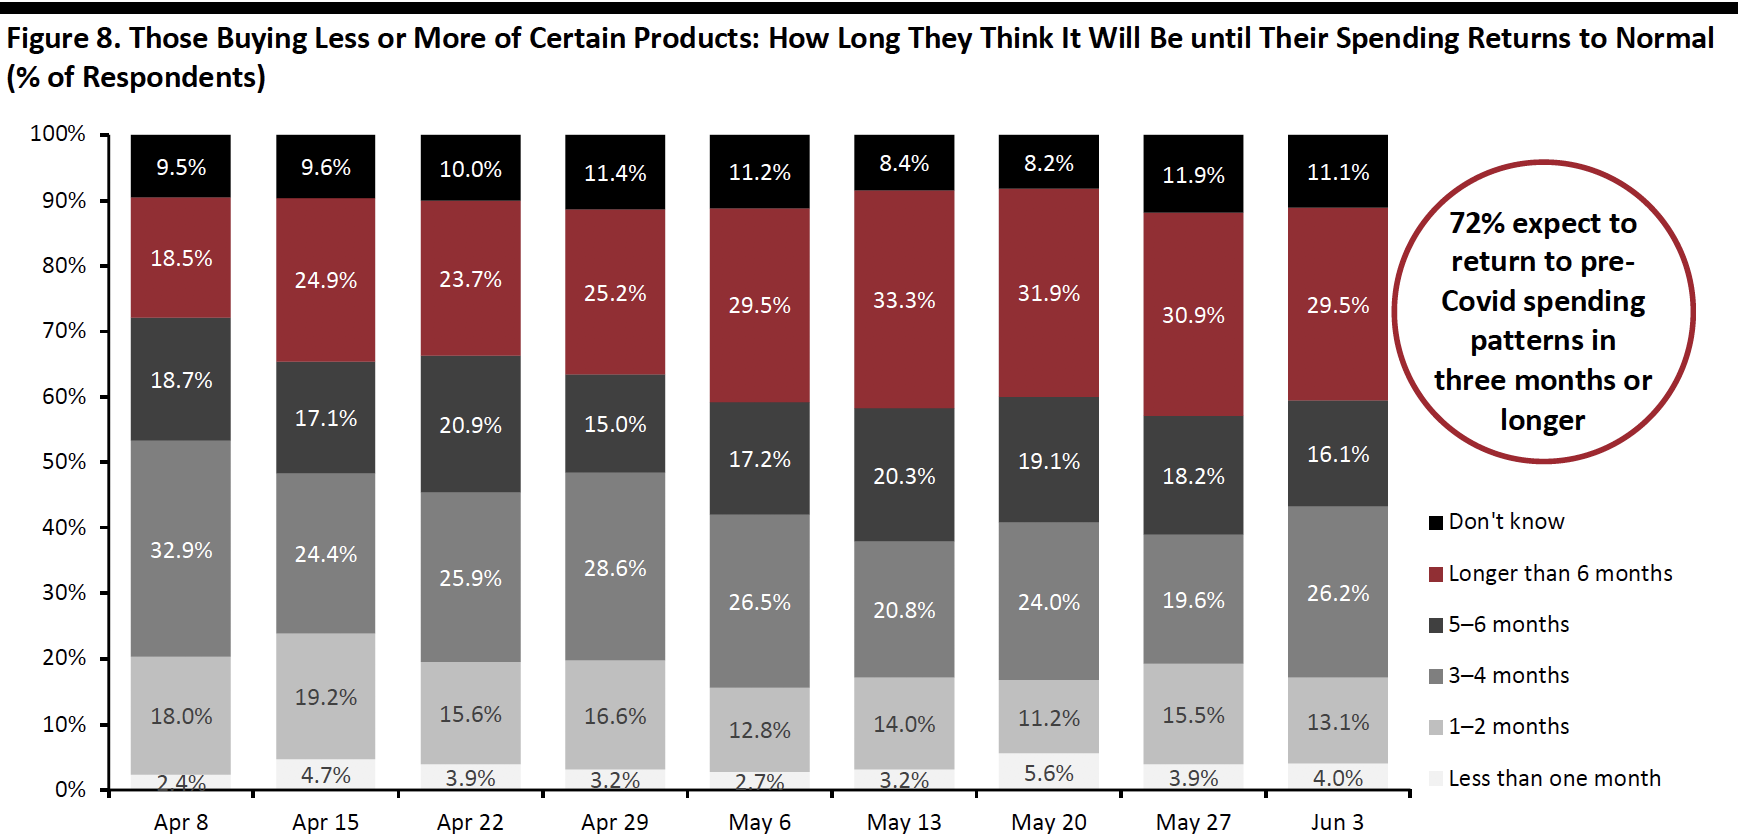
Less Than One-Third Expect To Retain Changed Spending Patterns for More Than Six Months
This week, we continued to witness a declining trend in the proportion of respondents anticipating longer-term impacts on their spending, signaling a positive sign for retailers. Among consumers who have changed their spending levels—by buying more or less of any categories—29.5% expect it to be more than six months from now before their spending patterns return to normal, versus 30.9% last week and 31.9% the week before that (although these changes are both within the margin of error).
A six-month-plus window now takes us up to the beginning of December at the earliest. This may prove disappointing to retailers as it suggests the weakness in consumer demand will persist into the crucial holiday season.
A total of 71.8% of respondents expect to keep their changed purchasing behaviors for three months or more, slightly up from 68.8% last week.
Focusing only on those making fewer purchases, 31.4% expect to return to pre-crisis spending patterns only in more than six months’ time, versus 33.3% last week and 32.8% in the week before (Figure 9).
- We show what consumers are buying more of and less of in a separate section later in this report.
 Base: US Internet users aged 18+ who are purchasing any products more or less, because of the coronavirus outbreak
Source: Coresight Research[/caption] [caption id="attachment_110937" align="aligncenter" width="700"]
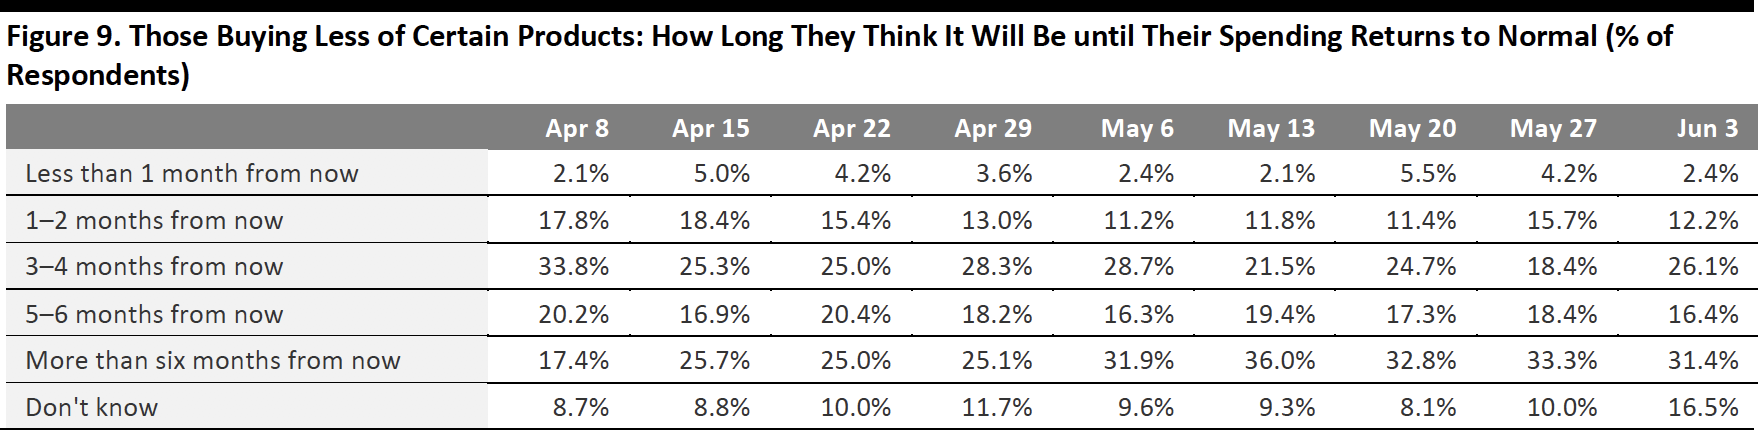 Base: US Internet users aged 18+ who are purchasing any products less, because of the coronavirus outbreak
Totals may not sum due to rounding
Source: Coresight Research[/caption]
Over Three-Fifths of Consumers Expect the Crisis To Last More Than Six Months
This week, consumers’ expectations of the length of the crisis jumped back up slightly after the decline in last week. Fully 61.0% now expect the severe impact of the outbreak to last more than six months from its start, compared to 58.5% last week.
As we are now beyond two months since the crisis began, the proportion of respondents expecting the severe impact to last three months or more is high at 94.0%, broadly in line with last week.
[caption id="attachment_110938" align="aligncenter" width="700"]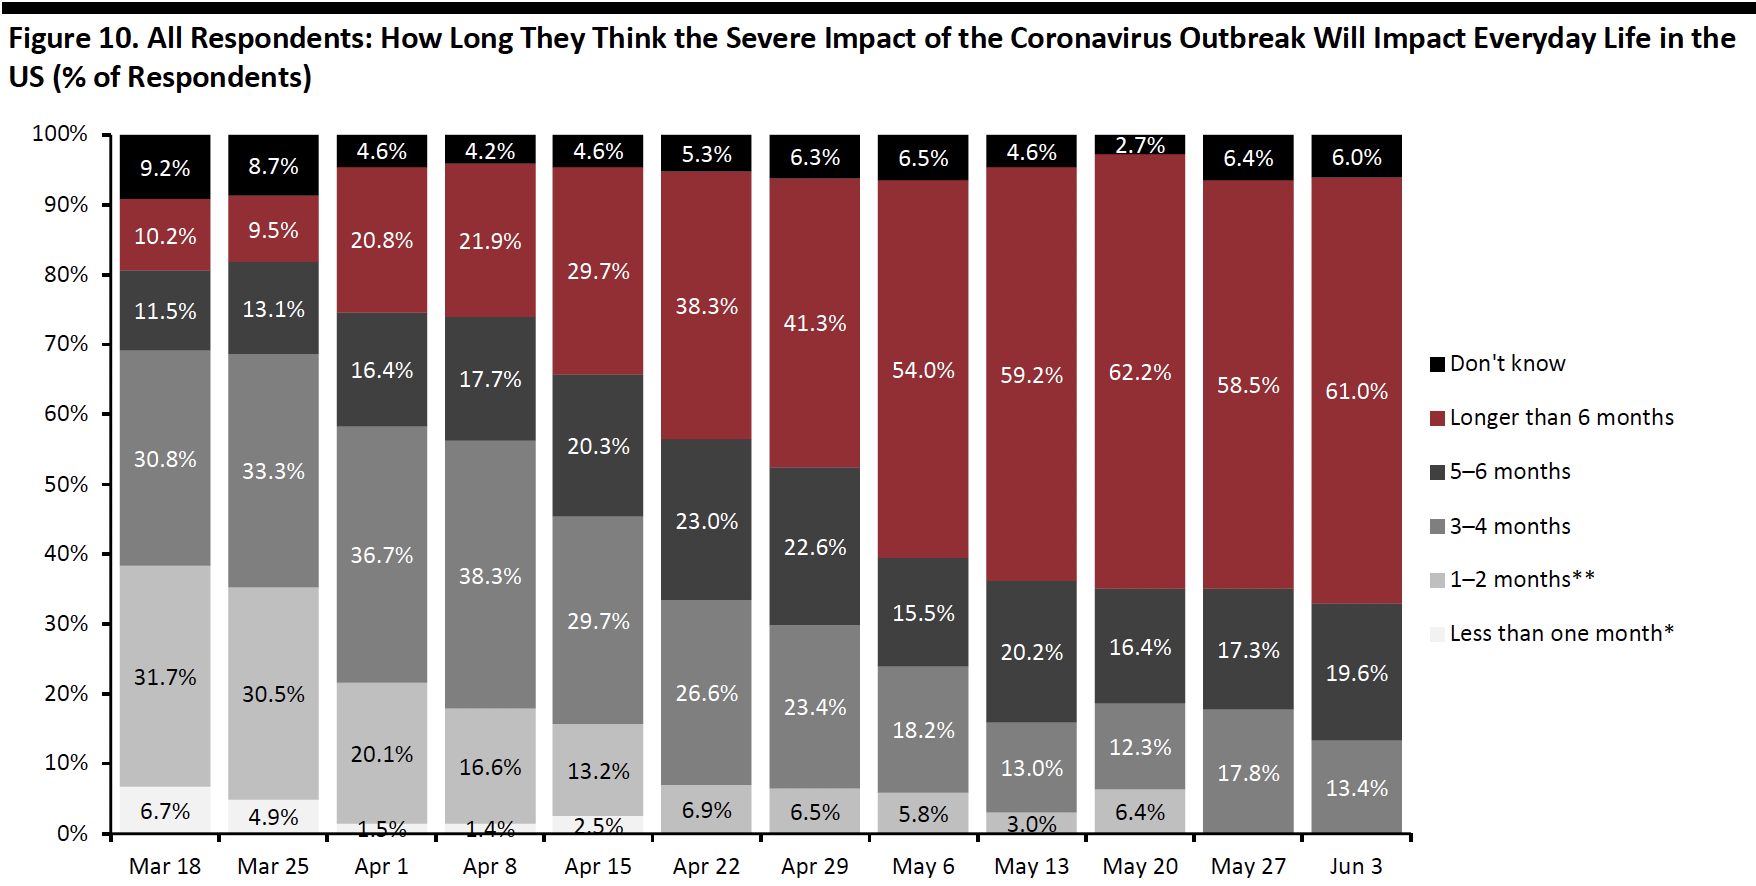 Base: US Internet users aged 18+
*Not provided as an option after April 15
**Not provided as an option after May 20
Source: Coresight Research[/caption]
Reviewing Trend Data in Purchasing Behavior
What They Are Buying More Of and Less Of
This week, the proportion of respondents both buying less and more continue to remain stable: 67.0% of respondents are buying more, versus 67.1% last week; and 61.6% are buying less, compared to 61.9% last week.
- Note, buying more of certain categories and buying less of certain categories were not mutually exclusive options, so respondents could answer yes to both.
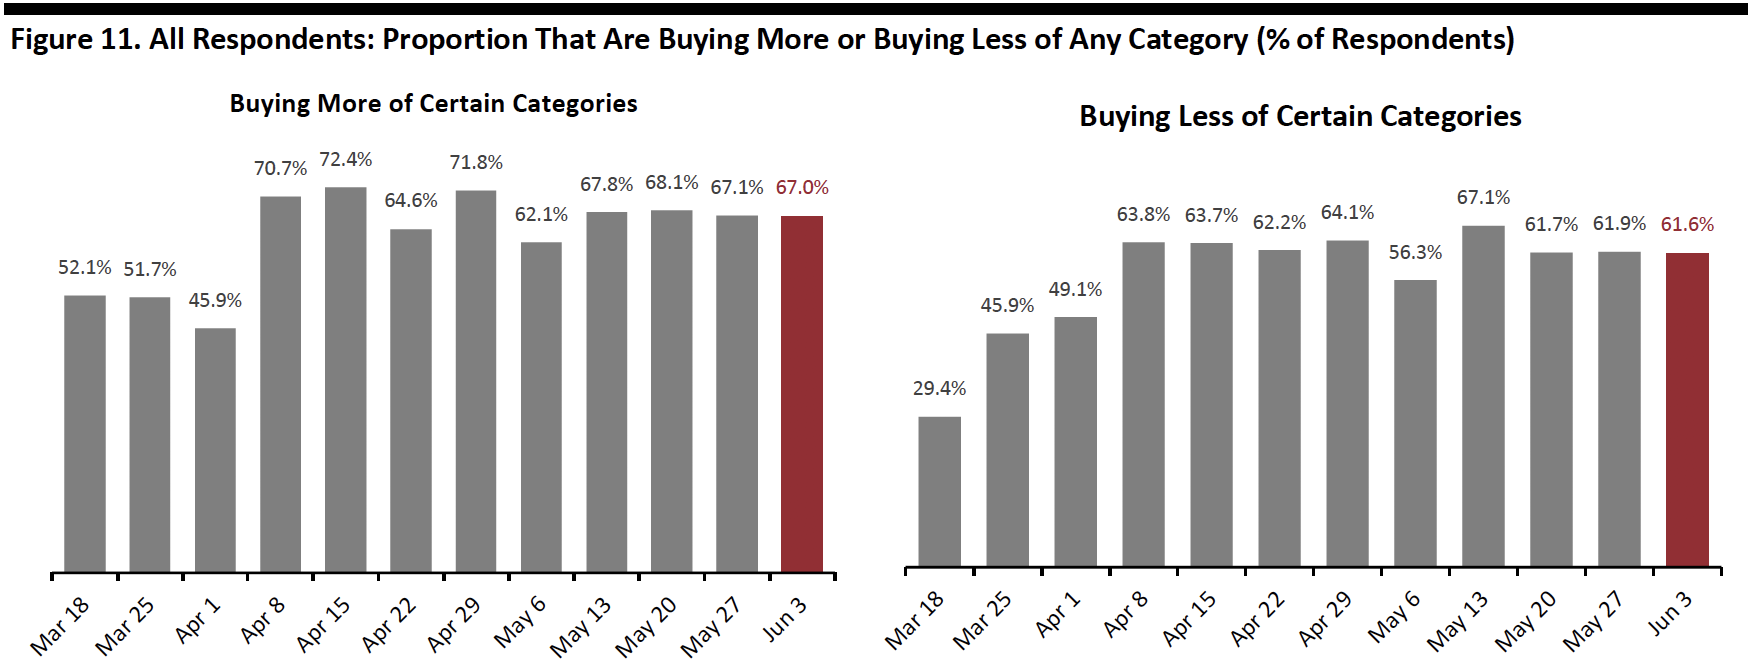 Base: US Internet users aged 18+
Source: Coresight Research[/caption]
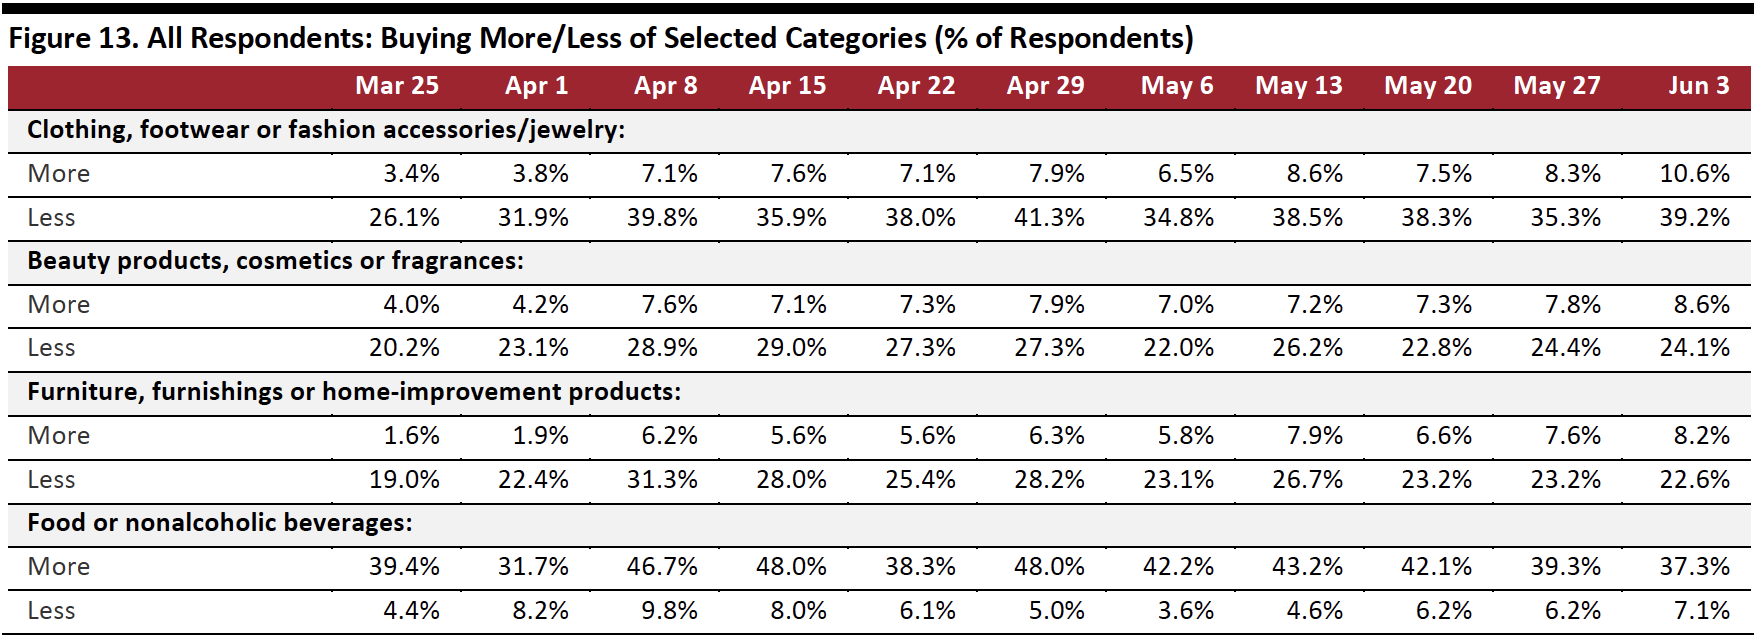
Buying more: Essentials including household products and food are still ranked as top categories that consumers are purchasing more of, but the proportions have declined for four consecutive weeks.
Buying less: Consumers continue to reduce their spending on discretionary categories. Apparel remains the number-one category for cutbacks, with 39.2% of respondents this week saying they are buying less in this category, up from 35.3% in the prior week (we show trended data in Figure 13).
The proportion of respondents cutting other discretionary categories—including furniture/home, beauty and electronics—were fairly stable week over week.
Ratio of less to more: A relatively encouraging sign was the declining ratio of those purchasing less to those purchasing more in all discretionary categories. The ratio for clothing and footwear stood at 3.7 this week versus 4.3 last week. The ratio for furniture, furnishings and home improvement was 2.8 this week versus 3.1 last week. Beauty products stood at 2.8 this week versus 3.1 last week.
[caption id="attachment_110940" align="aligncenter" width="700"]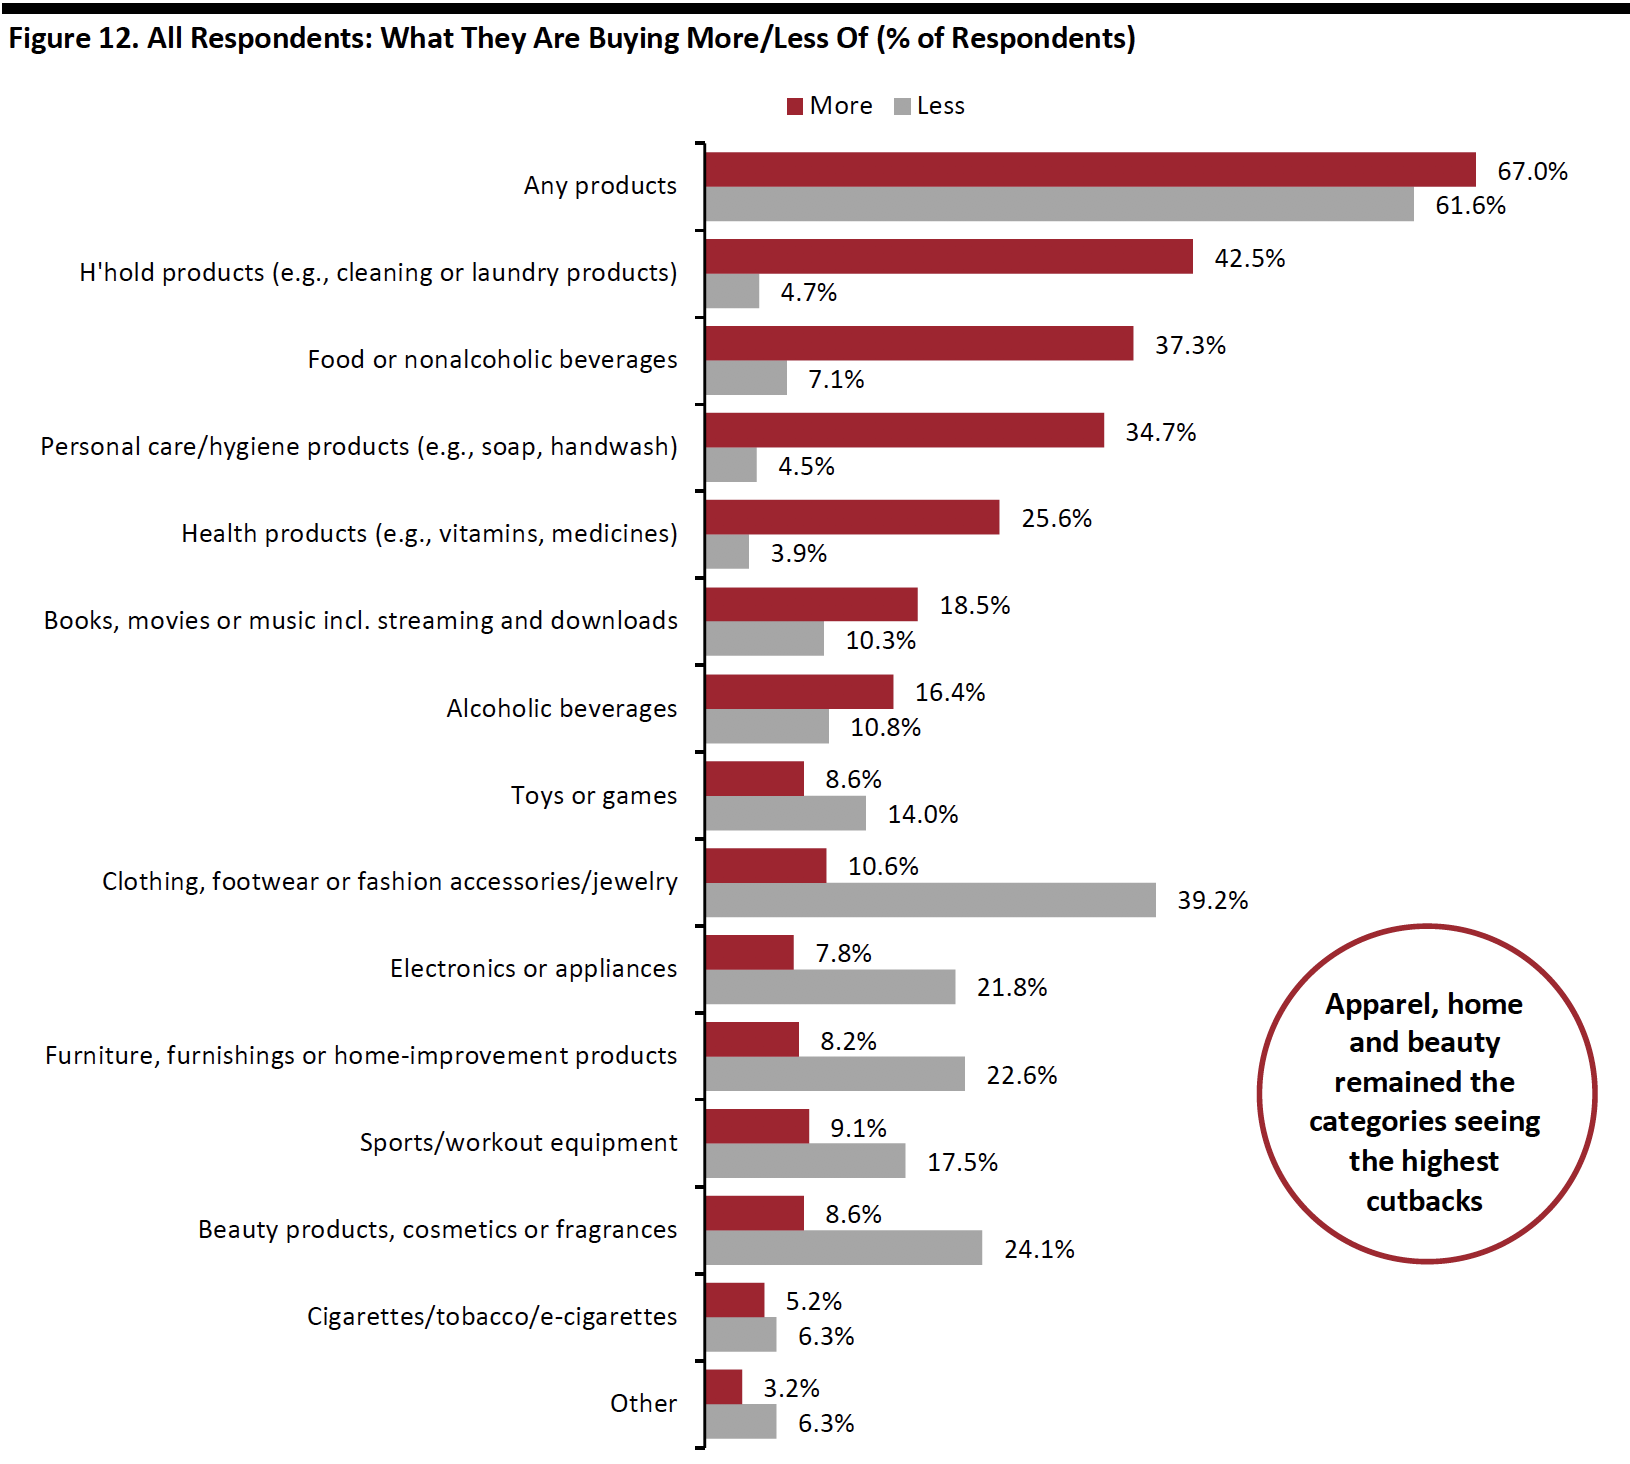 Respondents could select multiple options
Base: US Internet users aged 18+
Source: Coresight Research[/caption] [caption id="attachment_110941" align="aligncenter" width="700"]
 Base: US Internet users aged 18+
Source: Coresight Research[/caption]
Seven in 10 Are Switching Spending Online
The proportion of consumers switching spending to e-commerce has leveled off in the past couple of weeks at around 70%, even though lockdowns in most states have eased or lifted, with retail stores having begun to reopen from the beginning of May. We will continue to monitor the trend as more stores reopen in the upcoming weeks.
[caption id="attachment_110942" align="aligncenter" width="700"]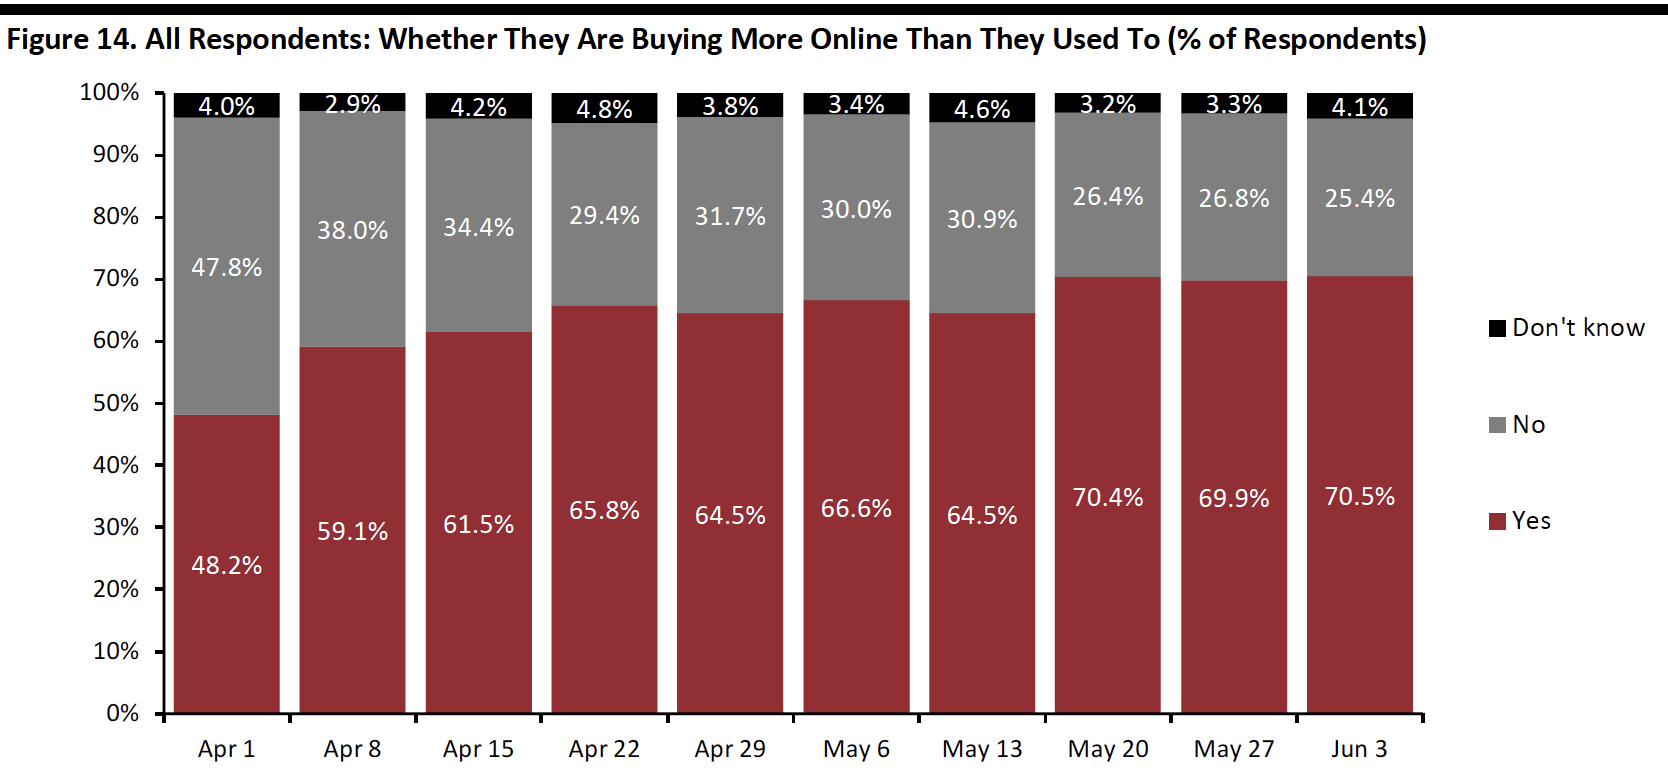 Base: US Internet users aged 18+
Source: Coresight Research[/caption]
What Consumers Are Buying More Of Online
Among the respondents making more purchases online, we saw a jump back of respondents buying household products and food after weeks of decline.
In discretionary categories, we saw stabilization in the proportion of consumers who are buying apparel, furniture/home and beauty online. The proportion of consumers who are buying electronics online fell back to 15.3% this week after an upswing last week.
The figures below are a proportion of those who are buying more online in general. Considered as a proportion of all respondents (representing consumers in general), buying more apparel online stood the same at 23.9% this week from last week, and buying more beauty online came at 14.2% versus 12.8% last week.
[caption id="attachment_110943" align="aligncenter" width="700"]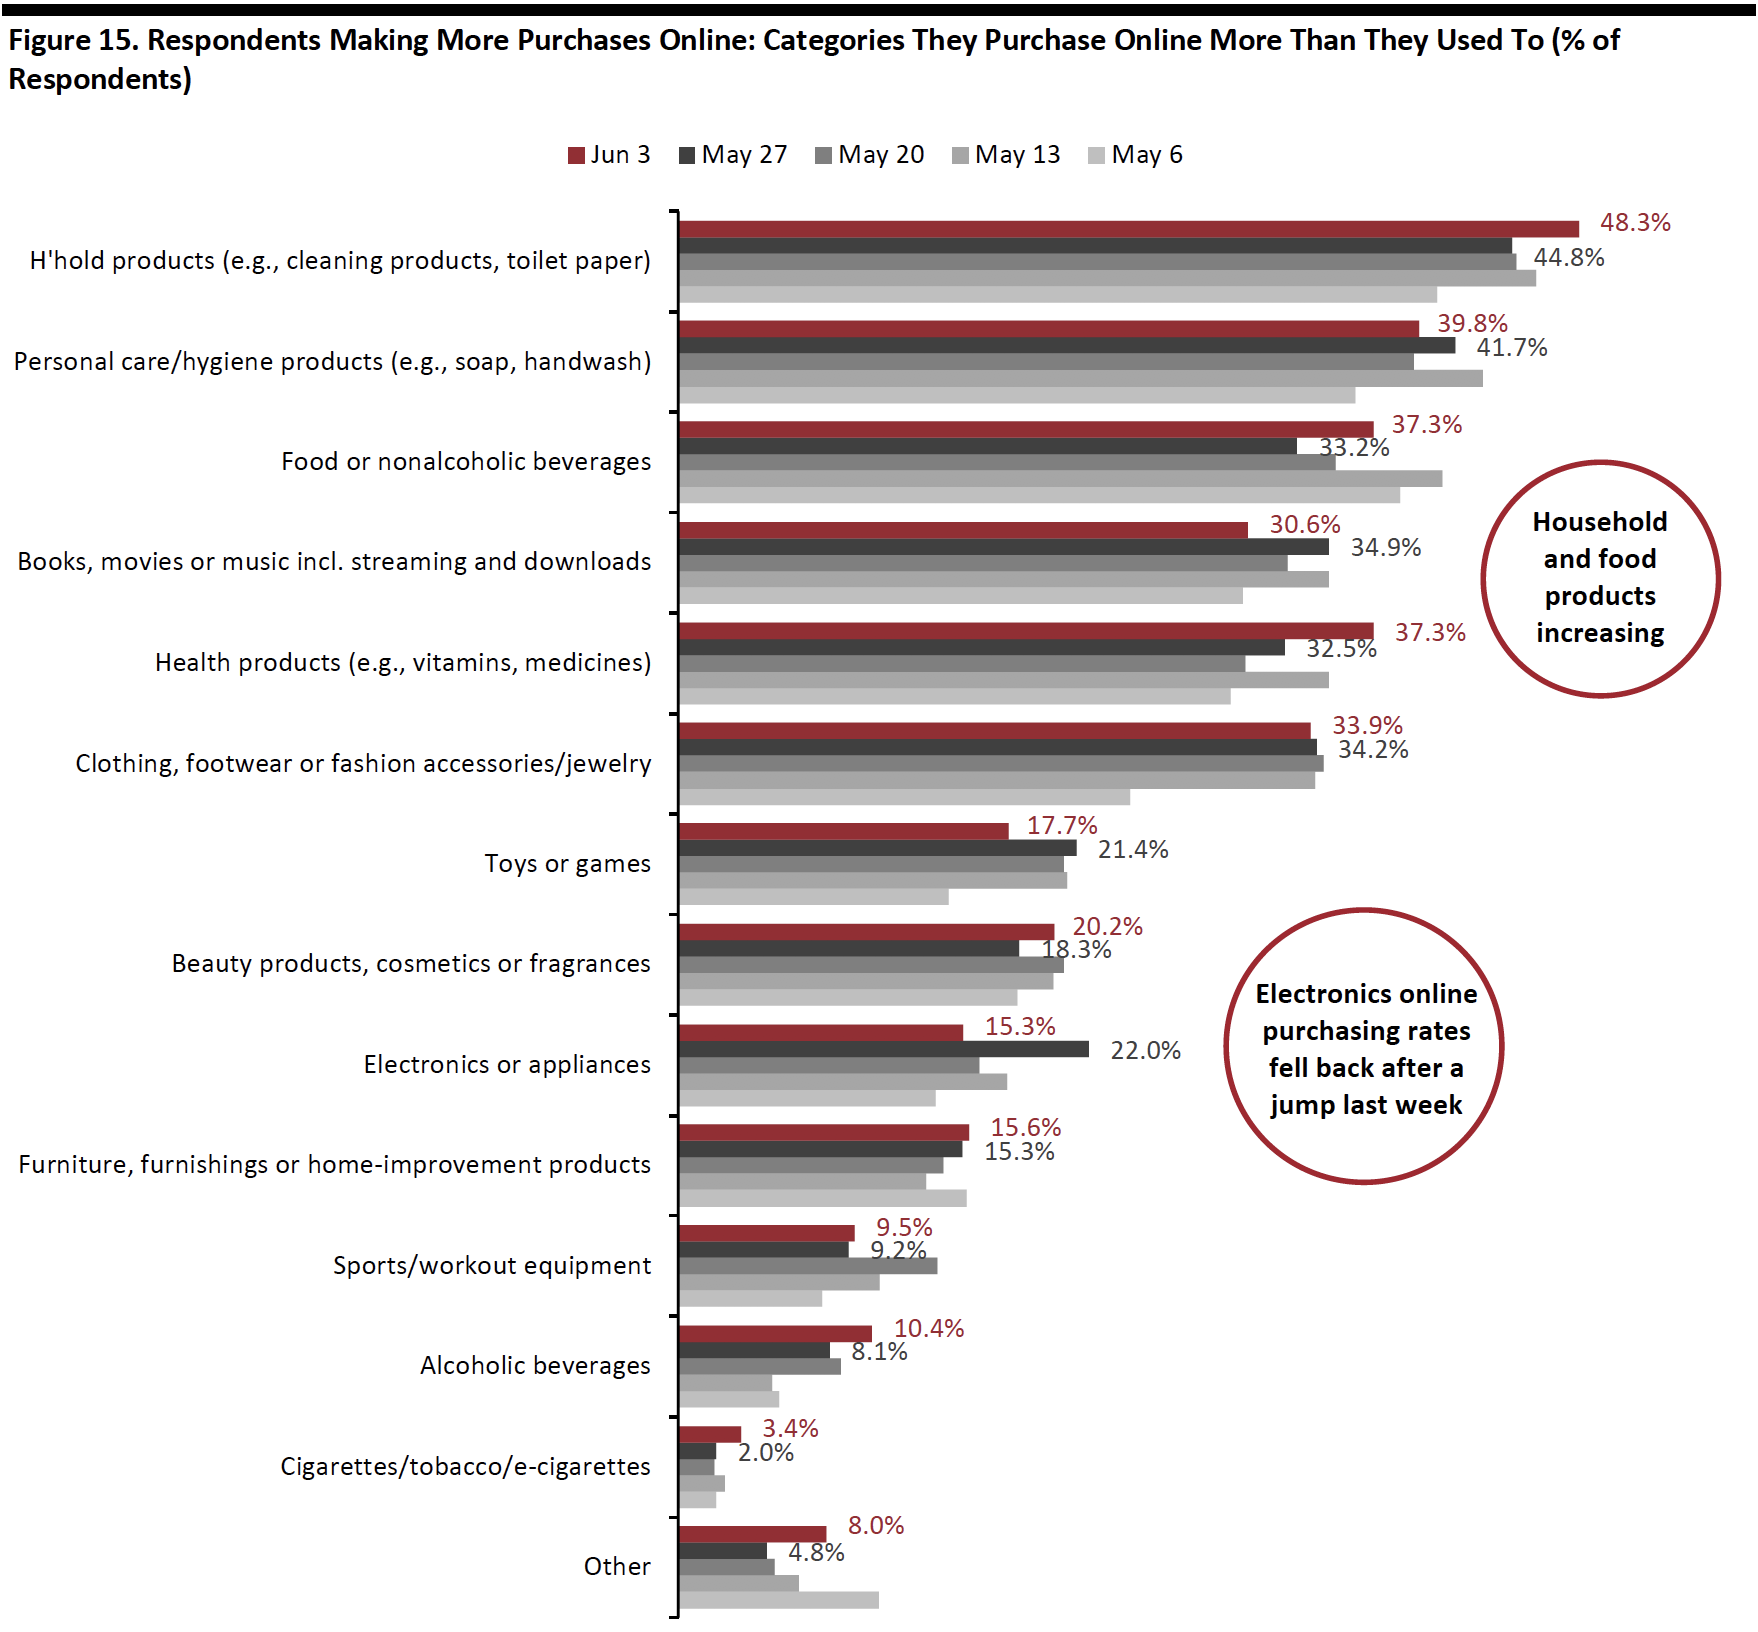 Respondents could select multiple options
Base: US Internet users aged 18+ who make more purchases online than they did before the coronavirus outbreak
Source: Coresight Research[/caption]
Methodology
We surveyed respondents online on June 3 (464 respondents), May 27 (422 respondents), May 20 (439 respondents), May 13 (431 respondents), May 6 (446 respondents), April 29 (479 respondents), April 22 (418 respondents), April 15 (410 respondents), April 8 (450 respondents), April 1 (477 respondents), March 25 (495 respondents) and March 17–18 (1,152 respondents). The most recent results have a margin of error of +/- 5%, with a 95% confidence interval. Not all charted week-over-week differences may be statistically significant.