
Nitheesh NH
Introduction
With stores and factories shutting down, people staying at home and the supply chain breaking, the US is suffering from the escalating coronavirus pandemic. This could propel the US economy into a recession, resulting in further job losses and a loss of income and wealth. The recent stock market sell-off, combined with The Federal Reserve System cutting interest rates and the government announcing a stimulus package, draw parallels to the GR of 2007–2009. Then, the economic downturn was precipitated by years of an overheated housing market, while what we are experiencing today is more of a “black swan” event, closer to a natural disaster. Many businesses were hit hard during the GR, especially those in construction, retail and travel and tourism. Retail is usually considered to be one of the least recession-proof industries. In this report, we discuss US retail performance during the GR, breaking down sales by sector. From our observations, the department store and home furnishing sectors suffered the most during the GR in terms of sales, with recoveries that lagged the overall economy, according to figures from the US Census Bureau. On the other hand, mass merchants were the least affected, since consumers turned to them for value offerings during a challenging time. It is difficult to predict how the economic damage of the coronavirus pandemic will compare to the financial crisis of 2007–2009, as consumer shopping behaviors have changed in the intervening 11 years: Technology and digital commerce plays a significantly larger role in our lives now than was previously the case. This is demonstrated by many companies still operating online despite mandated store closures during the coronavirus. Furthermore, the extent of the impact will depend on whether policymakers respond to multiple industries’ requests for assistance, as well as when and how soon the virus can be contained.Insights into US Shopping Behavior Amid the Coronavirus Outbreak
Our analysis of the GR of 2007–2009 (in the remainder of this report) suggests that there is resiliency in consumer demand for apparel and accessories. Mapping this trend to the coronavirus pandemic, it may be that some apparel retailers and brands will outpace the aggregate, as fashion is a highly emotional category where purchasing behaviors are heavily influenced by trends and marketing. With widespread home quarantines and heightened consumer uncertainty amidst the coronavirus, a nesting trend is emerging, whereby products that provide comfort and/or a psychological lift are seeing increased sales—for example, comfortable clothing and comfort food (chocolate pudding and macaroni and cheese). In the home sector, spending is discretionary, can frequently be postponed and is impacted by trends in employment, income and consumer confidence. Although the coronavirus crisis is negatively affecting these factors, we do not expect to see a sharp drop in sales due to the aforementioned nesting trend. For example, Target reported on March 25 that its home office and entertainment category as well as small kitchen appliances experienced sales lifts, and that loungewear and sleepwear are outperforming total apparel category sales, although the company has seen a deeper than 20% decline in comparable sales overall in its Apparel & Accessories category. These trends are consistent with the new normal of homestay. According to our recent survey of US consumers, shoppers are focused on purchasing staples such as food rather than apparel and home products. Target saw a spike in store traffic in late February and early March, and month-to-date comps were up more than 20%, with comparable sales in the Essentials and Food & Beverage categories up more than 50%. On the other side of this pandemic, consumers say they will resume outdoor activities and social behavior, and we are likely to see spending increase in restaurants and cafes as well as on small luxuries such as massages, manicures and hair care. Discretionary and luxury products will likely see a gradual recovery, but due to varied income levels and the wealth effect, aspirational luxury spending will likely suffer as these shoppers look to get their finances in order following possible unemployment and thus more carefully consider the balance of necessities versus feel-good purchases. With the coronavirus being a global pandemic, it is worth looking at the retail industry’s experience in China, which is already on track for a gradual business recovery. The country reached a milestone on March 19, 2020, with no new domestic cases reported for the first time since the coronavirus outbreak began in late January. Most businesses and retail stores have now reopened, and Chinese consumers are beginning to go out socially again. According to mapping app AutoNavi, traffic in major shopping districts in China picked up by an average of 30% over the weekend of March 14–15 compared to the same period in February, as consumers unleash pent-up demand. Even luxury brands enjoyed a resurgence of demand, demonstrated by shoppers lining up to enter the Chanel Shanghai flagship. As discussed above and shown in our survey findings, we expect that US consumers will similarly release pent-up demand once the coronavirus crisis is past its peak, whenever that may be. This would be welcome news for US retailers, although many may not stay in business long enough to reap the rewards of recovery, as we discuss in our US Store Closures 2020 Outlook.Slump in US Retail Sales During the Great Recession of 2007–2009
Retail is one of the least recession-proof industries, particularly in discretionary product sectors, such as clothing, furniture and luxury. During the US financial crisis of 2007–2009, the economy collapsed, with consumers reining in their spending in a challenging job market and retail stores nationwide slashing prices on almost everything to stimulate sales. Starting in October 2008, retail sales fell for 14 consecutive months. Retail sales ex gasoline and automobiles plunged 3.6% year over year in 2009. A deeper look at the GR reveals that retail sales ex gas and automobiles peaked on a trailing twelve-month (“TTM”) basis in September 2008, totaling $2.67 trillion, fully 10 months after the GR began. This level was not reached again until May 2011, 22 months after the declared end of the GR. Despite the severity of the recession, the trend of retail sales ex gas and automobiles continued to increase until October 2008—although by no means consistently, with minor decreases of 0.4% and 0.2% in March and August 2008, respectively. It then wasn’t until December 2009 that we saw the first year-over-year increase since October 2008, and positive, continuous growth did not fully take hold until February 2010 (shown in Figure 1). [caption id="attachment_106823" align="aligncenter" width="700"]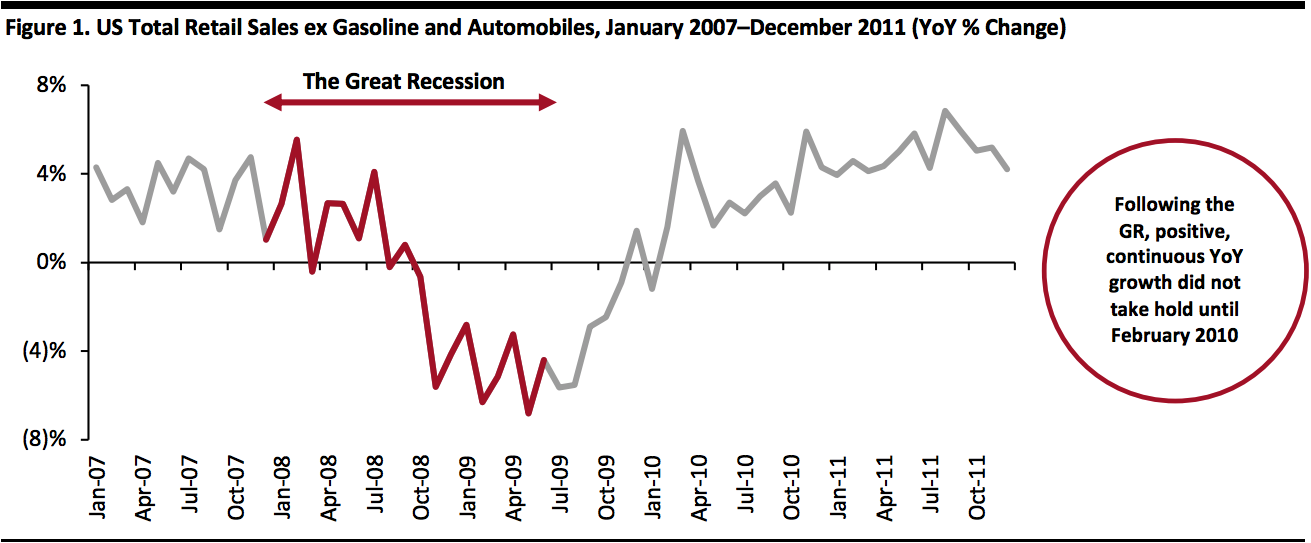 Source: US Census Bureau[/caption]
The nadir of retail sales ex gas and automobiles was November 2009 in terms of absolute sales ($2.55 trillion), down 4.7% from the September 2008 high.
[caption id="attachment_106824" align="aligncenter" width="700"]
Source: US Census Bureau[/caption]
The nadir of retail sales ex gas and automobiles was November 2009 in terms of absolute sales ($2.55 trillion), down 4.7% from the September 2008 high.
[caption id="attachment_106824" align="aligncenter" width="700"]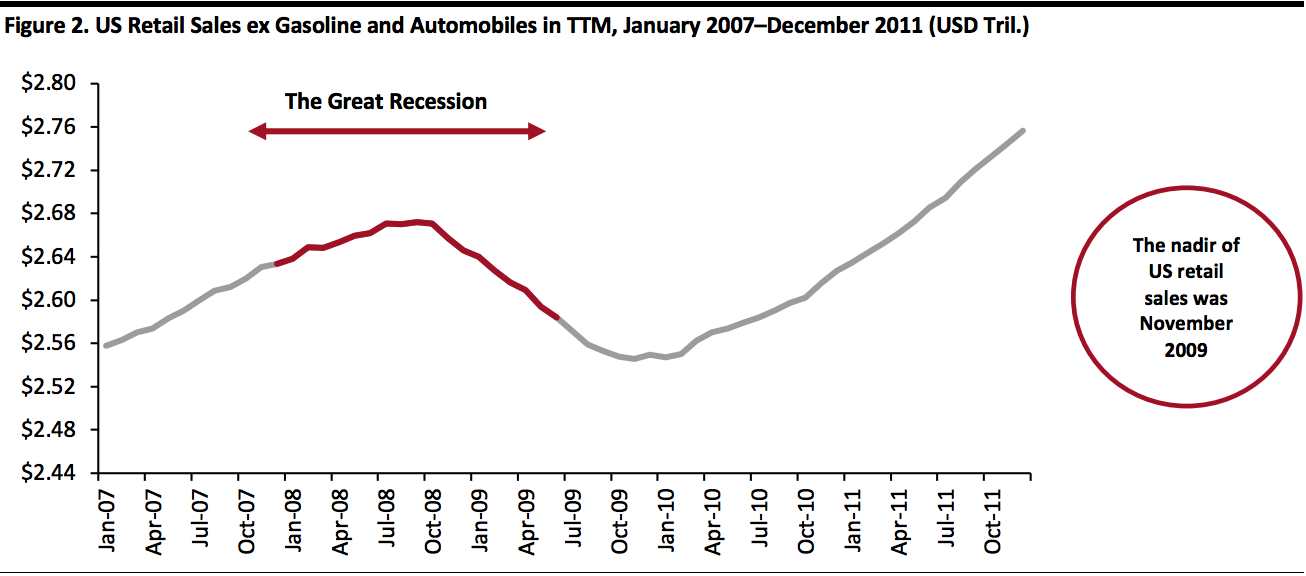 Source: US Census Bureau[/caption]
Consumer Confidence
Consumer sentiment—the degree of confidence that US consumers feel about their current financial status and the state of the economy—peaked in January 2007, according to the University of Michigan’s Index of Consumer Sentiment, which recorded a score of 96.9 in that month. This dropped to 75.5 for December 2007 when the GR began. Consumer confidence hit a low of 55.3 in November the following year, one month before the end of the recession. The depth of the GR’s impact on the US consumer is shown in Figure 4, as it was not until June 2010 that consumer confidence returned to similar levels of late 2007 and until January 2015 to reach (and actually surpass at 98.1) the previous January 2007 high confidence reading. [caption id="attachment_106825" align="aligncenter" width="700"]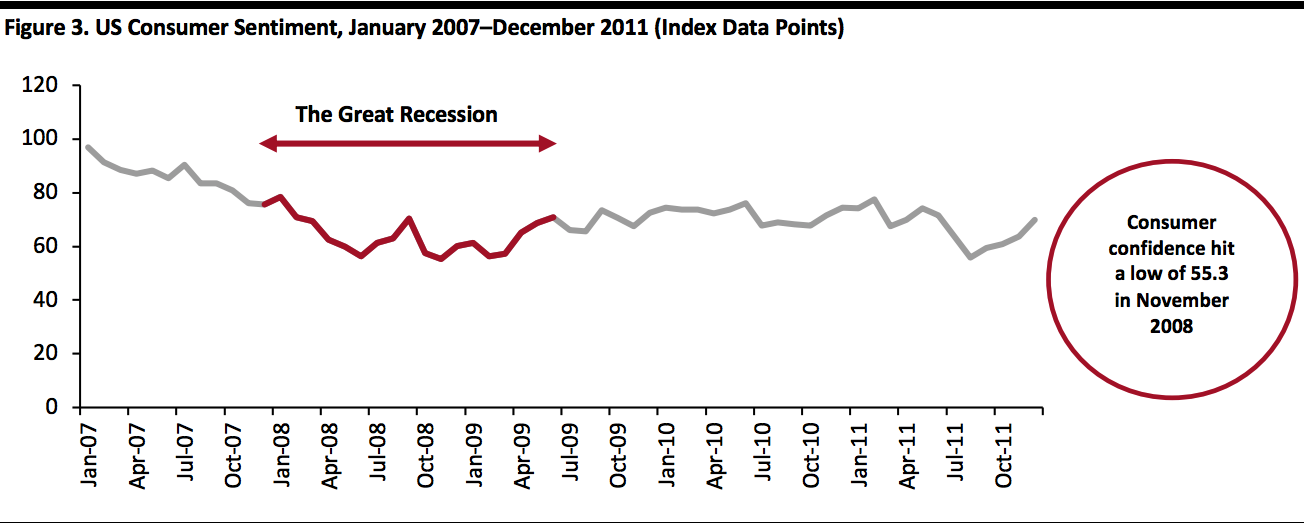 Source: University of Michigan[/caption]
Retail Sales by Sectors and Companies
The following tables show the annual sales and year-over-year changes for selected retail categories during the 2007—2011 period. Mass merchants outpaced retail overall, seeing growth every year. The sector hit a low of 1.4% in 2009, which was the weakest year across the board: The department stores and home furnishing and appliance sectors both posted double-digit sales declines of at least 11%. Mass merchants best weathered the GR, due to their inventory mix of staples and discretionary goods as well as the strong value they offered consumers in terms of price, product and service. [caption id="attachment_106827" align="aligncenter" width="700"]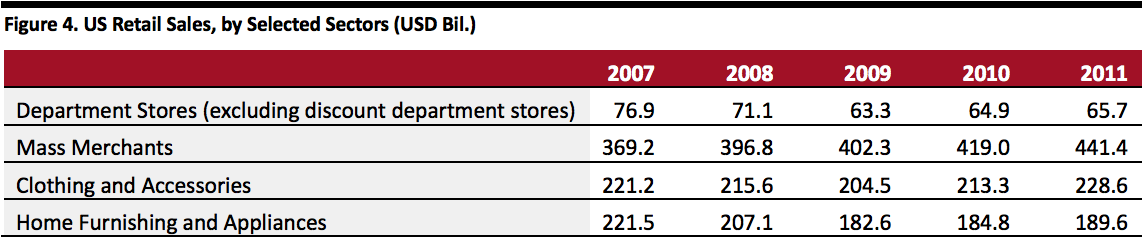 Source: US Census Bureau[/caption]
[caption id="attachment_106828" align="aligncenter" width="700"]
Source: US Census Bureau[/caption]
[caption id="attachment_106828" align="aligncenter" width="700"]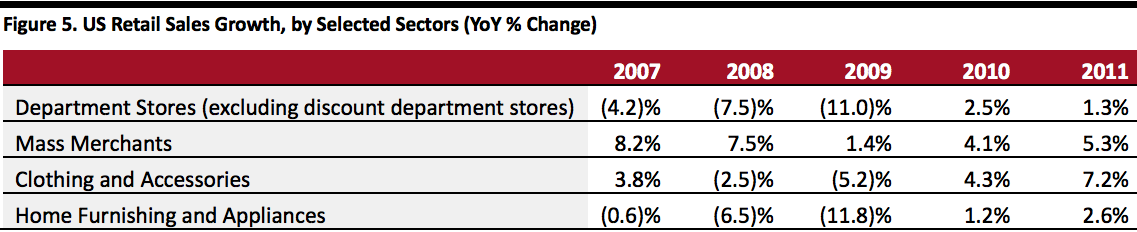 Source: US Census Bureau[/caption]
Department Stores (excluding discount department stores)
The department-store channel was the worst-performing retail sector heading into the GR and through it, as well as being late to recover from the recession. In 2007, sales at US department stores totaled $76.9 billion, down from $80.3 billion in 2006. By 2009, sales were down to $63.3 billion. In terms of sales growth, the year-over-year decline accelerated from 4.2% in 2007 to 11% by December 2009, despite overall recovery from the GR beginning in July 2009.
The GR wiped out approximately $10 billion in sales at US department stores, and the channel has not returned to pre-GR sales to this day. In fact, sales in 2019 at US department stores totaled $42.6 billion, nearly half of the pre-GR levels.
Department stores entered the recession weakened by the highly competitive marketplace, a lack of differentiated products and services and weak balance sheets. The environment is not dissimilar today, and with the coronavirus pandemic resulting in prolonged store closures, US consumers are turning to online channels to shop. This is likely to further erode market share for department stores during the coronavirus period and afterwards, so it is likely that we will see continued department store closures in the medium term.
[caption id="attachment_106829" align="aligncenter" width="700"]
Source: US Census Bureau[/caption]
Department Stores (excluding discount department stores)
The department-store channel was the worst-performing retail sector heading into the GR and through it, as well as being late to recover from the recession. In 2007, sales at US department stores totaled $76.9 billion, down from $80.3 billion in 2006. By 2009, sales were down to $63.3 billion. In terms of sales growth, the year-over-year decline accelerated from 4.2% in 2007 to 11% by December 2009, despite overall recovery from the GR beginning in July 2009.
The GR wiped out approximately $10 billion in sales at US department stores, and the channel has not returned to pre-GR sales to this day. In fact, sales in 2019 at US department stores totaled $42.6 billion, nearly half of the pre-GR levels.
Department stores entered the recession weakened by the highly competitive marketplace, a lack of differentiated products and services and weak balance sheets. The environment is not dissimilar today, and with the coronavirus pandemic resulting in prolonged store closures, US consumers are turning to online channels to shop. This is likely to further erode market share for department stores during the coronavirus period and afterwards, so it is likely that we will see continued department store closures in the medium term.
[caption id="attachment_106829" align="aligncenter" width="700"]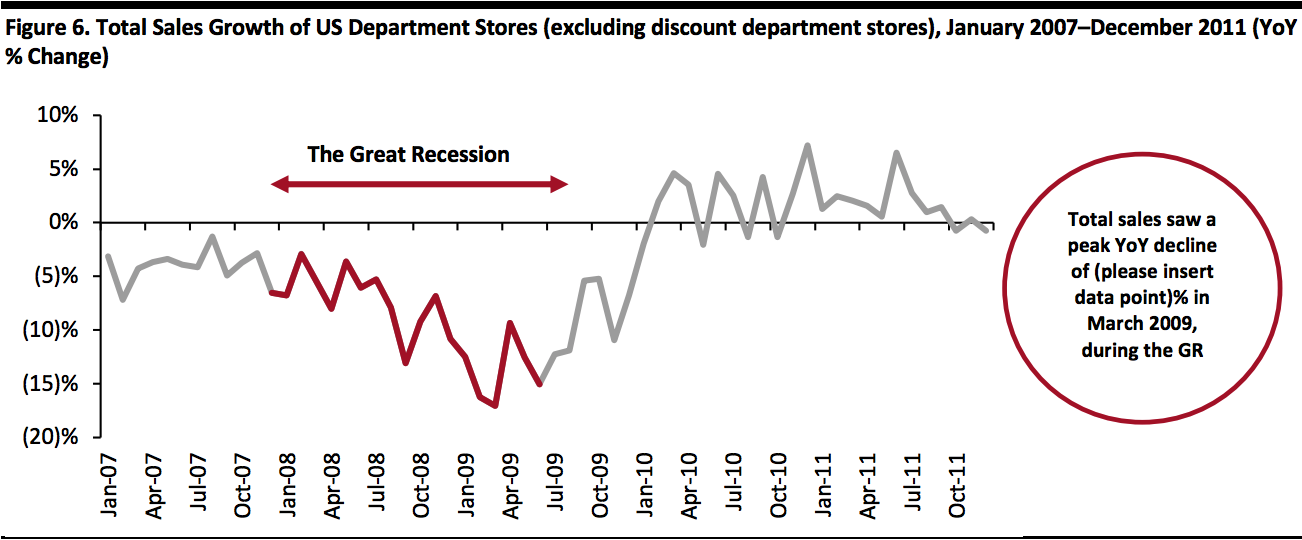 Source: US Census Bureau[/caption]
We examined the performance of five department store chains during the 2007—2011 period: JCPenney, Kohl’s, Macy’s, Nordstrom and Sears. Kohl’s was largely successful compared to some of the other companies; it reported only two quarters of sales declines during the GR—the second half of 2008. This performance suggests that the strong price/value offering of Kohl’s, along with its off-mall locations, appeals to consumers and provides ease of shopping, enabling the retailer to better weather the recession compared to mall-based department stores. With isolation and social distancing being key concepts during the coronavirus pandemic, it may be that off-mall locations again prove useful in Kohl’s surviving the crisis. Furthermore, like the GR, the coronavirus outbreak is having an adverse impact on employment, so retailers that can compete on price may fair better than others.
That said, Nordstrom exited the GR with nine consecutive double-digit sales gains, from the fourth quarter 2009. The retailer has a portfolio of private-label brands, making it another destination with a value proposition—retailers that offer differentiated products and services may see more success during the coronavirus period than those that purely offer low prices.
Gross margins at the selected department stores were relatively stable during the GR. On an annual basis from 2008—2010, the average gross margin improved 150 basis points to 36.4% of sales, driven by margin expansion at JCPenney, Kohl’s and Nordstrom. On an EBIT basis, margins contracted at Sears and JCPenney, 30 basis points and 150 basis points respectively, while the remaining department stores experienced EBIT margin expansion: Nordstrom saw an incremental 280 basis points for an 11.3% EBIT margin in 2010; Macy’s added 210 basis points to 7.7% of sales; and Kohl’s saw an increase of 130 basis points to 11.4%.
[caption id="attachment_106830" align="aligncenter" width="700"]
Source: US Census Bureau[/caption]
We examined the performance of five department store chains during the 2007—2011 period: JCPenney, Kohl’s, Macy’s, Nordstrom and Sears. Kohl’s was largely successful compared to some of the other companies; it reported only two quarters of sales declines during the GR—the second half of 2008. This performance suggests that the strong price/value offering of Kohl’s, along with its off-mall locations, appeals to consumers and provides ease of shopping, enabling the retailer to better weather the recession compared to mall-based department stores. With isolation and social distancing being key concepts during the coronavirus pandemic, it may be that off-mall locations again prove useful in Kohl’s surviving the crisis. Furthermore, like the GR, the coronavirus outbreak is having an adverse impact on employment, so retailers that can compete on price may fair better than others.
That said, Nordstrom exited the GR with nine consecutive double-digit sales gains, from the fourth quarter 2009. The retailer has a portfolio of private-label brands, making it another destination with a value proposition—retailers that offer differentiated products and services may see more success during the coronavirus period than those that purely offer low prices.
Gross margins at the selected department stores were relatively stable during the GR. On an annual basis from 2008—2010, the average gross margin improved 150 basis points to 36.4% of sales, driven by margin expansion at JCPenney, Kohl’s and Nordstrom. On an EBIT basis, margins contracted at Sears and JCPenney, 30 basis points and 150 basis points respectively, while the remaining department stores experienced EBIT margin expansion: Nordstrom saw an incremental 280 basis points for an 11.3% EBIT margin in 2010; Macy’s added 210 basis points to 7.7% of sales; and Kohl’s saw an increase of 130 basis points to 11.4%.
[caption id="attachment_106830" align="aligncenter" width="700"]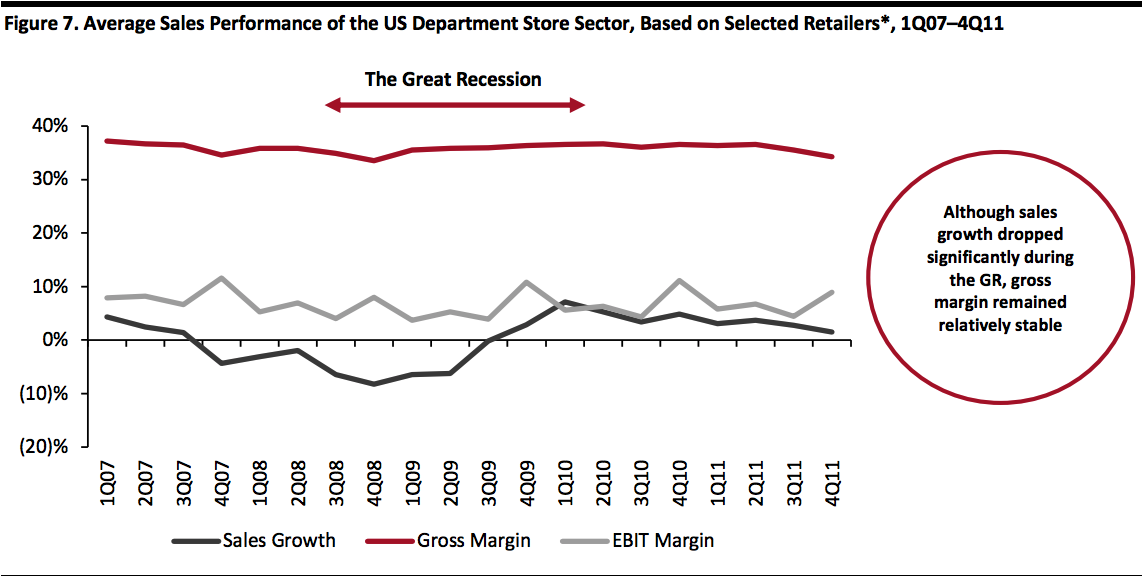 *Selected retailers are JCPenney, Kohl’s, Macy’s, Nordstrom and Sears
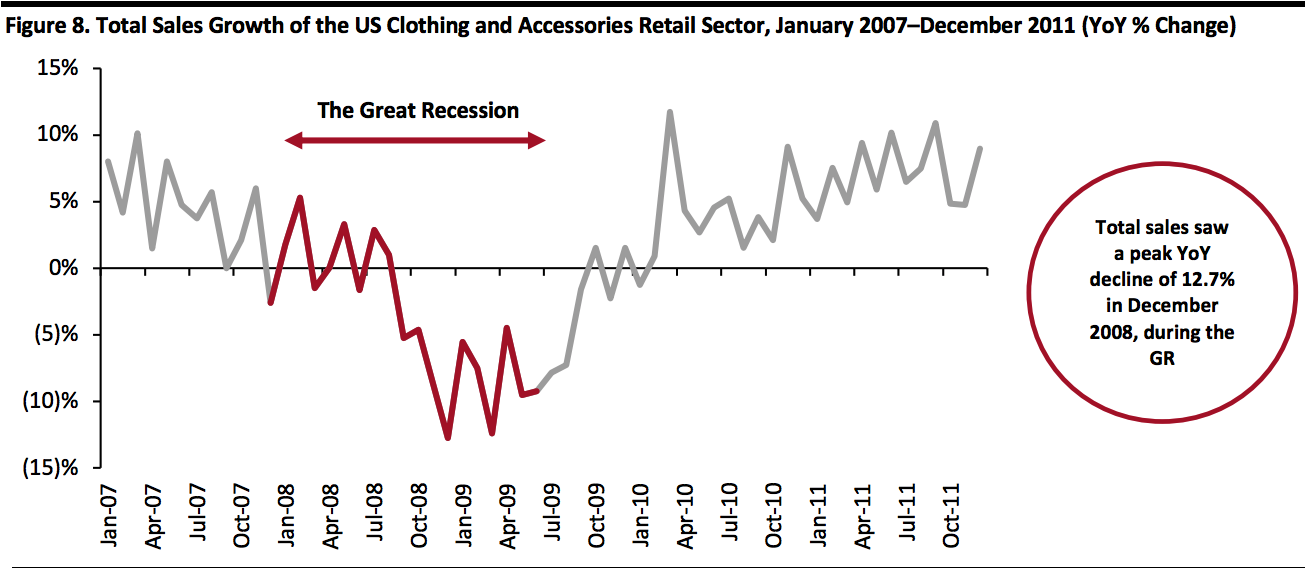
Source: S&P Capital IQ[/caption] Clothing and Accessories In tandem with the beginning of the GR in December 2007, sales at US clothing and accessories stores declined by 2.7% on a year-over-year basis. As shown in Figure 8, monthly sales trends were then erratic until September 2008. For context, this is when the subprime mortgage crisis hit a critical juncture, as Fannie Mae and Freddie Mac (backers of $5 trillion in home loans) were placed into government conservatorship, Lehman Brothers went bankrupt, Bank of America bought investment management company Merrill Lynch, and the Federal Reserve System bought insurance company AIG (the insurer of trillions of dollars’ worth of mortgages). The deepest drop in year-over-year sales growth at US clothing and accessories stores occurred in December 2008 (down 12.7%), closely followed by the 12.4% drop in March 2009. In total, the sector experienced 13 consecutive months of sales declines—September 2008 through October 2009—and recovery only began in earnest in February 2010, lagging the end of the GR by eight months. It was not until July 2011 that sales at US clothing and accessories stores equaled their pre-GR total of $221 billion, more than two years after the recession ended. [caption id="attachment_106831" align="aligncenter" width="700"]
 Source: US Census Bureau[/caption]
We looked at the performance of six specialty apparel retailers during the 2007–2011 period: Abercrombie & Fitch, American Eagle Outfitters, Chico’s FAS, Gap Inc, L Brands and Urban Outfitters. We observed that the aggregate year-over-year sales exhibited the first decline in the fourth quarter of 2008.
Urban Outfitters (with its Anthropologie, Free People and Urban Outfitters stores) outpaced the average with 11 quarters of the highest sales growth, ranging between 13.6% and 30.4% gains. During the period 2007–2011, the company saw only one quarter of decline in year-over-year sales (1Q09), when sales were down 2.4%.
Unlike the GR, nationwide efforts to combat the coronavirus pandemic have required specialty apparel retailers to temporarily close their brick-and-mortar stores. Although many of them have an online presence, we expect that there will be a significant drop in apparel and accessories sales while physical stores are closed. The duration of forced store closures remains unclear—an economic impact that will inhibit sales growth will be evident in the near term and has the potential to cause long-term challenges for retailers. When stores reopen, the release of some pent-up demand is likely as many fashion shoppers value the physical and social experiences of shopping. As is the case outside of times of crisis, some apparel brands will do better than others based on their interpretation of fashion trends.
During the 2007—2011 period, average year-over-year quarterly growth totaled 5.7%, with the aggregate results skewed due to the strong performance of Urban Outfitters. American Eagle was the first specialty apparel retailer of this group to exit the recession, and the company saw a string of three consecutive quarters of double-digit sales gains from the second quarter 2009, moving in tandem with overall GR recovery. Chico’s FAS fell slightly behind, but followed suit with sales growth from the third quarter 2009.
Looking at profitability in terms of annual gross and EBIT margins, the mean gross margin expanded 60 basis points to 47.4% in the two years ended 2010, and the EBIT margin by 220 basis points to 12.4%.
[caption id="attachment_106832" align="aligncenter" width="700"]
Source: US Census Bureau[/caption]
We looked at the performance of six specialty apparel retailers during the 2007–2011 period: Abercrombie & Fitch, American Eagle Outfitters, Chico’s FAS, Gap Inc, L Brands and Urban Outfitters. We observed that the aggregate year-over-year sales exhibited the first decline in the fourth quarter of 2008.
Urban Outfitters (with its Anthropologie, Free People and Urban Outfitters stores) outpaced the average with 11 quarters of the highest sales growth, ranging between 13.6% and 30.4% gains. During the period 2007–2011, the company saw only one quarter of decline in year-over-year sales (1Q09), when sales were down 2.4%.
Unlike the GR, nationwide efforts to combat the coronavirus pandemic have required specialty apparel retailers to temporarily close their brick-and-mortar stores. Although many of them have an online presence, we expect that there will be a significant drop in apparel and accessories sales while physical stores are closed. The duration of forced store closures remains unclear—an economic impact that will inhibit sales growth will be evident in the near term and has the potential to cause long-term challenges for retailers. When stores reopen, the release of some pent-up demand is likely as many fashion shoppers value the physical and social experiences of shopping. As is the case outside of times of crisis, some apparel brands will do better than others based on their interpretation of fashion trends.
During the 2007—2011 period, average year-over-year quarterly growth totaled 5.7%, with the aggregate results skewed due to the strong performance of Urban Outfitters. American Eagle was the first specialty apparel retailer of this group to exit the recession, and the company saw a string of three consecutive quarters of double-digit sales gains from the second quarter 2009, moving in tandem with overall GR recovery. Chico’s FAS fell slightly behind, but followed suit with sales growth from the third quarter 2009.
Looking at profitability in terms of annual gross and EBIT margins, the mean gross margin expanded 60 basis points to 47.4% in the two years ended 2010, and the EBIT margin by 220 basis points to 12.4%.
[caption id="attachment_106832" align="aligncenter" width="700"]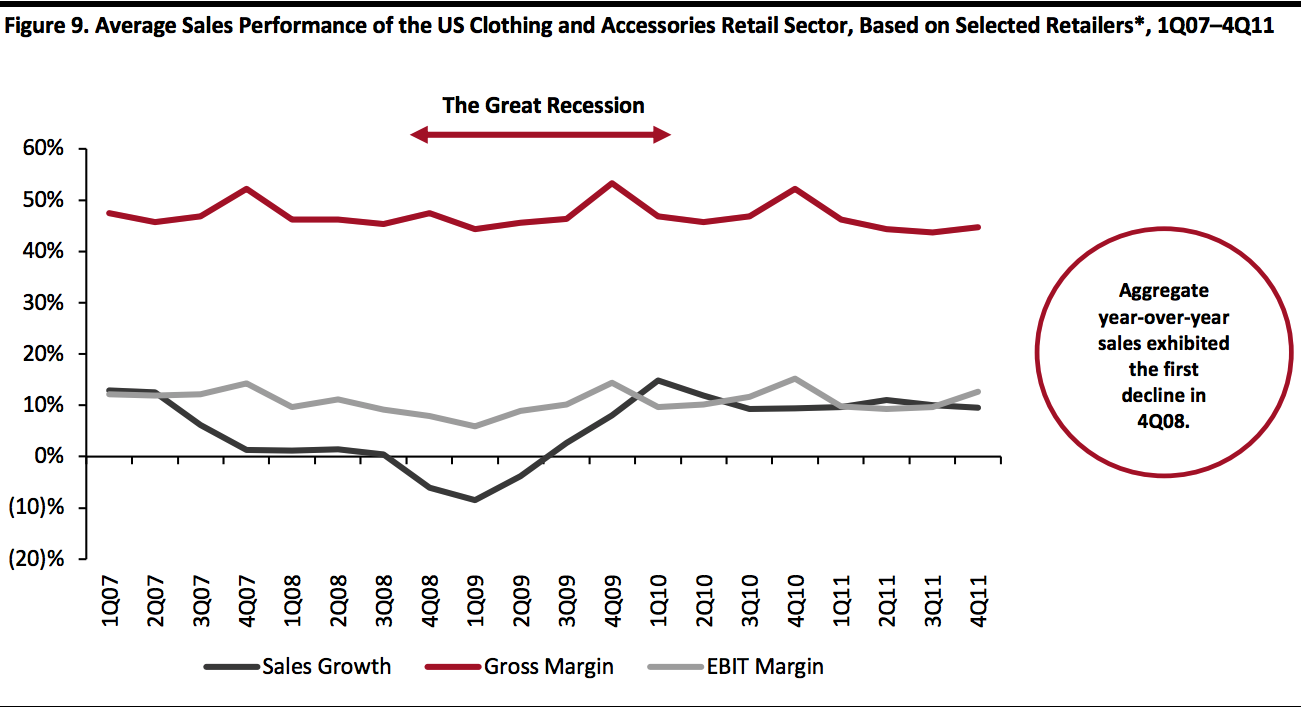 *Selected retailers are Abercrombie & Fitch, American Eagle Outfitters, Chico’s FAS, Gap Inc, L Brands and Urban Outfitters
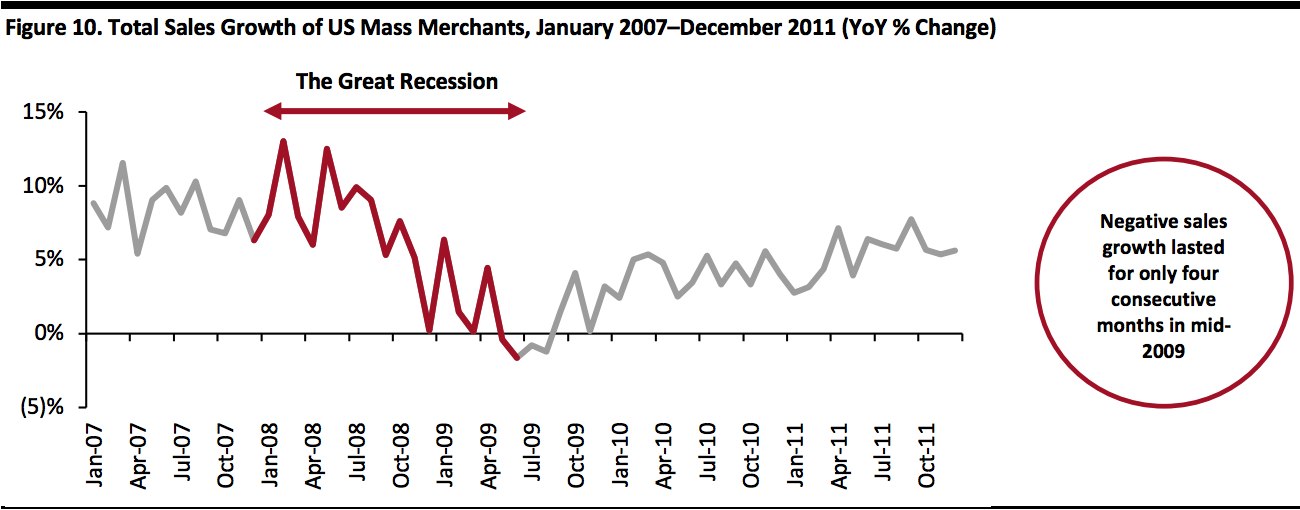
Source: S&P Capital IQ[/caption] Mass Merchandising While many retailers—particularly in the department store and clothing and accessories sectors—struggled with losing sales and closing stores during the GR, some mass merchants fared better. During a time when consumers were penny-pinching, big-box retailers were able to lure them with value product offerings and benefited from the closures of small and medium businesses. In the beginning of the GR period, monthly sales of mass merchants continued to increase, jumping 13% year over year in February 2008. However, after 17 consecutive months of sales upticks from December 2007, sales started falling in May 2009, when the GR was nearing its end. The decline lasted for only four consecutive months, with the lowest decline of 1.6% occurring in June 2009. Sales then quickly bounced back in September 2009 and steadily grew at a single-digit rate in 2010 and 2011. This data shows that mass merchants comprised the most resilient retail sector during the GR. Benefiting from their mix of staple and discretionary products, these retailers are likely to fare well during the coronavirus pandemic too, particularly as most stores in this sector have not been subject to temporary closure and so are still serving US consumers in a brick-and-mortar format. [caption id="attachment_106833" align="aligncenter" width="700"]
 Source: US Census Bureau[/caption]
We looked at performance of three US mass merchants during the 2007–2011 period: Costco, Target and Walmart. The average YoY quarterly growth across this group was 5.8% from 2007—2011. Aggregate sales growth only turned negative in the first three quarters of 2009. In the fourth quarter of that year, which was the holiday season—considered to be very important for retailers—all three retailers posted sales growth in the range of 3–6%.
Costco outpaced the average with six quarters of the highest sales growth, ranging from 3.7% to 15.4% in the 2007—2009 period. The retailer also recovered quickly from the GR, returning to double-digit annual sales growth in 2010 and 2011.
In terms of profitability, we observed lower gross margins in the fourth quarter of each year, due to margin contraction by Target. The mean gross margin expanded 100 basis points to 22.9% in the two years ended 2010, and the EBIT margin increased 50 basis points to 12.4%.
[caption id="attachment_106834" align="aligncenter" width="700"]
Source: US Census Bureau[/caption]
We looked at performance of three US mass merchants during the 2007–2011 period: Costco, Target and Walmart. The average YoY quarterly growth across this group was 5.8% from 2007—2011. Aggregate sales growth only turned negative in the first three quarters of 2009. In the fourth quarter of that year, which was the holiday season—considered to be very important for retailers—all three retailers posted sales growth in the range of 3–6%.
Costco outpaced the average with six quarters of the highest sales growth, ranging from 3.7% to 15.4% in the 2007—2009 period. The retailer also recovered quickly from the GR, returning to double-digit annual sales growth in 2010 and 2011.
In terms of profitability, we observed lower gross margins in the fourth quarter of each year, due to margin contraction by Target. The mean gross margin expanded 100 basis points to 22.9% in the two years ended 2010, and the EBIT margin increased 50 basis points to 12.4%.
[caption id="attachment_106834" align="aligncenter" width="700"]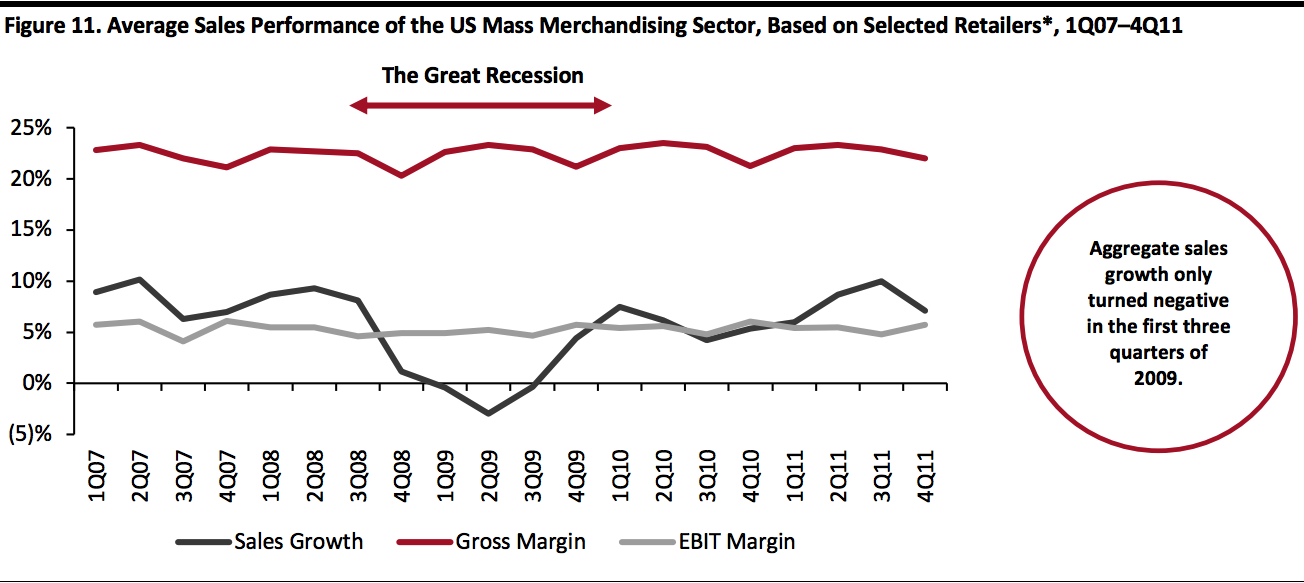 *Selected mass merchants are Costco, Target and Walmart
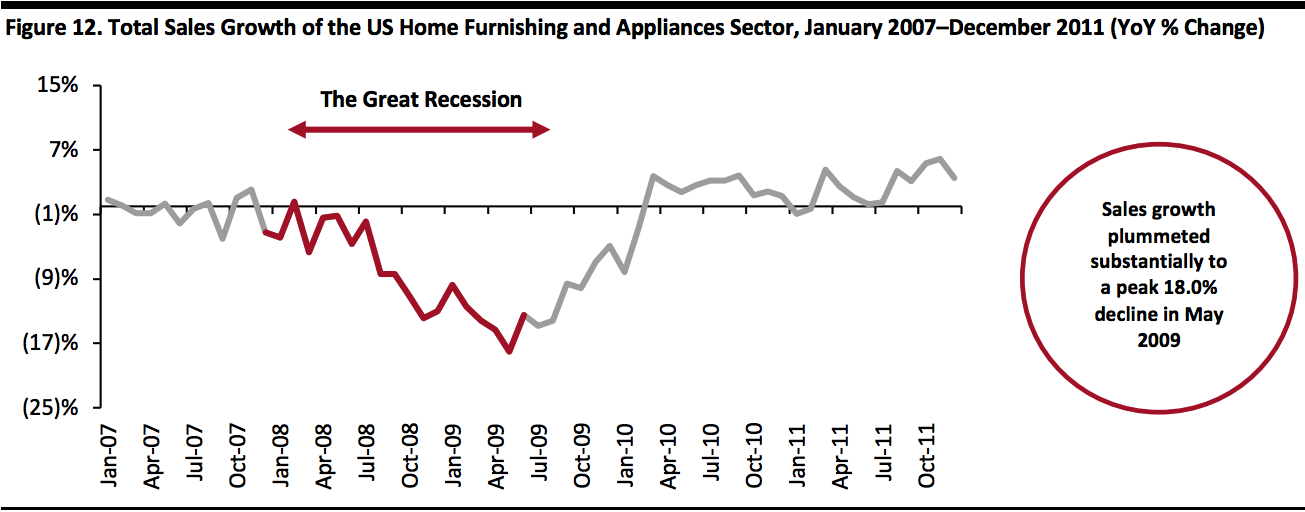
Source: S&P Capital IQ[/caption] Home Furnishing and Appliances The home furnishing and appliances sector was one of the worst hit by the GR in the retail industry. The economic meltdown in 2007—2009 started with the collapse of US housing market, so related sectors were the first to feel adverse effects. In addition to the negative impact caused by a reduced number of new home builds, home furnishing and appliances were big-ticket items that dropped in priority for consumers as they limited spending during the GR, resulting in a significant sales decline in the sector. Home-furnishing products are still considered to be discretionary and often expensive, but we believe that the sector will not follow the same pattern of decline as during the GR. This is because although the coronavirus will likely slow US consumer spending on such products, the impact is set to be modestly offset by nesting behavior due to widespread stay-at-home orders, whereby consumers selectively make “comfort” purchases of home goods. At the start of 2007, the home furnishing and appliances sector was already experiencing flat sales growth or sales declines. Sales quickly dropped that year, leading into a 24-month period of consecutive year-over-year sales declines from March 2008. Sales growth plummeted substantially to a peak 18.0% decline in May 2009. It was not until March 2010 that sales began to increase year over year. Similar to the department-store sector, the home furnishing and appliances sector has not fully returned to its pre-GR figures of absolute sales. Sales in the sector totaled $214.7 billion in 2019, which is lower than the $221.5 billion in 2007. [caption id="attachment_106835" align="aligncenter" width="700"]
 Source: US Census Bureau[/caption]
We looked at performance of five home furnishing and appliances retailers during the 2007–2011 period: Bed Bath & Beyond, Best Buy, Home Depot, Lowe’s and Williams-Sonoma. Aggregate year-over-year sales plunged 6.5% in the fourth quarter of 2008, which was the deepest drop for the sector during the GR.
Best Buy outperformed the other selected retailers with the highest sales growth in 11 quarters during the 2007–2009 period, of which eight quarters posted double-digit growth. This performance was driven by the retailer’s market share gain from the demise of Circuit City, which filed for bankruptcy in 2008. Also faring well was Bed Bath & Beyond, which rebounded quickly after the GR. From the fourth quarter of 2009, the company returned to high single-digit or double-digit sales growth.
On the other hand, Home Depot—with its Pro business—was more exposed to the near collapse of the US housing market and thus trailed in recovery, losing $11 billion in sales during 2007–2010. Home Depot’s sales figures did not fully recover until 2014, when sales finally topped pre-GR levels.
Looking at profitability, gross margins in the US home furnishing and appliances sector were fairly stable during the GR, with a slightly higher margin achieved in every fourth quarter. The average gross margin expanded 70 basis points to 35.0% from 2008 to 2010, helped by margin improvement at Best Buy and Bed Bath & Beyond. Average EBIT margins increased 230 basis point for the same period, led by Bed Bath & Beyond and Williams-Sonoma.
Today, most of these companies are well positioned to withstand the prolonged store closures caused by the coronavirus pandemic. However, Bed Bath & Beyond recently appointed a new CEO and is in the midst of a turnaround strategy. As we note in the Coresight Research Coronavirus Retail Robustness Index, management tenure is a key component for retailers in weathering the storm of the coronavirus situation, so Bed Bath & Beyond may face difficulties in the current environment.
[caption id="attachment_106837" align="aligncenter" width="700"]
Source: US Census Bureau[/caption]
We looked at performance of five home furnishing and appliances retailers during the 2007–2011 period: Bed Bath & Beyond, Best Buy, Home Depot, Lowe’s and Williams-Sonoma. Aggregate year-over-year sales plunged 6.5% in the fourth quarter of 2008, which was the deepest drop for the sector during the GR.
Best Buy outperformed the other selected retailers with the highest sales growth in 11 quarters during the 2007–2009 period, of which eight quarters posted double-digit growth. This performance was driven by the retailer’s market share gain from the demise of Circuit City, which filed for bankruptcy in 2008. Also faring well was Bed Bath & Beyond, which rebounded quickly after the GR. From the fourth quarter of 2009, the company returned to high single-digit or double-digit sales growth.
On the other hand, Home Depot—with its Pro business—was more exposed to the near collapse of the US housing market and thus trailed in recovery, losing $11 billion in sales during 2007–2010. Home Depot’s sales figures did not fully recover until 2014, when sales finally topped pre-GR levels.
Looking at profitability, gross margins in the US home furnishing and appliances sector were fairly stable during the GR, with a slightly higher margin achieved in every fourth quarter. The average gross margin expanded 70 basis points to 35.0% from 2008 to 2010, helped by margin improvement at Best Buy and Bed Bath & Beyond. Average EBIT margins increased 230 basis point for the same period, led by Bed Bath & Beyond and Williams-Sonoma.
Today, most of these companies are well positioned to withstand the prolonged store closures caused by the coronavirus pandemic. However, Bed Bath & Beyond recently appointed a new CEO and is in the midst of a turnaround strategy. As we note in the Coresight Research Coronavirus Retail Robustness Index, management tenure is a key component for retailers in weathering the storm of the coronavirus situation, so Bed Bath & Beyond may face difficulties in the current environment.
[caption id="attachment_106837" align="aligncenter" width="700"]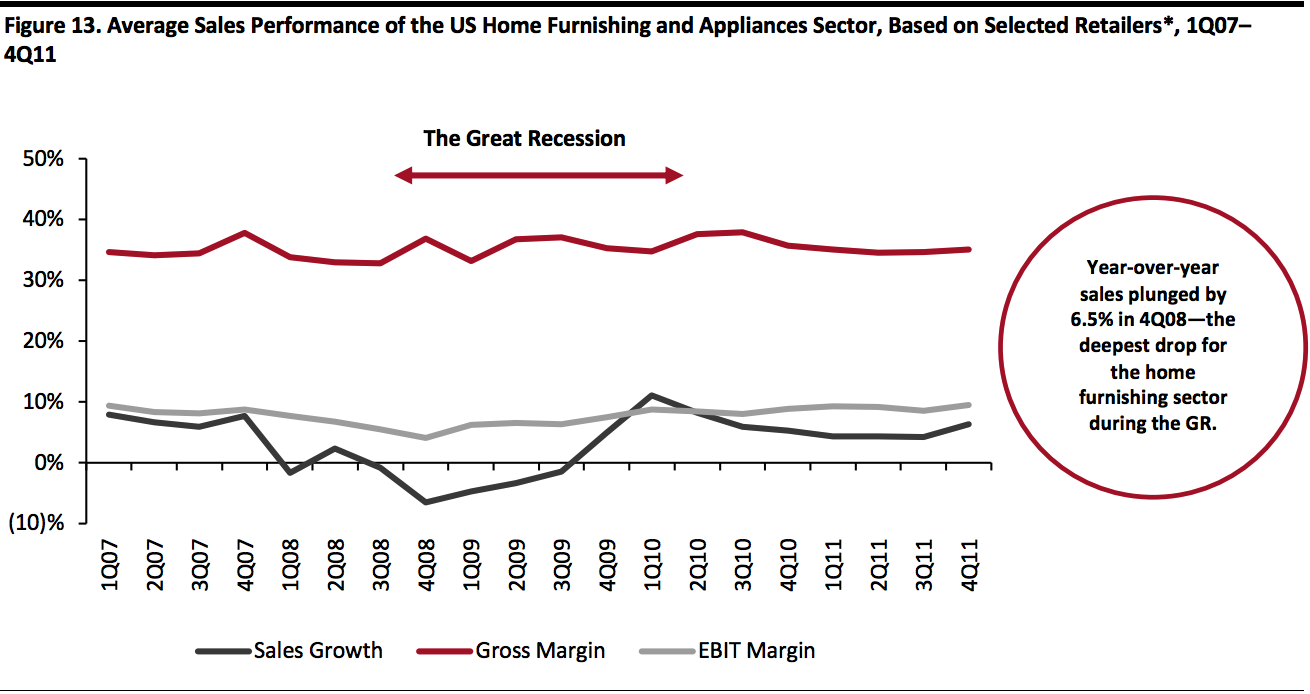 *Selected retailers are Bed Bath & Beyond, Best Buy, Home Depot, Lowe’s and Williams-Sonoma
Source: S&P Capital IQ[/caption]