About the Coresight Matrix
This report highlights the Coresight Matrix, a product designed to help Coresight Research clients better understand essential segments and key players in retail technology
From our work with clients from large companies to small startups, we discovered many need information on cutting-edge retail-technology, such as computer vision, visual reality, augmented reality and mass customization. Leading retailers want to know who the key players in the market are, which firms are driving improvements in these technologies, which startups might be the next rising stars and which startups should big companies look to work with.
The Coresight Matrix helps answer those questions, by leveraging our expertise at the intersection of retail and technology, supported by our proprietary qualitative data analysis. We identify, evaluate and then position key players within the selected market based on two criteria:
- Innovation Effort: How much effort and progress the company has made to improve its products, technology and innovation strategy in general.
- Market Power: Where the company sits in the industry now and how much impact it could have in the market.
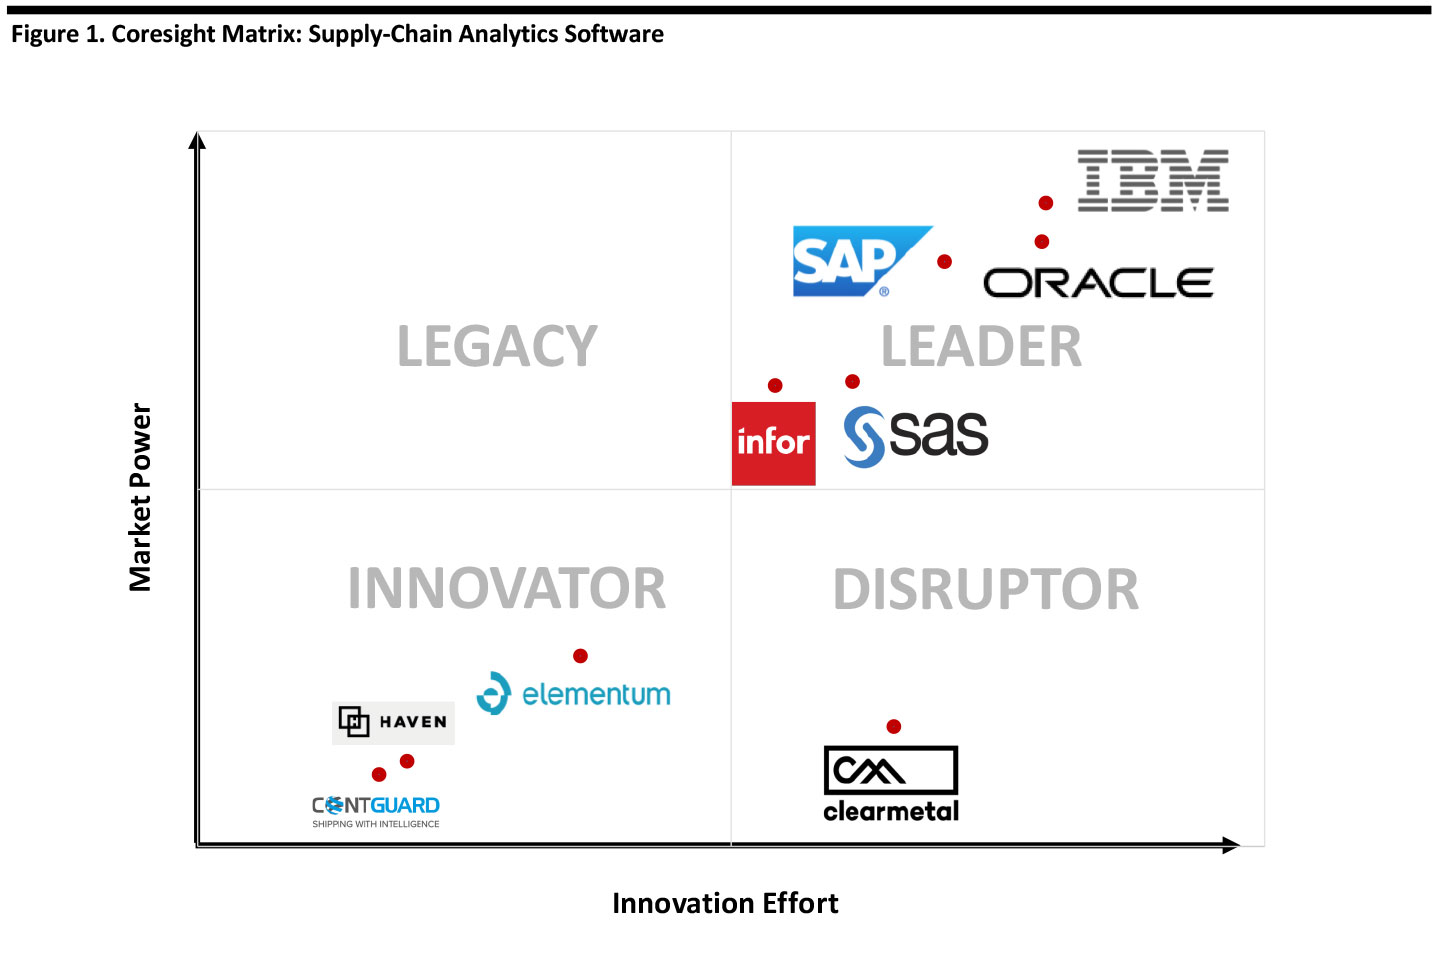
Later in this report, we include a market overview and provide more details about our methodology. The figure below presents our matrix for supply-chain analytics software. The companies in our matrix represent large technology and software firms, retailers and startup vendors that work with retailers and other companies. Due to the emerging nature of the sector, companies occupy the leader, innovator and disruptor quadrants – there are no legacy players.
[caption id="attachment_96043" align="aligncenter" width="700"]
 Source: Grata Data/company reports/Coresight Research
[/caption]
Tech giants such as IBM, Oracle and SAP, as well as a healthy mix of innovators, all compete within the supply-chain analytics software segment.
Below, we detail the companies featured in the Matrix, which have market power and are leaders in the space.
 ClearMetal offers supply-chain visibility software that uses data science to unlock efficiencies in global trade and solve the most complex operational problems in the supply chain. Its platform covers transport lead-time planning, predictive transport visibility and logistics ecosystem collaboration. The software aims to optimize lead-time and inventory planning, enable earlier recognition of revenue or expanded revenue opportunities, enable offering differentiated customer service, improve operational efficiency and reduce air-freight and transport costs. ClearMetal is a disruptor due to its use of data science and broad selection of functions designed to enhance supply-chain functions.
 Contguard’s solution uses IoT and AI in its software that aims to give clients full visibility and eliminate blind spots in the supply chain. Its platform provides shipment monitoring, analytics, predictions as well as actionable insights. The company’s solutions serve the automotive, consumer-goods, pharma, food and beverage, as well as defense and aerospace industries. Contguard is an innovator due to its use of leading-edge technologies such as AT and IoT.
 Elementum offers a SaaS-based multi-enterprise supply chain platform that enables users to orchestrate product availability, logistics, suppliers, manufacturing and customer orders. In supply-chain reporting analytics, the software provides cross-functional insights, develops reports based on comprehensive data and produces reports based on customized metrics. The company was founded in 2012 by Flex and some former employees to address the enormous challenges facing global supply chains. Elementum is an established innovator with substantial expertise in the impact of disruptions in global supply chains.
 Haven aims to expand global trade through digital transformation by helping enterprises automate logistics, collaborate with partners and gain valuable insights into their supply chain. The platform automates global logistics for commodity traders, food producers and other large shippers, streamlining workloads and unlocking shipment data that otherwise gets lost or buried, turning that information into actionable insights. Haven is an innovator because it helps enterprise digitalize, automate and understand their supply chains.
 IBM’s Watson Supply Chain Insights leverages the company’s AI technology to provide end-to-end visibility across systems and partners in the supply chain to drive greater efficiency, mitigate disruptions and reduce costs by improving efficiency and sharply reducing information retrieval time. The platform also offers KPIs and monitoring, a 360-degree view with drill-down capability, the ability to see the effect of events on shipments and real-time order and shipment status. IBM is a leader because it directed its innovative Watson AI platform to provide visibility, intelligence and monitoring of the supply chain.
 Infor performs supply-chain analytics and management in four main modules. First, its Infor Nexus platform brings together a network of buyers and sellers, in which every participant can transact with all the members of the network. Second, Infor’s Networked Order Management platform analyzes different metrics for a particular order and finds the optimal way to fulfill the order. Third, machine-learning technology underlies the Infor platform, enabling the automated transition to more suitable algorithms as business conditions change. Fourth, its Birst product is a networked, cloud-based, next-generation business-intelligence and analytics platform that enables users to perform analyses from the data stored in a data lake. Infor is a leader through its use of AI and its broad-based, flexible business intelligence and analytics platform covering major supply-chain functions.
 Oracle offers three separate supply-chain analytics software platforms. Oracle Analytics for Supply Chain Management performs order management, streamlines manufacturing, expedites production and manages logistics. Its Supply Chain Analytics (Siebel) platform is part of its BI Applications product line and optimizes supply-side performance by integrating data from across the enterprise value chain for more informed and actionable decisions. Its PeopleSoft Supply-Chain Analytics platform offers activity-based management, a supplier rating system, a manufacturing scorecard and financial management functionality. Oracle is a global leader in ERP software and through the broad functionality of its three supply-chain analytics and management platforms.
 SAP offers three main supply chain analytics platforms. Its Integrated Business Planning suite offers forecasting and demand management, inventory optimization, sales and operations planning and response and supply planning. Its Ariba Supply Chain Collaboration for Buyers platform enables real-time collaboration, dashboards, rapid onboarding and robust compliance. The Ariba Strategic Sourcing Suite handles process management, product-lifecycle sourcing, supplier selection and product costing. SAP is a global technology leader through its presence in ERP software and through its two supply-chain management and analytics platforms.
 SAS’s Supply Chain Intelligence platform supports supply and demand planning, product and process quality, aftermarket service and leverages IoT. In planning, the platform uses statistically driven forecasts and time-series models to enhance profitability. In quality, the platform aims to catch emerging issues sooner to limit customer impact, reduce operating costs and improve asset availability. In service, the platform helps improve customer service while minimizing cost, managing staffing, identifying suspicious claims and service providers and avoiding unnecessary repair and maintenance costs. SAS is a leader by leveraging its extensive analytics capabilities to handle operational supply-chain functions.
Other supply-chain analytics software companies not included in the matrix include Accenture, Genpact, JDA Software, Manhattan Associates, MicroStrategy and Tableau (acquired by Salesforce).
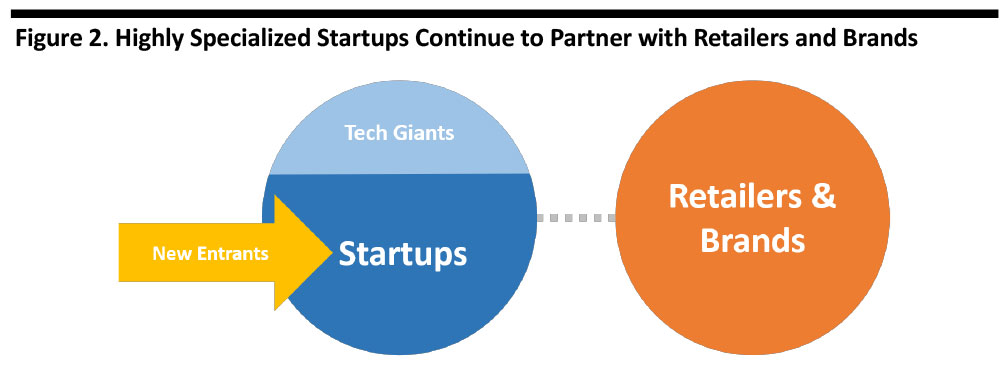
Large companies increasingly recognize the enormous amount of technology developed by startups, and large retailers are likely to continue to acquire and form partnerships with startups for the foreseeable future. Companies across multiple sectors have launched collaborative efforts to gather disruptive new ideas, harness new technologies and achieve competitive edge.
[caption id="attachment_96055" align="aligncenter" width="700"]
 Source: Coresight Research
[/caption]
Retailers are likely to increasingly rely on supply-chain analytics software, as they navigate the rapid rate of change in the retail industry and the pace of technological improvement in computing power and new software technologies, such as artificial intelligence. This robust market segment is likely to launch a healthy crop of innovators entering the supply-chain software analytics space.
Supply-Chain Analytics Software Segment Overview
Supply-chain analytics software has arisen out of the need to manage and derive insights from a large amount of data to drive growth, improve profitability, gain market share and make better business decisions. Market drivers include contracting product life cycles, limited visibility into the supply chain and the need to predict customer demand. Supply-chain analytics software can help reduce the cost of inventory and get products to market faster.
This software category functions in the following three key areas:
Analytics
- (Demand) forecasting.
- Purchasing.
- Inventory optimization.
Operations
- Warehouse management.
- Employee management.
- Distribution-center management.
- Transportation management.
Reporting
- Financial analysis.
- Sales and operations analytics.
- Results visualization and reporting.
Software tools such as artificial intelligence, including machine learning, can be used to automate and improve forecasting and determine optimal inventory configurations.
Market Overview: Supply-Chain Analytics Software Overview
The supply chain analytics market is estimated to be worth $4.1 billion this year, growing at a 14.6% CAGR during 2016-2023E, according to a forecast from MarketsandMarkets, as shown below.
[caption id="attachment_96080" align="aligncenter" width="700"]
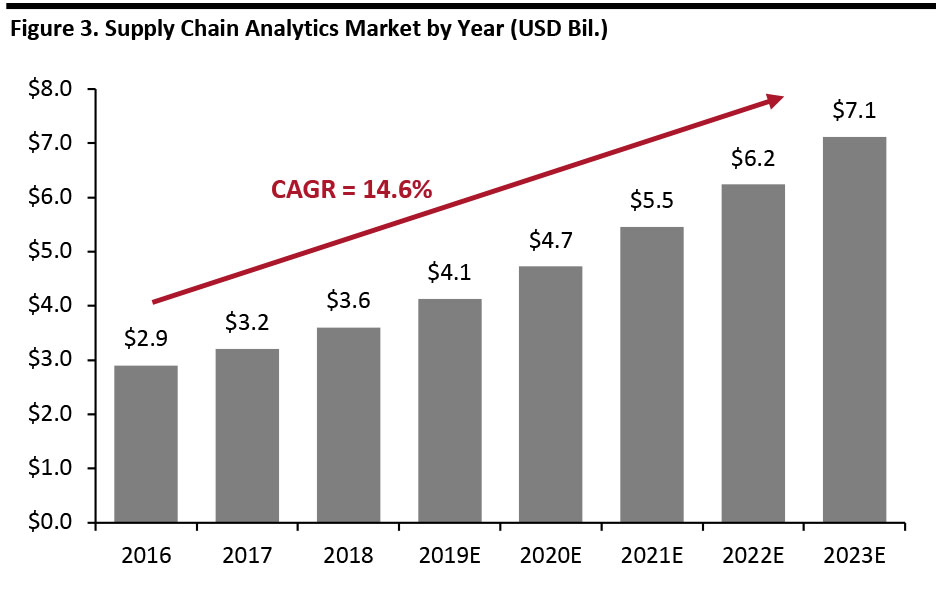 Source: MarketsandMarkets
[/caption]
The supply chain analytics market breaks down geographically as depicted below: North America is the largest market, followed by Europe and then Asia Pacific.
[caption id="attachment_96081" align="aligncenter" width="700"]
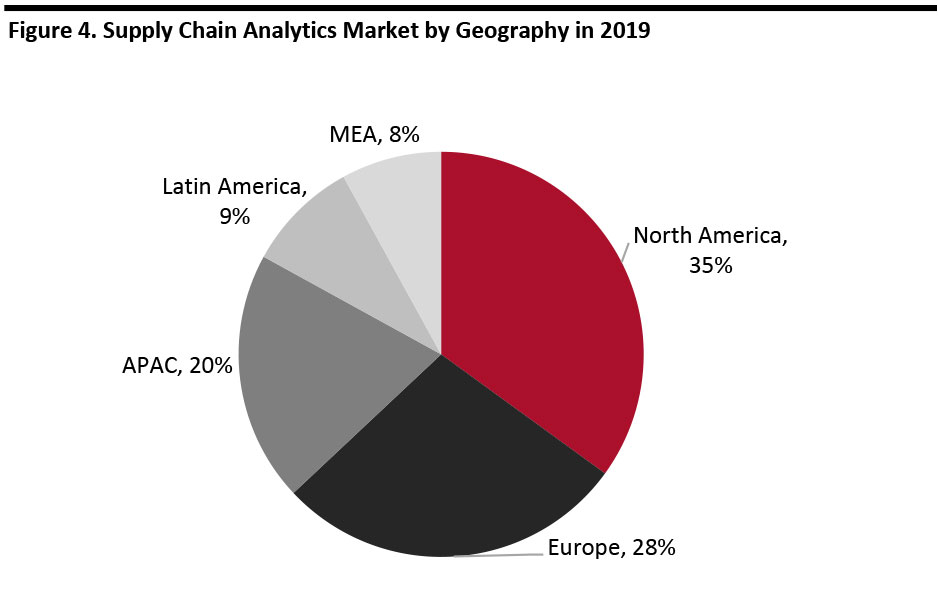 Source: MarketsandMarkets
[/caption]
The figure below breaks down the estimated 2019 supply chain analytics market by type.
[caption id="attachment_96082" align="aligncenter" width="700"]
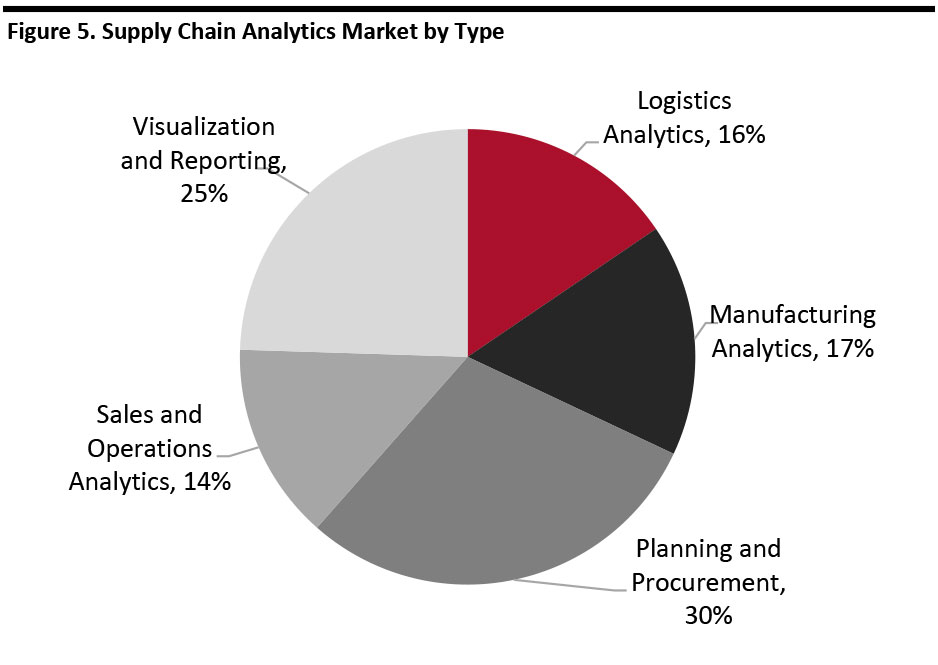 Source: HTF Market Intelligence
[/caption]
The figure below breaks down the supply chain analytics market by share.
[caption id="attachment_96083" align="aligncenter" width="700"]
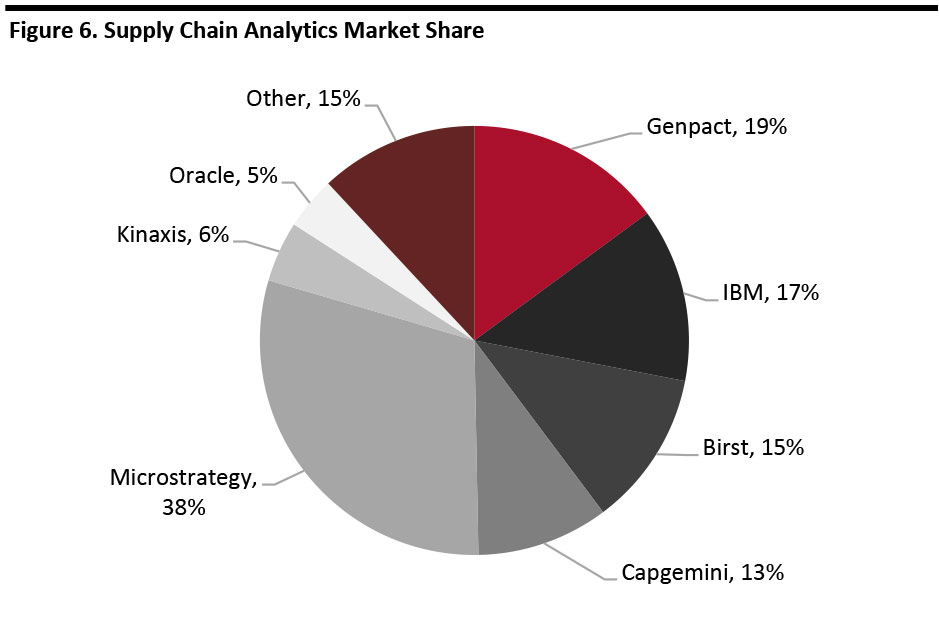 Source: HTF Market Intelligence
[/caption]
How We Create the Coresight Matrix
Coresight Research rates companies based on proprietary quantitative and qualitative analysis methods to demonstrate market trends, such as direction, maturity and participants. By leveraging our analysts’ expertise in the intersection of retail and technology supported by key data sources, we developed a methodology to determine the top platforms offering computer vision-based solutions to enhance the product search experience.
We evaluate companies based on two criteria: innovation effort and market power. This is what we found:
Innovation Effort (X axis): Coresight Research assesses companies’ innovation effort by evaluating product development, algorithm optimization, application expansion and technical research, looking at areas such as company patent filings and human capital investment. We normalize our innovation effort rating scores based on selected companies’ backgrounds, so smaller startups can compete with larger industry leaders on our matrix.
The values on the X-axis are a function of the company’s innovation intensity (based on patents and public-company information) plus a subjective evaluation of the company’s technological innovation in the subject area.
Market Power (Y axis): Coresight Research assesses companies’ market power using two major metrics: value appropriation and value creation. Under value appropriation, we evaluate companies’ ability to operate efficiently and effectively, and to secure customers. Under value creation, we assess companies’ ability to make customers react to products efficiently and effectively and to create an emotional experience for customer engagement. In addition, we consider companies’ backgrounds and factors such as funding, market position and number of employees.
The values on the Y-axis are a function of the company’s revenue or a suitable proxy.
After evaluation, we place each company into one of four quadrants: Leader, Disruptor, Legacy or Innovator. We base this as follows:
Leader: Companies that fall into this quadrant have high market power and high innovation effort. Generally, they possess a strong industry background with enough funding and technical ability to conduct research and develop cutting-edge products and algorithms. We see their effort and progress as bringing products and team to the next level through further investment and development. We expect them to continue leading the market. These companies demonstrate a clear understanding of market needs, they are innovators and thought leaders, and tend to have a presence in several geographical regions with a broad platform to support clients.
Disruptor: Companies that fall into this quadrant have a high level of innovation effort. They have a strong core business team and a good reputation in this specific market. Most are highly specialized in the field and have a clear understanding of market needs. On the normalized matrix, we sometimes find companies in the disruptor quadrant have even higher innovation effort scores than industry leaders, due to disruptors’ highly focused effort and market understanding. These companies have the potential to become leaders as they build more credible market positions and gain resources to sustain continued growth.
Legacy: Companies that fall into this quadrant hold large market share. The companies generally have a good market position and reputation in the industry but may have only recently started developing technology in this specific field. They have the funding and capability to develop a strong business in the field, but may still be looking for the right strategy, and have the potential to move to the leader quadrant.
Innovator: Companies in this quadrant have high growth potential. Most of them are in the process of improving algorithms and technologies and are expanding the applications of existing products. They are seeking funding and have the potential to move to the disruptor quadrants.
For Further Information
Please refer to the following Coresight RetailTech reports.
Introduction to Retail Tech
RetailTech: Supply-Chain Software
Coresight Matrix: Inventory-Optimization Software