DIpil Das
About the Coresight Matrix
The Coresight Matrix is designed to help our subscribers better understand key players in the retail-technology industry. Our analysts follow the increasing digitalization of the retail world and are helping clients achieve their digitalization and innovation strategies.
From our work with clients, from large companies to small startups, we discovered that many suffer a knowledge gap on information about cutting-edge retail-technology, such as computer vision, visual reality, augmented reality and mass customization. They want to know who the leading players in the market are, which firms are driving improvements in these technologies, which startups might be the next rising stars and which startups big companies should be looking to work with.
The Coresight Matrix helps to answer those questions, leveraging our expertise at the intersection of retail and technology, supported by our proprietary qualitative data analysis. We identify, evaluate and position key players based on two criteria:
- Innovation Effort: How much effort and progress the company has made to improve its products, technology and innovation strategy in general.
- Market Power: Where the company sits in the industry now and how much impact it could have in the market.
Later in this report, we include a market overview and provide more details about our methodology. The figure below presents our matrix for inventory-optimization software. The companies in our matrix represent large technology and software firms, retailers, and startup vendors that work with retailers. We note that due to the emerging nature of the sector, all companies occupy the leader, innovator or disruptor quadrants – there are no legacy players.
[caption id="attachment_93376" align="aligncenter" width="700"]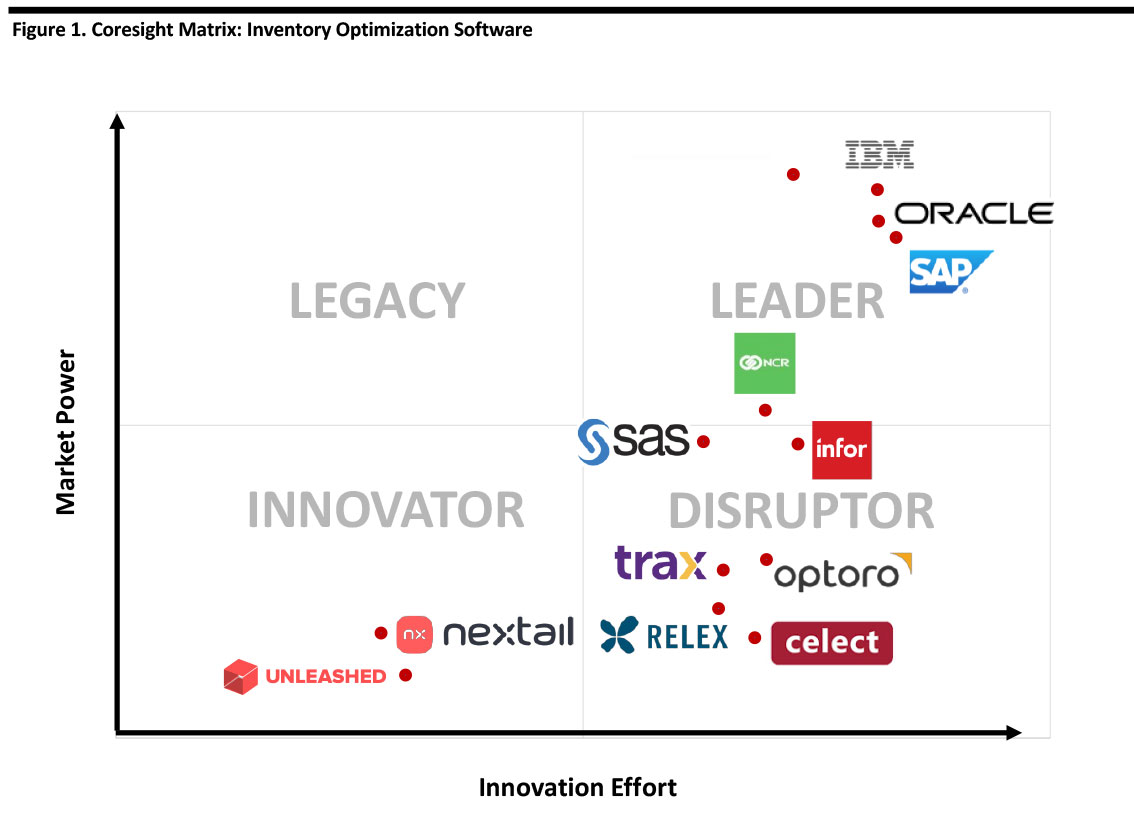 Source: Grata Data/Company reports/Coresight Research[/caption]
Companies Featured in The Matrix
Tech giants such IBM, Oracle and SAP, as well as a healthy mix of innovators, compete in the inventory-optimization segment. Below, we detail the companies featured in the top right corner of the matrix, representing strong market power and leaders within the space.
 Celect offers an AI/ML-based inventory-optimization platform with specific solutions to optimize allocation, fulfillment and plan and buy, which offers insights into future demand. Celect is a disruptor through its use of AI/ML to optimize fulfillment, allocation, plan and buy functions.
 IBM’s Dynamic inventory optimization solution acts as an extension to a retailer’s existing ERP or supply-chain management (SCM) system to reduce carrying and logistical costs and improve asset utilization and inventory performance by calculating safety stock, creating and updating demand forecasts, trading off inventory value and frequency and managing inventory carrying and processing costs. IBM also offers supply-chain solutions that leverage its Watson AI technology. IBM is a technology leader with a real-time inventory optimization solution that connects to existing ERP and CRM platforms.
 Infor’s supply chain management platform offers functionality for demand planning and sensing, supply planning, production planning and scheduling, inventory optimization, integrated business planning, and sales and operations planning. The company’s demand-planning platform uses artificial intelligence for demand forecasting, merchandise financial planning, lifecycle pricing, assortment planning and replenishment optimization. Infor’s Nexus is disrupting its market by uniquely combining physical and financial supply chain processes in a unified, cloud-based platform.
 Microsoft’s inventory optimization solution leverages the company’s cloud service and ERP software enables users to predict trends, analyze how specific SKUs affect sales and optimize product availability and store allocation, combined with IoT integration. Microsoft is expanding its leadership by using IoT and connecting with the company’s cloud services to identify and determine the best-performing SKUs in consumer package goods or retail.
 NCR’s broad product line includes solutions for enterprise systems including functionality for warehouse management, transportation management and supplier relations, in addition to tools for business intelligence and analytics for inventory management. In inventory management, NCR offers a cloud-based solution that tracks inventory in near real-time and integrates with the company’s POS and order management solutions. NCR is expanding its leadership by offering a flexible, open platform that offers near real-time inventory updates and integrates with the company’s POS and order management system.
 Nextail offers a platform that uses AI and prescriptive analytics to help retailers make better business decisions in their buying, distribution and rebalancing inventory. The company is an innovator in terms of using AI and prescriptive analytics to automate merchandising.
 Optoro offers a returns optimization platform using ML and predictive analytics to route returned and excess inventory to the next best location, reducing financial, operational, and environmental waste. Its solutions aim to increase profitability, reduce operating cost, provide better control and visibility and improve the customer experience. Optoro is disrupting its markets through ML and predictive analytics to manage inventory and reduce waste.
 Oracle’s supply chain execution cloud platform offers functions for inventory management, maintenance and manufacturing. Within inventory management, the platform manages end-to-end material flows encompassing warehouse, digital and fulfillment; inventory functions including visibility, control and reporting; and, accounting and cost management. The company’s NetSuite platform also provides functionality for real-time inventory visibility, inventory and order-fulfillment management, in addition to purchase management. Oracle’s leading ERP platform includes inventory control optimization by postponing shipments.
 Relex offers AI-based, cloud solutions for demand forecasting, automatic replenishment, inventory planning, managing markdowns and promotions, allocation and space planning and optimization. Relex is disrupting its market by combining AI and predictive analytics to reduce ordering time, improve inventory turnover and availability.
 SAP’s extensive ERP portfolio includes products and consulting services for supply-chain management including inventory planning. The company’s software focuses on inventory levels and location, minimizing out-of-stock situations, minimizing inventory to reduce working capital, improving demand planning and recommending actions to enhance profitability. SAP is leveraging its leadership in ERP software to include inventory planning and control to enable fine-tuning supply chain processes.
 SAS’s inventory automation workbench aims to automate and optimize inventory distribution by calculating optimized inventory levels and order quantities at every SKU, level and location to maintain adequate stock, maximize response times, increase revenue and reduce carrying costs. SAS is extending its leadership in data analytics by gathering and consolidating huge data volumes throughout the distribution chain to transform data for inventory optimization.
 Trax Retail uses machine vision to accurately determine in-store inventory, which is analyzed along with data from Nielsen to optimize assortment, drive higher sales and offer a consistent shopping experience. Trax is disrupting retail through its intelligence platform, which enables retailers to quickly mobilize store staff and elevate the shopping experience.
 Unleashed offers a real-time inventory management platform that enables retailers to manage purchasing, inventory, production and sales. The company’s inventory platform manages product cost and real-time inventory visibility across multiple warehouses and with flexible product management. Unleashed is innovating through its partnerships with e-commerce, POS and accounting software companies to offer an end-to-end business management solution.
Other inventory-optimization software companies not included in the matrix include JDA, which offers a broad line of retail solutions including category management, fulfillment, planning and operations, and Manhattan Associates, which offers solutions for inventory planning, as well as forecasting and replenishment.
Large companies are increasingly recognizing the enormous amount of technology developed by startups, and large retailers are likely to continue to acquire and form partnerships with startup companies in the foreseeable future. Companies across multiple sectors have launched collaborative efforts to gather disruptive new ideas, harness new technologies and achieve competitive edge.
[caption id="attachment_93392" align="aligncenter" width="700"]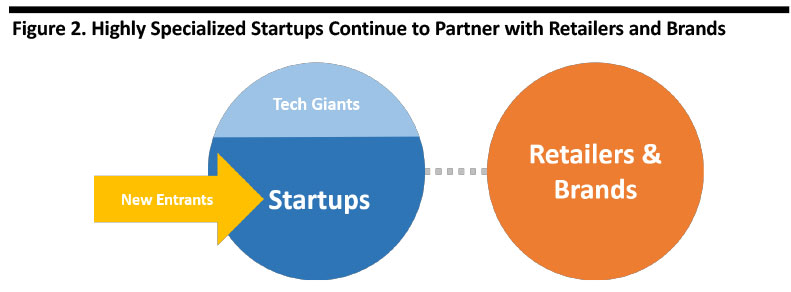 Source: Coresight Research[/caption]
Looking ahead, we see more retailers embracing inventory-optimization software. Given the fast rate of change in the retail industry and the rapid pace of technological improvement in computing power and new software technologies, such as artificial intelligence, there will likely be a healthy crop of innovators entering the inventory-optimization space.
Inventory-Optimization Software Overview
Inventory-optimization software seeks to find a balance between customer service, budget constraints and inventory cost. Optimizing inventory management offers a number of benefits:
- End-to-end supply-chain visibility, enabling retailers to access inventory and fulfillment information globally and in real time. With real-time supply-chain visibility, retailers can receive immediate information about manufacturing or shipping issues long before a shipment is delayed.
- Minimizing supply-chain variability due to seasonal factors, inaccurate forecasting, and one-time adjustments from promotions and the introduction of new products.
- Minimizing working capital, as maintaining lower inventory levels requires less working capital and enhances cash flow.
- Enhancing profitability, since maintaining lower inventory levels reduces the likelihood of overstocks that require heavy discounting or inventory write-offs.
- Customer service benefits when inventory is in the right location, in the right quantity at the right time, ensuring availability or a guaranteed shipment time to avoid missing a sales opportunity.
- Predicting the future using predictive analytics to anticipate where inventory will be needed in the future can mean less inventory needed today or inventory moved to a better location.
- Delaying manufacturing or distribution of a product until receipt of an order, which reduces the likelihood of the wrong product being manufactured or being assigned to the wrong location.
- Making tradeoffs, between service, budget and targeted or guaranteed service levels: Software can balance these competing objectives to find the optimal balance.
The more accurately retailers can estimate future inventory configurations and the more quickly they can receive and process information and react to it, the more tightly they can tie inventory to current and future demand and reduce financial and other types of error from suboptimal inventory deployment.
ML and other AI tools can help predict demand, and companies using AI and predictive analytics to forecast demand can use these tools to predict and execute optimal future inventory configurations. Companies employing AI/ML include IBM, Infor, Optoro, Nextail Labs, SAP and Trax Retail.
Market Overview: Inventory Optimization Software
Inventory-optimization software spans several categories, including supply chain management, warehouse management, analytics and even order management and fulfillment systems.
The table below outlines forecasts for several connected multibillion-dollar markets, including supply chain management, warehouse management and analytics markets, along with the computed compound annual average growth rates.
[caption id="attachment_93400" align="aligncenter" width="700"] Source: Allied Market Research/MarketsandMarkets/Coresight Research[/caption]
How We Create the Coresight Matrix
Coresight Research rates companies based on proprietary quantitative and qualitative analysis methods to demonstrate market trends, such as direction, maturity and participants. By leveraging our analysts’ expertise in the intersection of retail and technology supported by key data sources, we developed a methodology to determine the top platforms offering computer vision-based solutions to enhance the product search experience.
We evaluate companies based on two criteria: innovation effort and market power.
This is what we found:
Innovation Effort (X axis): Coresight Research assesses companies’ innovation effort by evaluating product development, algorithm optimization, application expansion and technical research, looking at areas such as company patent filings and human capital investment. We normalize our innovation effort rating scores based on selected companies’ different backgrounds, so smaller startups can compete with larger industry leaders on our matrix. The values on the X-axis are a function of the company’s innovation intensity (based on patents and public-company information) plus a subjective evaluation of the company’s technological innovation in the subject area.
Market Power (Y axis): Coresight Research assesses companies’ market power using two major metrics: value appropriation and value creation. Under value appropriation, we evaluate companies’ ability to operate efficiently and effectively, and to secure customers. Under value creation, we assess companies’ ability to make customers react to their products efficiently and effectively and to create an emotional experience for customer engagement. In addition, we consider companies’ backgrounds and factors such as funding, market position and number of employees. The values on the Y-axis are a function of the company’s revenue.
After evaluation, we place each company into one of four quadrants: Leader, Disruptor, Legacy or Innovator. We base this as follows:
Leader: Companies that fall into this quadrant have high market power and high innovation effort. Generally, they possess a strong industry background with enough funding and technical ability to conduct research and develop cutting-edge products and algorithms. We see their effort and progress as bringing products and their own team to the next level through further investment and development. We expect them to continue leading the market. These companies demonstrate a clear understanding of market needs, they are innovators and thought leaders, and tend to have a presence in several geographical regions with a broad platform to support clients.
Disruptor: Companies that fall into this quadrant have a high level of innovation effort. They have a strong core business team and a good reputation in this specific market. Most are highly specialized in the field and have a clear understanding of market needs. On the normalized matrix, we sometimes find that companies in the disruptor quadrant have even higher innovation effort scores than industry leaders, due to disruptors’ highly focused effort and market understanding. These companies have the potential to become leaders as they build more credible market positions and gain resources to sustain continued growth.
Legacy: Companies that fall into this quadrant hold large market share. The companies generally have a good market position and reputation in the industry but may have only recently started developing technology in this specific field. They have the funding and capability to develop a strong business in the field, but may still be looking for the right strategy, and they have the potential to move to the leader quadrant.
Innovator: Companies in this quadrant have high growth potential. Most of them are in the process of improving algorithms and technologies and are expanding the applications of existing products. They are seeking funding and have the potential to move to the disruptor quadrants.
For Further Information
Please refer to the following Coresight RetailTech reports: