About the Coresight Matrix
This report highlights the Coresight Matrix, designed to help readers better understand essential segments and key players in retail technology.
From our work with clients from large companies to small startups, we discovered many need information on cutting-edge retail-technology, such as computer vision, visual reality, augmented reality and mass customization. Leading retailers want to know who the key players in the market are, which firms are driving improvements in these technologies, which startups might be the next rising stars and with which startups big companies should consider working.
The Coresight Matrix helps answer those questions, by leveraging our expertise at the intersection of retail and technology, supported by our proprietary qualitative data analysis. We identify, evaluate and then position key players within the selected market based on two criteria:
- Innovation Effort: How much effort and progress the company has made to improve its products, technology and innovation strategy in general.
- Market Power: Where the company sits in the industry now and how much impact it could have in the market.
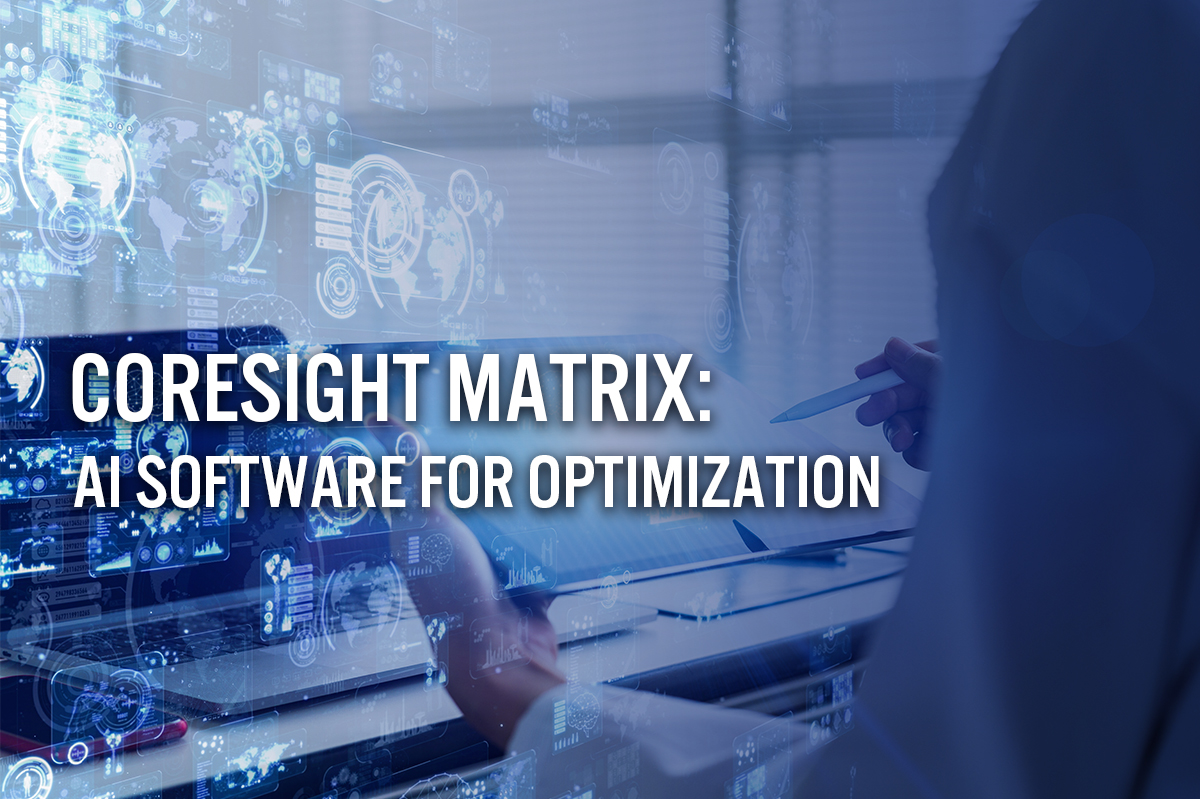
We include a market overview and provide more details about our methodology later in this report. The figure below presents our matrix for AI personalization software. The companies in our matrix represent large technology and software firms, retailers and startup vendors that work with retailers and other companies. Due to the emerging nature of the sector, there are companies only in the leader, innovator and disruptor quadrants: there are no legacy players.
[caption id="attachment_106363" align="aligncenter" width="700"]
 Source: Grata Data/company reports/Owler.com/Coresight Research
[/caption]
Companies Featured in The Matrix
Tech giants such as Google, IBM, Oracle, Salesforce, SAP and SAS, as well as a healthy mix of innovators, all compete within the AI optimization software segment.
Below, we detail the companies featured in the top right corner of the Matrix: those with market power and which are leaders in the space.
 Edited
 offers a retail decision platform that uses AI to optimize buying and merchandising decisions, enabling retailers to optimize assortment and pricing. It offers solutions for prelaunch planning, gauging market reaction and determining product pricing strategies.
 Google Cloud
 offers several AI-based tools for retailers, including merchandising and assortment and product life-cycle management. Its merchandising and assortment tools include real-time inventory analytics and product life-cycle management tools, as well as user machine learning to better understand customer demands and product movement.
 IBM
IBM offers several AI-based tools to optimize business decisions, including its Decision Optimization for Watson Studio, centered on its Watson AI platform, and its Cloud Pak for Data. Decision Optimization for Watson Studio provides tools such as visual dashboards and modeling assistants for model building, solving models and what-if analysis tools for evaluating multiple scenarios and is also available in the IBM Cloud. Watson Studio is a fully integrated data and AI platform that aims to modernize how businesses collect, organize and analyze data and use AI within the organization.
 Infor
Infor uses AI models to optimize inventory allocation and replenishment, aiming to maximize profit while considering demand, current inventory, constraints and supply chain costs of items, including ordering, shipping, receiving, warehousing, receiving in stores and shelf stocking.
 Market Beyond
 uses machine learning and AI to correct deficiencies in product assortments, pricing models, website traffic and other conversion factors. Insights include determining revenue leakage, SKU-level insights, SKU analysis, determining true market share and running behavioral analysis of online shoppers.
 Microsoft
 provides its Azure Synapse Analytics package for omnichannel and supply-chain optimization. The platform offers scale, creating insights from data warehouses and big-data analytics systems; insights from machine-learning models; a unified user experience for developing analytics solutions; and, security features such as column- and row-level security and dynamic data masking.
 Oracle Cloud
 offers a data platform for machine learning and broad range of AI-powered apps for financials, HR, marketing, sales, supply chain and manufacturing. Its financial apps optimize payment discounts. Its supply-chain apps offer analytical and AI-driven tools to optimize production yield, product quality, lead times, equipment and labor efficiency.
 Precima
 uses modeling and AI capabilities to create data-driven solutions that help organizations improve competitive positions through pricing optimization, promotional planning, assortment optimization, targeted marketing and supplier collaboration.
 Price Technologies
 offers a platform that analyzes price comparison data for the same new, used, refurbished or unbranded products. The platform also offers assortment optimization based on market intelligence derived from competitor pricing, assortment and promotions.
 Revionics
 offers lifecycle pricing, promotion and markdown optimization solutions for retail. Its Price Optimization platform combines strategy, business rules, AI and data to recommend optimal prices and forecast the effect on consumer demand, offering visibility into shopper price sensitivity, competitive price positions, cost changes, seasonality and other data points that influence profitability, competitiveness and demand.
 Salesforce’s
 Einstein AI platform helps optimize customer communication. Service Cloud customers can use algorithms to determine optimal routing and scheduling of personalized service. Marketing Cloud customers can determine the time customers are most likely to engage with e-mail messages. Einstein can also recommend optimal journeys for Internet-of-Things users.
 SAP
SAP applies AI in intelligent robotic process automation, to automate repetitive activities, improve the customer experience and elevate customer experiences.
 SAS
SAS offers two relevant software platforms. Its visual forecasting platform incorporates several analyses, forecasting and data-manipulation tools, while SAS Optimization provides an array of optimization, simulation and project scheduling techniques to identify actions including the ability to use distributed computing to achieve faster results.
 Zilliant
 offers a suite of AI-powered B2B price management and optimization software for traditional and online sales channels. Its product line includes a price manager for establishing, dynamically managing and streamlining the pricing process, in addition to tools for generating price quotes and for price optimization and guidance.
Large Versus Small Companies
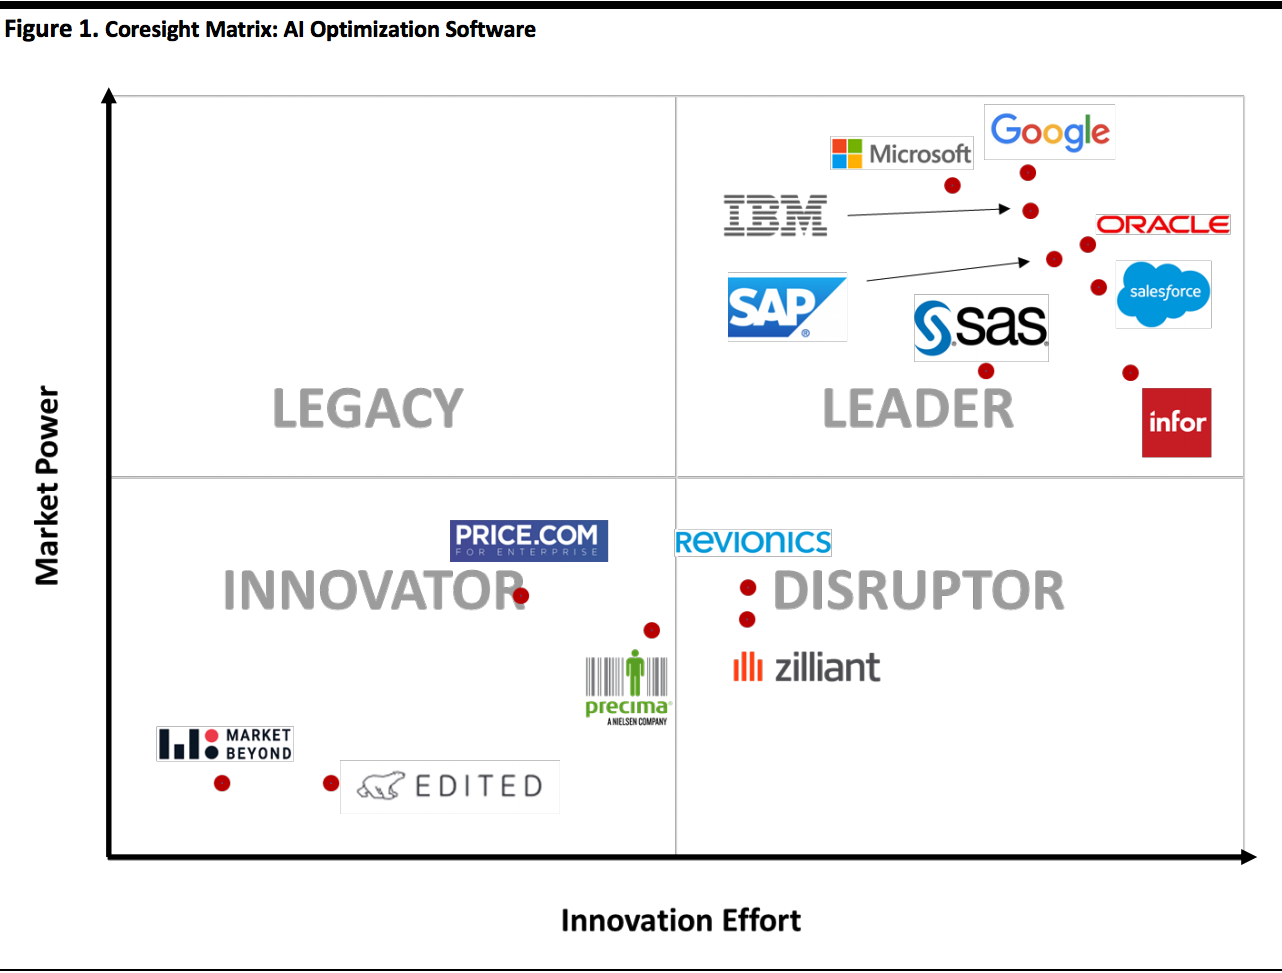
Large companies increasingly recognize the enormous amount of technology developed by startups, and large retailers are likely to continue to acquire and form partnerships with startups for the foreseeable future. Companies in multiple sectors have launched collaborative efforts to gather disruptive new ideas, harness new technologies and achieve competitive edge.
[caption id="attachment_106379" align="aligncenter" width="520"]
 Source: Coresight Research
[/caption]
Retailers will increasingly rely on AI optimization software in order to manage their businesses more efficiently to provide a better customer experience and compete with other AI-fueled peers. This robust market segment is likely to launch a healthy crop of innovators into the supply-chain software analytics space.
AI Optimization Segment Overview
Rapid advances in the ratio of price-to-computing power, driven by Moore’s Law, have enabled dramatic advances in the power and capabilities of software. These advances, in turn, have enabled huge leaps in artificial intelligence technology which is now being rapidly adopted.
In particular, the machine learning branch of AI excels at pattern recognition and creating algorithms that adapt and improve over time to incorporate new information.
The ability and usefulness of AI multiplies when combined with the special ability of the power software to run a large number of calculations rapidly to optimize, i.e., to maximize the value of a variable, given several input variables and/or constraints.
There are several parameters in retail that benefit strongly from optimization:
Pricing: Managing pricing and discounting affects revenues, margins and profitability.
Inventory: Optimizing inventory has consequences for profitability (i.e., having the correct amount and value of inventory prevents margin-depleting markdowns) and for working capital as inventory ties up cash.
Assortment: Similarly, maintaining the best possible assortment enhances profitability as well as preventing markdowns and excess inventory.
Market Overview: AI Software
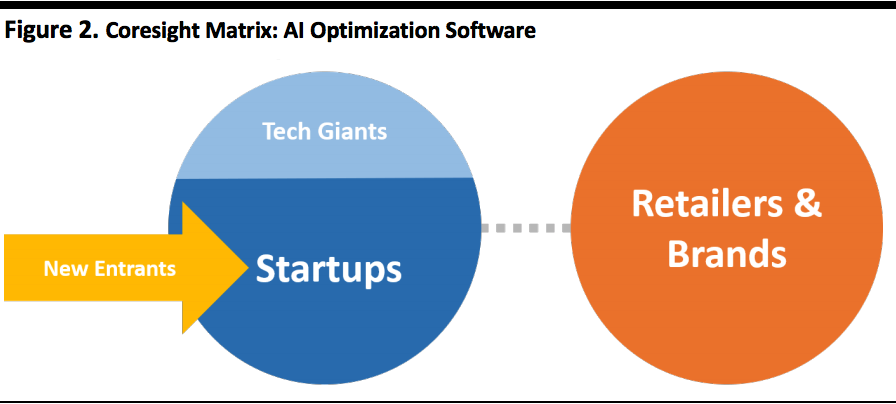
The global AI software market is estimated to be worth $22.6 billion in 2020, growing at a 39.3% CAGR through 2025, based on estimates from Statista.
[caption id="attachment_106380" align="aligncenter" width="520"]
 Source: Statista
[/caption]
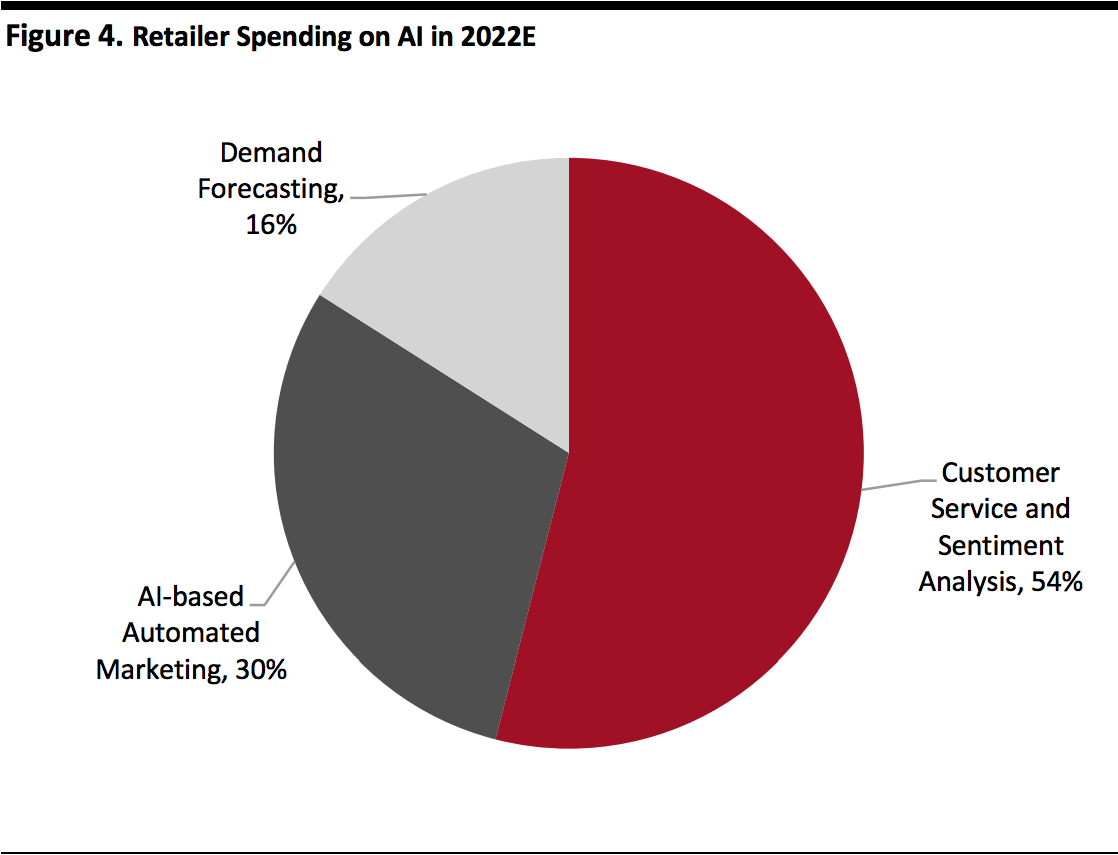
The retail industry is one of the largest spenders on AI, and retail AI spending is projected to grow from $2 billion in 2018 to $7.3 billion in 2022, a 38.2% CAGR, according to Juniper Research.
The figure below breaks down estimated retail AI spending in 2022: Note the customer service and sentiment analysis sectors are expected to account for more half of retailer AI spending, followed by automated marketing, accounting for more than a third of spending, with demand forecasting in third place.
[caption id="attachment_106381" align="aligncenter" width="520"]
 Source: Juniper Research
[/caption]
How We Create the Coresight Matrix
Coresight Research analyzes companies based on proprietary quantitative and qualitative analysis to demonstrate market trends, such as direction, maturity and participants. By leveraging our analysts’ expertise at the intersection of retail and technology, supported by key data sources, we developed a methodology to determine the top platforms offering computer vision-based solutions that enhance the product search experience.
We evaluate companies based on two criteria: innovation effort and market power. This is what we found:
Innovation effort (X axis): Coresight Research assesses companies’ innovation effort by evaluating product development, algorithm optimization, application expansion and technical research, looking at areas such as company patent filings and human capital investment. We normalize our innovation effort rating scores based on selected companies’ backgrounds, so smaller startups can compete with larger industry leaders on our matrix.
The values on the X-axis are a function of the company’s innovation intensity (based on patents and public-company information) plus a subjective evaluation of the company’s technological innovation in the subject area.
Market power (Y axis): Coresight Research assesses companies’ market power using two major metrics: value appropriation and value creation. Under value appropriation, we evaluate companies’ ability to operate efficiently and effectively, and to secure customers. Under value creation, we assess companies’ ability to make customers react to products efficiently and effectively and to create an emotional experience for customer engagement. In addition, we consider companies’ backgrounds and factors such as funding, market position and number of employees.
The values on the Y-axis are a function of the company’s revenue or a suitable proxy.
After evaluation, we place each company into one of four quadrants: Leader, Disruptor, Legacy or Innovator, as follows:
Leader companies have high market power and high innovation effort. Generally, they possess a strong industry background with enough funding and technical ability to conduct research and develop cutting-edge products and algorithms. We see their effort and progress as bringing products and teams to the next level through further investment and development. We expect them to continue leading the market. These companies demonstrate a clear understanding of market needs, they are innovators and thought leaders and tend to have a presence in several geographical regions with a broad platform to support clients.
Disruptor companies have a high level of innovation effort. They have a strong core business team and a good reputation in this specific market. Most are highly specialized in the field and have a clear understanding of market needs. On the normalized matrix, we sometimes find companies in the disruptor quadrant have even higher innovation effort scores than industry leaders, due to disruptors’ highly focused effort and market understanding. These companies have the potential to become leaders as they build more credible market positions and gain resources to sustain continued growth.
Legacy companies hold large market share. The companies generally have a good market position and reputation in the industry but may have only recently started developing technology in this specific field. They have the funding and capability to develop a strong business, but may still be looking for the right strategy, and have the potential to move to the leader quadrant.
Innovator companies have high growth potential. Most are in the process of improving algorithms and technologies and are expanding the applications of existing products. They are seeking funding and have the potential to move to the disruptor quadrants.
For Further Information
Please refer to the following Coresight Research reports.
AI and Price Optimization in Retail
Coresight Matrix: Inventory-Optimization Software