DIpil Das
Introduction
As disposable incomes continue to rise in China, more Chinese consumers are traveling abroad, pouring billions of dollars into the cash registers of retailers and service providers worldwide. And there remains a long runway for growth: Approximately 120 million Chinese citizens currently hold a passport, according to Chinese travel services company Ctrip – that equates to around 8.6% of the population. Our fifth annual survey of Chinese outbound tourists reveals an increase in total spending, driven by growth in traveler numbers and spending on experiences — even as it recorded a small decline in per trip retail spending. Chinese tourists made 149.7 million outbound trips last year, a 14.7% increase year over year, according to the Chinese Ministry of Culture and Tourism — although that total falls to 106.6 million once we exclude day trips to Hong Kong and Macau. Once we strip out those day trips, we estimate that Chinese tourists spent a total of $203 billion (¥1,390 billion) on shopping, food and beverage purchases, sightseeing and entertainment, and beauty and wellness experiences in overseas markets in the 12 months ended August 2019. In this report, we offer insights from the results of our in-depth, September 2019 survey of Chinese outbound travelers, which asked respondents about these and other topics:- How many trips they took in the past year and which countries they visited.
- What products they bought at retail, at what types of stores they shopped and what services were important to them when choosing among retailers.
- How much they spent on shopping, food and beverages, and sightseeing and entertainment on their most recent trip abroad.
- Who they traveled with, what kind of trip they booked (e.g., group versus independent) and what factors were important to them when choosing a destination.
- Plans to purchase luxury goods overseas and domestically in the coming months.
- How they used their smartphones and the WeChat app on their latest overseas trip.
Survey Methodology
We surveyed 900 Chinese Internet users who had spent at least one night on a trip outside Mainland China in the past 12 months. Those trips included business and leisure trips, although we asked some of our questions only of those who had taken leisure trips. Our survey panel was demographically weighted to be representative of the 18–59 age group, it does not represent the views of travelers aged 60 and older. We conducted our survey in early September 2019, and many questions asked respondents to provide answers based on travel in the past year (September 2018-August 2019). Throughout this report, we make comparisons to last year’s survey findings: Our survey last year was undertaken in July 2018 and the respondent profile was comparable to this year’s. We provide annual exchange rate data in the appendix. For conversions from Chinese renminbi to US dollars, we have used an exchange rate of ¥1 = $0.1459.Six Insights from Our 2019 Survey
1. Total Number of Outbound Trips Climbed, Driven by Growth in the Number of Unique Travelers Our 2019 survey recorded a small decline in the average number of trips per traveler: Government data shows that the total number of Chinese outbound trips (excluding day trips) was up 13.6% to 106.6 million, but our survey found that the mean number of overseas trips per traveler declined to 1.9 in the past 12 months. We estimate the number of unique travelers was 52 million in 2018, up approximately 15% (7 million in absolute terms) from 2017: in other words. more people are traveling overseas, but each person is taking fewer trips. The drop in the average number of trips per traveler was mainly driven by residents of tier-one cities, who on average took 1.8 trips, down from the 2.3 in last year’s survey. The average number of trips for residents of lower-tier cities declined from 2.0 to 1.9 in the past 12 months. In addition, travelers from tier-one cities accounted for fewer than 30% of total outbound tourists this year, down from 36% in 2018, as demand grows among the growing middle class in lower-tier cities. 2. Growth in Independent Travel Accelerates – Impacting Shopping Destinations Traveling independently – i.e., travelers making their own arrangements and not using a tour guide – became the most popular option this year, primarily driven by tier-one city travelers, which has also grown consistently in the past three years. Our survey recorded a sharp decline in the proportion of respondents who traveled in a group, from 38.0% in 2018 to 26.3% in 2019. For tier-one citizens, the proportion of respondents who bought a package (e.g., a flight and hotel) but traveled independently jumped from 17.5% in 2018 to 27.3% in 2019. The proportion of tier-one travelers who made their own arrangements but hired a local tour guide expanded to 14.5% this year. For non-tier-one residents, traveling independently with no tour guide replaced the option of travel independently after purchasing a package tour to be the second-most popular option. The gap between traveling in a group and independently without a tour guide shrank 22 percentage points, showing a growing interest in independent travel from non-tier-one residents. As a result of this growing number of independent travelers, the proportion of total retail spending captured by outlet stores, traditionally driven by group tours, continued to decline this year, to an estimated 8.1%, from 9.3% in 2018 and 11.4% in 2017. Travelers overall, not only those from first-tier cities, have moved toward more independent forms of travel. Independent travelers may rely on services that help them reduce friction, or lower the cost of their trips, such as on-site tax refund services or free shuttles. And, with no tour guides or others to help with local language, Chinese-speaking staff will become increasingly important for retailers in destination countries. 3. Total Retail Spending Grows but per Trip Retail Spending Declines We estimate Chinese tourists spent a total of $203 billion (¥1,390 billion) in overseas markets in the 12 months ended August 2019, driven by the increase number of travelers. An estimated $102 billion (¥701 billion) of that total was directed to retail spending, up 11% year over year at constant currency. On a comparable basis, our survey found total average per trip spending was up only 1.1% in 2019. And we found average retail spending per trip was down 2.3% in 2019. Many reasons could have contributed to this decline: Enhanced cross-border e-commerce options, greater price parity for goods in China and other countries and the weakened renminbi are important factors. The renminbi exchange rate declined almost 5% against the US dollar and 9% against Japanese yen during the 12 months covered in our survey, which would have lowered buying power for overseas travelers. But the main force could be Chinese tourists’ continuing shift away from shopping to spending more on leisure services and experiences while abroad. 4. Sustained Demand for Beauty Products The average retail spend per trip may have declined, but demand for overseas beauty purchases — especially prestige beauty products — continues to grow. Beauty was again the most-bought retail category in this year’s survey, with 73.5% of travelers buying beauty items abroad. And, while last year the beauty category was in joint first position with clothing, footwear or accessories, our 2019 survey found beauty had pulled ahead, as measured by the proportion of travelers buying the category. Our survey suggests that prestige beauty will be in demand in the coming months:- Some 57.4% of survey respondents who said that they expect to travel again in the coming months plan to increase their overseas spending on luxury beauty, making it the top luxury category for higher overseas spending. Clothing was the second-most-popular luxury category for higher overseas spending, with 49% of respondents saying that they expect to spend more.
- Demand for overseas luxury beauty items continues to outstrip domestic demand for the category. When we asked what luxury categories respondents expected to spend more on within China in the coming months, beauty was in third place, with 37% saying that they expect to up their spending on the category, up from 29% in last year’s survey but still behind the 57.4% of those who plan to spend more on the category overseas.
- The proportion of survey respondents who used mobile payment methods on their latest trip is almost the same as the portion who used UnionPay, a China-based payment settlement service.
- Our survey recorded more than 99% of respondents used WeChat on their latest trip and 61.8% used WeChat for shopping payment, a significant increase from last year. Using WeChat Pay at restaurants also climbed 15.4 percentage points to 45%.
- When we asked travelers what influenced their choice of retailers overseas, some 75.8% said the ability to pay by mobile was a factor, up from 63% last year. Mobile payment has surpassed discounts and payment by UnionPay to be the most important factor in choosing where to shop in this year’s survey.
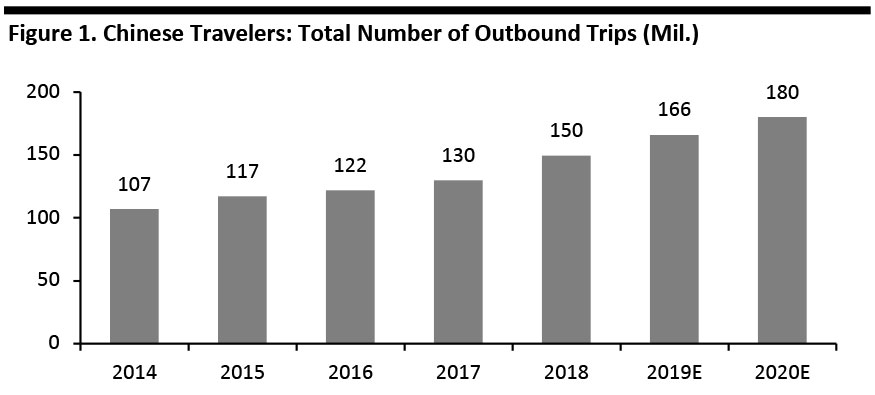 Data includes day trips, such as to Hong Kong and Macau
 Source: China Tourism Academy/Ministry of Culture and Tourism/Coresight Research [/caption] Chinese travelers made nearly 150 million trips outside Mainland China in 2018, according to the Chinese Ministry of Culture and Tourism, up 14.7% year over year. The China Tourism Academy expects to see 166 million outbound trips this year, up 11% from 2018. We expect the number will climb to 180 million in 2020. In 2016, The China National Tourism Administration forecast that the Chinese outbound trip total would reach 150 million in 2020 – but it looks like we may see that number exceeded in 2019. [caption id="attachment_98990" align="aligncenter" width="700"]
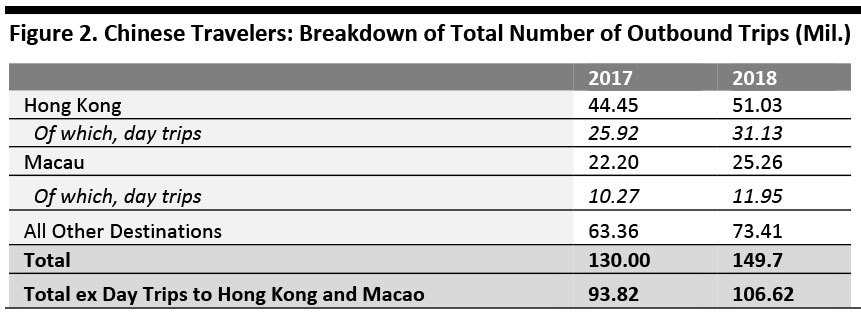 Source: China Tourism Academy/Ministry of Culture and Tourism/Hong Kong Tourism Board/Government of Macao Statistics and Census Service/Coresight Research[/caption]
Last year, more than half of all Chinese travelers’ visits to Hong Kong and to Macau were day trips rather than conventional vacations involving an overnight stay. Once we strip out those day trips, total Chinese outbound tourist vacation trips totaled over 106 million in 2018, up 13.6% year over year.
[caption id="attachment_98991" align="aligncenter" width="700"]
Source: China Tourism Academy/Ministry of Culture and Tourism/Hong Kong Tourism Board/Government of Macao Statistics and Census Service/Coresight Research[/caption]
Last year, more than half of all Chinese travelers’ visits to Hong Kong and to Macau were day trips rather than conventional vacations involving an overnight stay. Once we strip out those day trips, total Chinese outbound tourist vacation trips totaled over 106 million in 2018, up 13.6% year over year.
[caption id="attachment_98991" align="aligncenter" width="700"]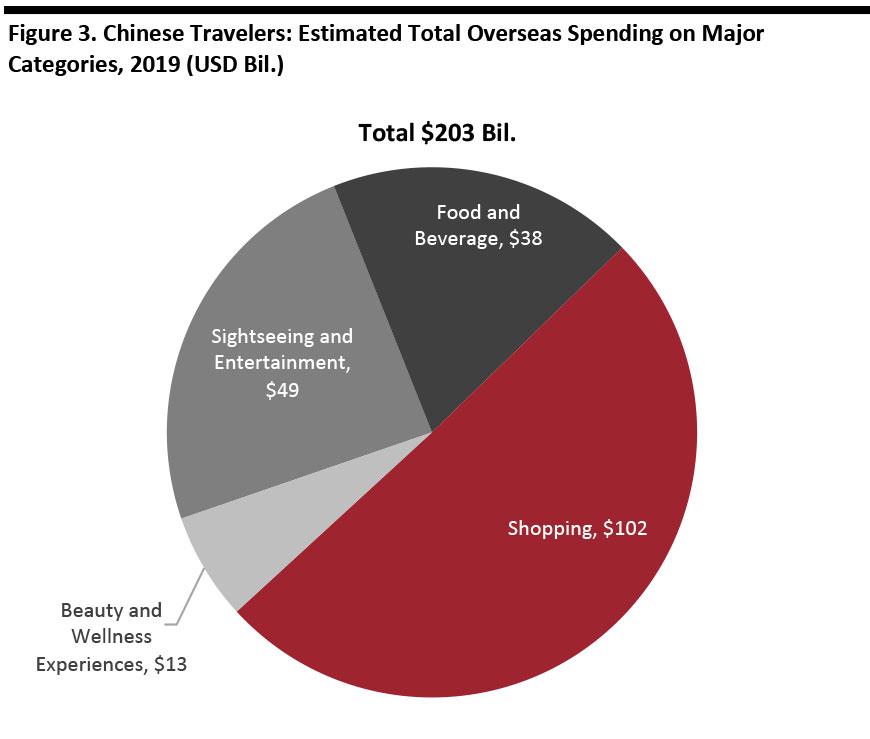 Excludes day trips to Hong Kong and Macau. Our estimates do not adjust for travelers under age 18, who are included in total traveler numbers but excluded from the per trip spending estimates generated by our survey and who may be expected to spend less per trip
 Source: Coresight Research [/caption] In the four categories of shopping: sightseeing and entertainment; food and beverages; beauty and wellness experiences; and, shopping, we estimate that Chinese tourists spent a total of $203 billion (¥1,390 billion) in overseas markets in the 12 months ended August 2019. Our survey included beauty and wellness experiences as a spending option for the first time this year. Excluding beauty and wellness experiences for comparability with 2018, we estimate total spending was up 14.9% at constant 2019 exchange rates. Our figures are based on our latest survey, which found the average per trip expenditure was $1,902 (¥13,038) across the shopping, food and beverages, sightseeing and entertainment categories and beauty and wellness experiences. Our figures exclude lodging and travel services. Our latest figures represent spending undertaken on the 106.6 million personal trips involving a stay of at least one night outside Mainland China in 2018 (the latest full-year data that correspond to the period of our survey) and therefore exclude spending by day-trippers to Hong Kong and Macau. The United Nations World Tourism Organization (UNWTO) estimates that tourist spending by outbound Chinese travelers across all expenditure categories totaled $277 billion in 2018, up 8% year over year at constant exchange rates. China leads the world in spending by tourists, according to the UNWTO, with the US in second place at $144 billion in 2018. The UNWTO’s definition includes all expenditures by outbound tourists in another country, including expenditures on services such as lodging.
Average Number of Trips Is Declining
In this and subsequent sections, we review the findings of our survey of Chinese travelers. [caption id="attachment_98992" align="aligncenter" width="700"]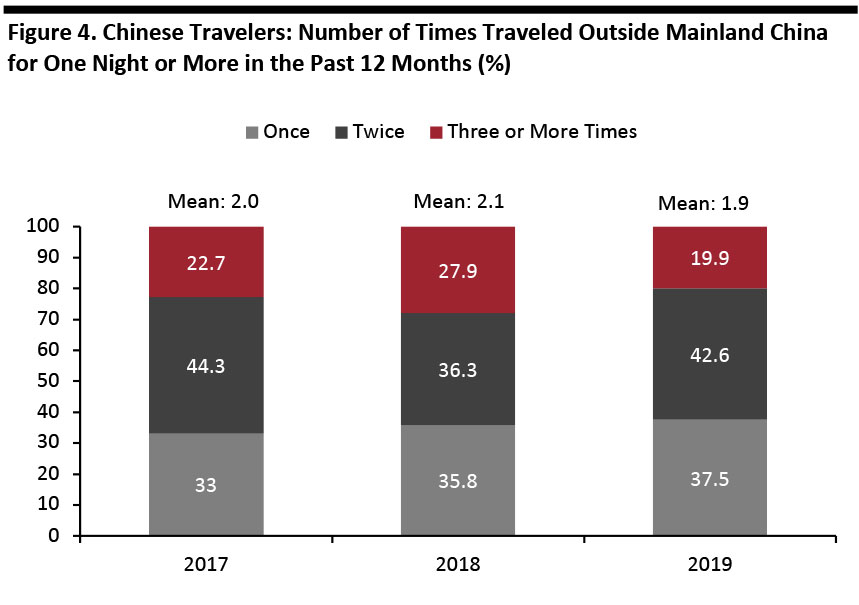 Base: 900 Internet users who had taken a trip outside Mainland China in the past 12 months
 Source: Coresight Research [/caption] We begin our survey results roundup with a review of how many trips respondents said they had taken in the past year. Despite the increase in the number of travelers saying that they had taken just one trip, the mean number of overseas trips per traveler declined to 1.9 in the past year, versus 2.1 in our survey a year earlier. With 106.62 million total outbound trips, adjusting the mean number for the months we covered in the survey, the mean number of trips per traveler declined from 2.1 to 2.0 for the 2018 calendar year. This implies the number of unique travelers was 52 million 2018, up approximately 15% (7 million in absolute terms) from 2017, indicating a stronger interest in traveling overseas. Our survey specifically asked respondents about trips involving a stay of one night or more, so the figures exclude day trips, such as to Hong Kong or Macao. [caption id="attachment_98993" align="aligncenter" width="700"]
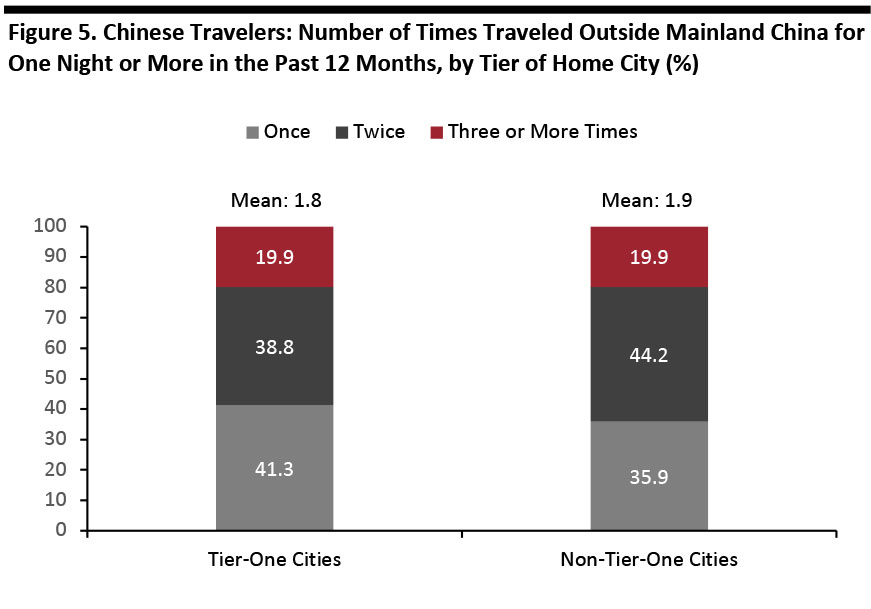 Base: 900 Internet users who had taken a trip outside Mainland China in the past 12 months
 Source: Coresight Research [/caption] In our most recent survey, travelers from tier-one cities took an average of 1.8 trips, while travelers from cities in other tiers took an average of 1.9 trips. Our survey last year recorded averages of 2.3 trips for tier-one city dwellers and 2.0 trips per year for lower-tier city dwellers, suggesting that the gap between tier-one and non-tier-one travelers is shrinking. This change was fueled by a decline in the proportion of travelers from tier-one cities who said that they had made three or more trips in the year: that proportion declined to 19.9% this year for residents of both tier-one cities and lower-tier cities. Last year, the proportion was 34.1% for tier-one residents and 24.3% for residents of lower-tier cities.
Where They Go: Travelers Are Switching Destinations
[caption id="attachment_98994" align="aligncenter" width="700"]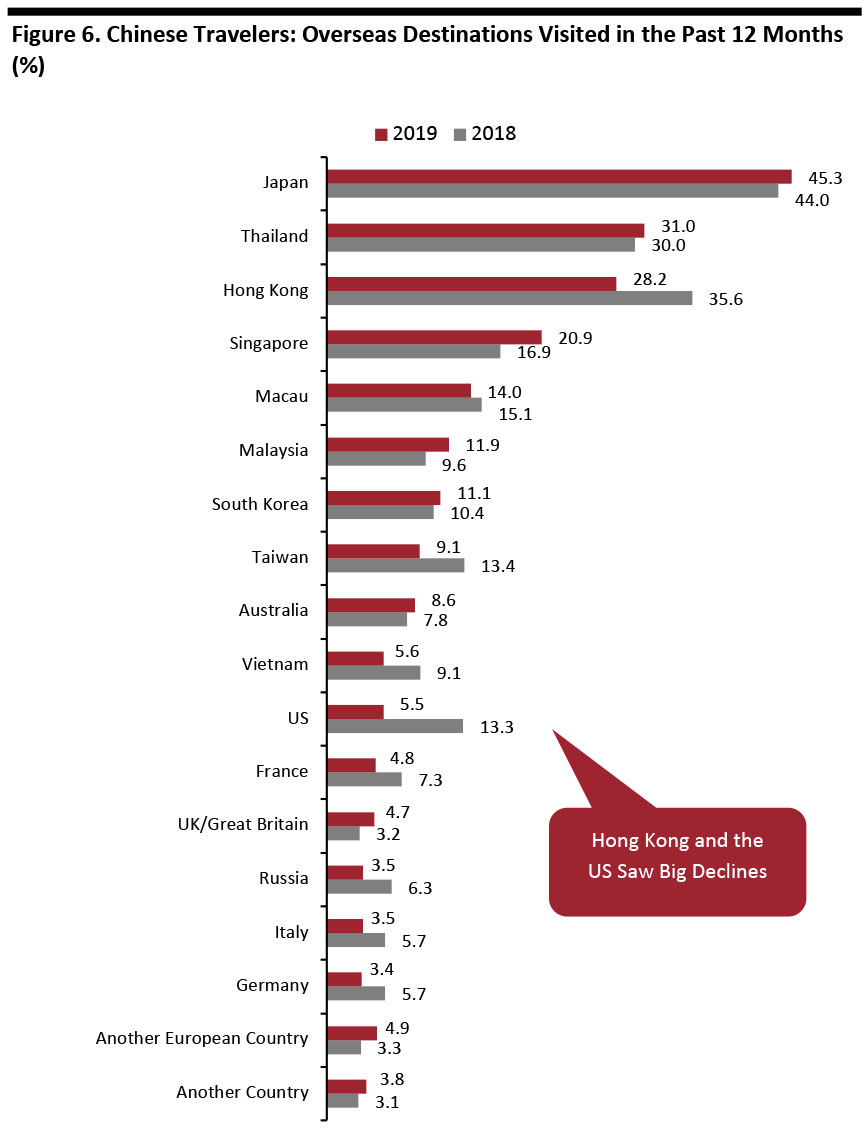 Base: Internet users who had taken a trip outside Mainland China in the past 12 months (900 in 2019 and 895 in 2018)
 Source: Coresight Research [/caption] In this year’s survey, Japan was again the most popular destination for Chinese travelers, and Asian destinations continue to dominate the rankings. Asia In total, 93% of travelers surveyed had visited Asian destinations in the past 12 months, up from 89% last year. The Asia total included an aggregate 35% of respondents who had visited Hong Kong or Macau this year, down from 39% last year. Hong Kong and Taiwan saw Mainland visitor numbers fall sharply. In July 2019 (just within our 12-month period, which ended August 2019), Beijing officially suspended individual travel permits to Taiwan – so to go, travelers have to join a tour. (Mainland travelers need a special travel permit, which is different to a passport, to visit Hong Kong or Taiwan.) Tourists from 47 cities had previously been allowed to visit Taiwan independently. The political tension between Mainland and Hong Kong may have discouraged Mainland tourists. The year-over-year story points to a changing mix of Asian destinations. Hong Kong, Taiwan and Vietnam showed major declines, while Chinese travelers are visiting traditional holiday destinations in Asia such as Thailand, Malaysia and Singapore. For decades, these three countries have been commonly packaged together by travel agencies to offer attractive deals, and are suitable for first-time overseas travelers because of the perceived similar lifestyles and culture. Asian destinations are also closer, meaning lower airfares. Accommodations, services and tickets for tourist attractions are also cheaper than in Western countries. The weakened renminbi probably made lower-cost destinations more appealing. Japan’s relative popularity as a destination increased over the past year, according to our survey, despite the renminbi weakening versus the yen. Data from the Japan National Tourism Organization also shows total inbound visits from China rose in absolute terms in the 2018 calendar year, confirming Chinese growing interest in the region. Europe Some 20% of those surveyed had visited Europe this year, versus 21% last year, with 14% visiting Western Europe (France, Germany, Italy or the UK) this year versus 15% last year. The US The survey revealed a major decline in travelers going to the US. Security and visa policy were among the top factors Chinese travelers considered when choosing a travel destination (more detail later). The US government shut down in December 2018 (meaning it stopped processing visa applications), tighter US visa rules and the weaker renminbi against the US dollar discouraged Chinese tourists. [caption id="attachment_98995" align="aligncenter" width="700"]
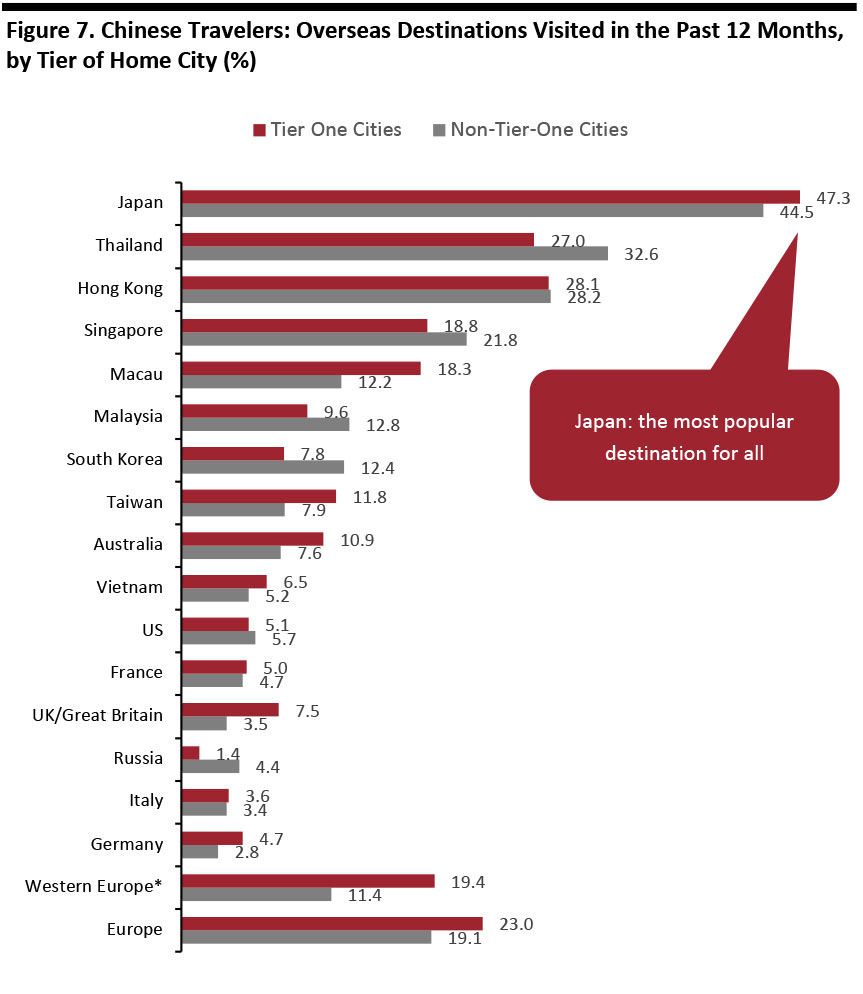 Base: 900 Internet users who had taken a trip outside Mainland China in the past 12 months *France, Germany, Italy and the UK
 Source: Coresight Research [/caption] Residents of tier-one cities in China are driving the shift to Asian destinations. Our survey recorded a major increase in the percentage of travelers from tier-one cities who visited Japan, from 37.1% last year to 47.3% this year. Meanwhile, tier-one residents are retreating from locations such as Hong Kong and the US. Just 5.1% of tier-one travelers visited the US in the past year, down sharply from 20.4% in the preceding year. The current political environment presents a less welcoming feeling to Chinese travelers. The renminbi was also devalued 4.5% against the US dollar, making a trip to the US more expensive. We saw a similar dive for Hong Kong. Residents of lower-tier cities are generally more likely than their tier-one peers to be price-sensitive. With a weakened Chinese renminbi, savings on airfare and greater affordability make destinations in Asia more appealing. Travelers who live in tier-one cities overindex on travel to the UK, and we see a similar pattern for travel to Western Europe.
What’s Important in a Destination?
[caption id="attachment_98996" align="aligncenter" width="700"]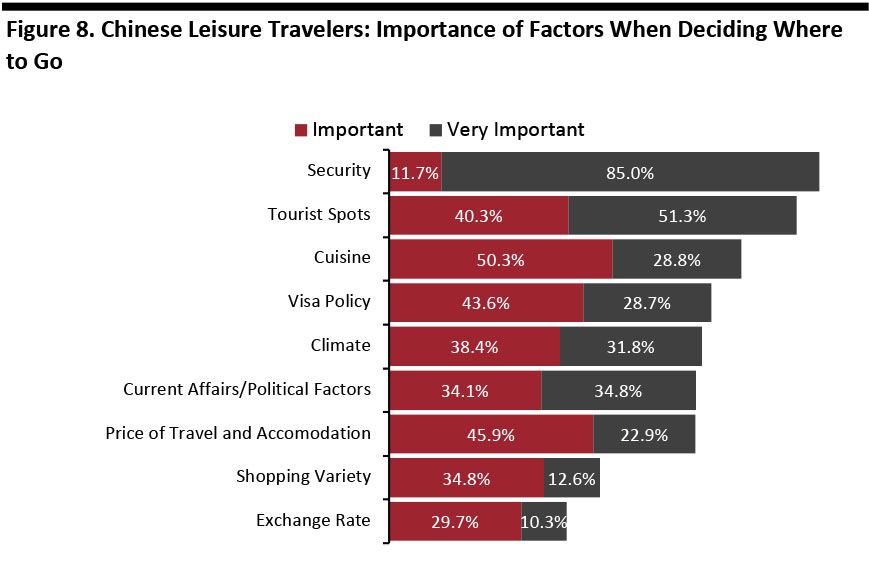 Base: 871 Internet users who had taken a leisure trip outside Mainland China in the past 12 months
 Source: Coresight Research [/caption] Although Chinese travelers typically spend big on shopping when they travel, survey respondents ranked the exchange rate as the least important factor when deciding on a travel destination. This option ranked as the least important factor in our 2018 survey, too. While exchange rates may not be a major factor in deciding where to go, it does impact spend once travelers arrive as they convert local-currency prices into renminbi. The importance of shopping variety in influencing choice of destination increased year over year, from 42% to 47.4% – even though respondents said they spent less per trip this year than last year. The 97% of respondents citing security as important or very important was in line with the results of last year’s survey. Noteworthy, the importance of current affairs/political factors jumped meaningfully year over year from 53.8% to 68.9% and became the third most important factor.
How They Spend: A Slight Decline in Retail Spending per Trip
[caption id="attachment_98997" align="aligncenter" width="700"]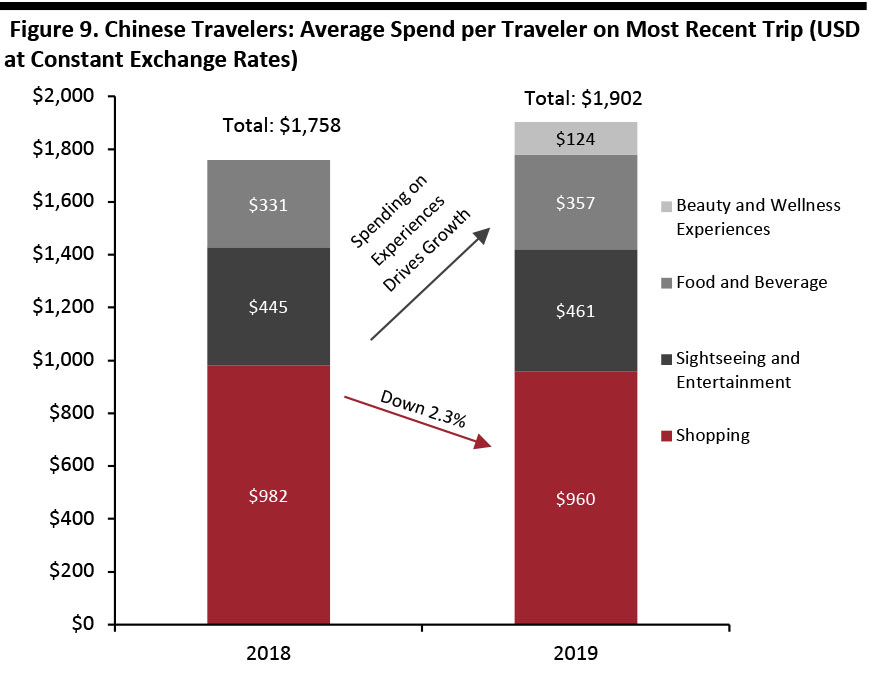 Data for both years was calculated using exchange rates for the period September 1, 2019-August 30, 2019. The Beauty and Wellness Experiences category was added as an option in the 2019 survey.
 Source: Coresight Research [/caption] A major finding of our survey is that Chinese travelers cut their average shopping spend per trip, by 2.3%, in the last year. Our survey found that total per trip spending across shopping, sightseeing and entertainment, food and beverages and beauty and wellness was $1,902. Because we included beauty and wellness experiences as an option for the first time this year, the totals shown above are not directly comparable. Excluding beauty and wellness experiences for comparability with 2018, average per trip spending was up 1.1%, driven by spending on experiences. [caption id="attachment_98998" align="aligncenter" width="700"]
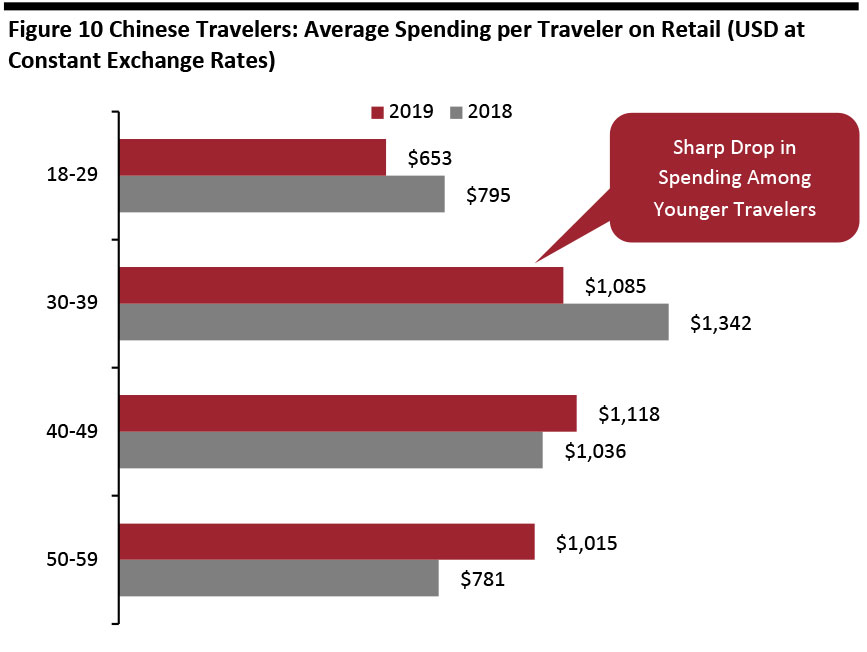 Data for both years was calculated using exchange rates for the period September 1, 2019-August 30, 2019.
 Source: Coresight Research [/caption] Average retail spending was down 2.3% to $960 (¥6,577) per trip, driven by a 19.2% decrease in spending from travelers age 30-39, in addition to a 17.9% decline among travelers aged 18-29. Additionally, travelers aged 50-59 spent 55.5% more than travelers aged 18-29, and their spending increased 29.8% year over year. Travelers from tier-one cities also spent 9.3% more than their peers in lower-tier cities, and their spending was up 11.4% year over year. Last year, older travelers spent less than did younger travelers and tier-one travelers less than did travelers from lower-tier cities. We think a number of factors contributed to the decline in reported spending on shopping:
- Chinese consumers are actively looking for good deals. The depreciation of the renminbi against the US dollar, Hong Kong dollar, Thai baht, Japanese yen and Singapore dollar made buying those goods abroad less appealing for younger consumers since they are more price-sensitive.
- A more experienced body of travelers shifted some spending from goods to services and experiences.
- Younger consumers are taking advantage of easier cross-border e-commerce and opening of more luxury brand stores in China, reducing the need to buy these products when overseas.
- Volatility on the Chinese stock markets and trade dispute uncertainty may have also adversely affected discretionary spending overseas.
- E-commerce platforms also attract travelers with fast delivery services, making it practical for Chinese travelers to order and receive goods online while traveling abroad.
What They Buy
[caption id="attachment_98999" align="aligncenter" width="700"]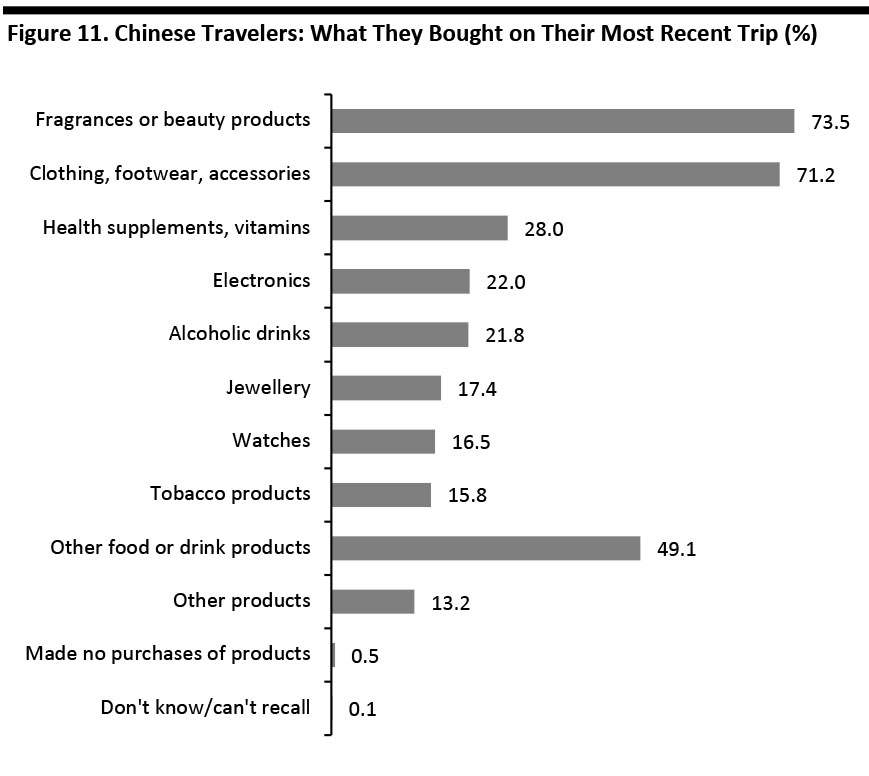 Base: 900 Internet users who had taken a trip outside Mainland China in the past 12 months
 Source: Coresight Research [/caption] In this year’s survey, beauty overtook apparel to become the most popular category for overseas purchases. Last year, these two categories were neck and neck in terms of the number of respondents who said that they had bought them during recent trips. [caption id="attachment_99000" align="aligncenter" width="700"]
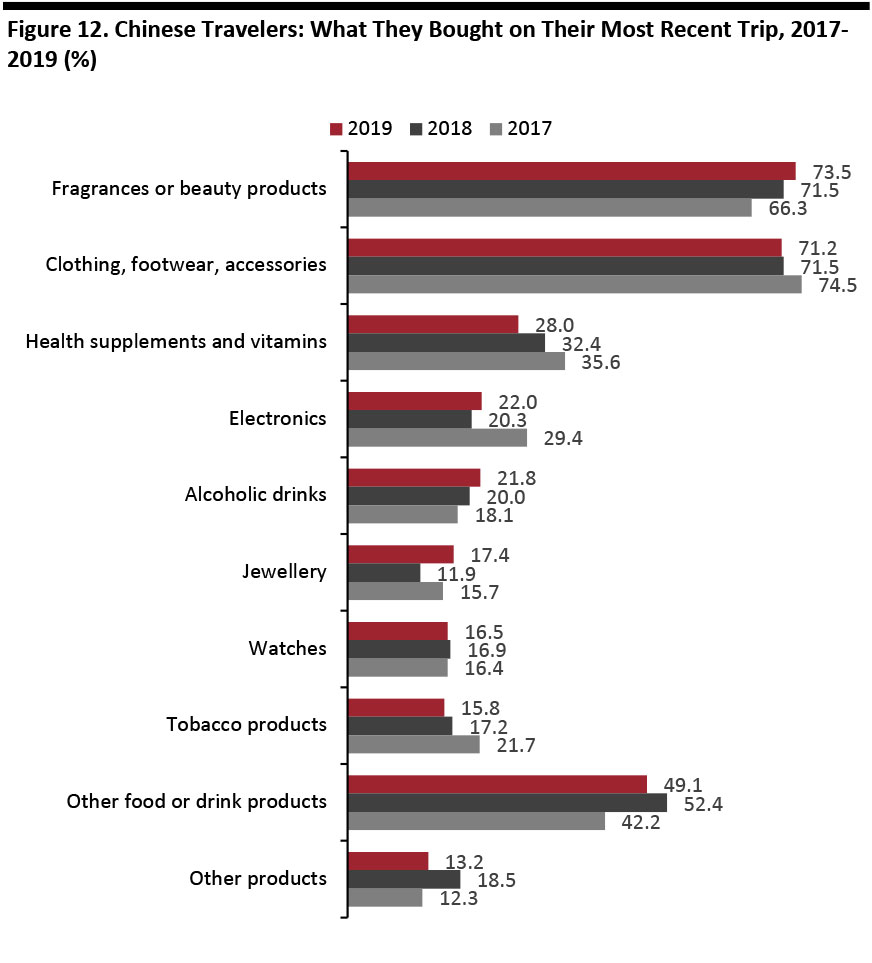 Base: Internet users who had taken a trip outside Mainland China in the past 12 months (900 in 2019, 895 in 2018, 841 in 2017)
 Source: Coresight Research [/caption] When we compare data from our three most recent annual surveys, we see consistent increases in the popularity of beauty/fragrance and alcoholic drinks purchases, and consistent declines in the proportion of travelers buying health supplements/vitamins and tobacco products.
Shops They Buy From: Outlet Continues to Lose Share
[caption id="attachment_99001" align="aligncenter" width="700"]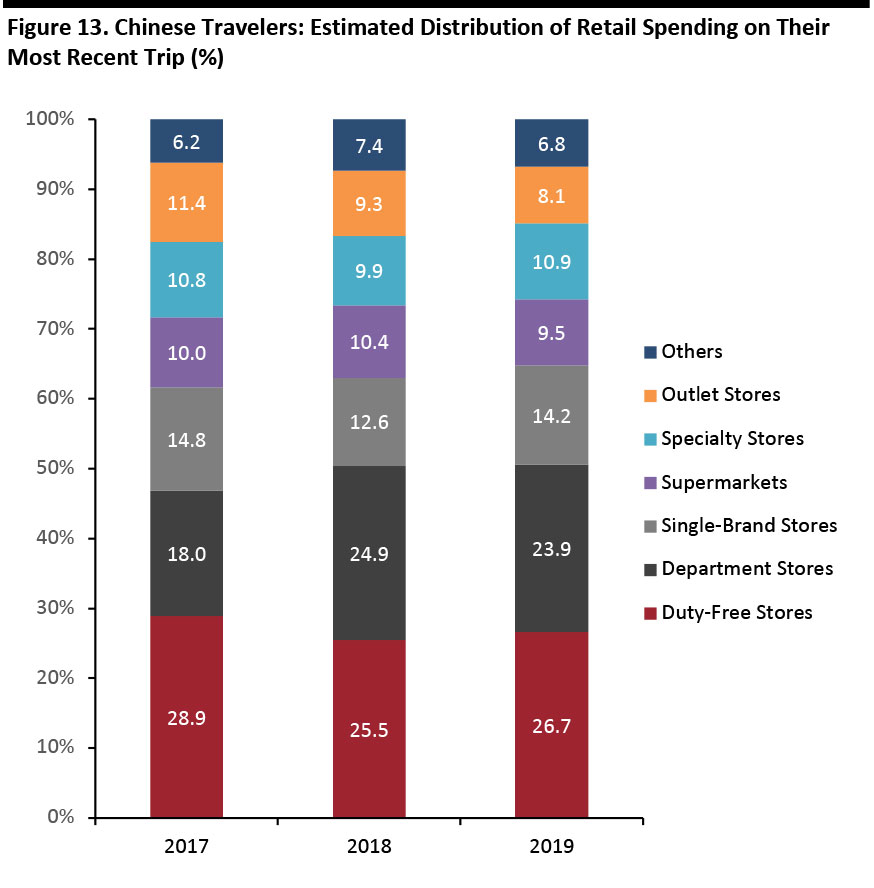 Totals may not sum due to rounding
 Base: Internet users who had taken a trip outside Mainland China in the past 12 months (900 in 2019, 895 in 2018, 841 in 2017)
Source: Coresight Research [/caption] Our survey found duty-free stores were again the top format for overseas shopping among Chinese outbound travelers. The format gained more share of spending year over year than the decline in department store share, reversing the declining trend we witnessed in the past few years. Some of the changes in the types of stores respondents frequented may be due to shifts in travel destinations. For example, trips to the US were down versus the previous year, while trips to Malaysia, Thailand and Singapore were up. That said, the change in destination of choice may have simply compounded changes that were already underway. For example, our annual surveys have recorded consistent year-over-year declines in outlet store share of spend. Two years ago, outlet stores captured 11.4% of Chinese travelers’ spending, but that fell to 9.3% last year and 8.1% this year. We think better-informed consumers are more selective and informed about their purchases, making them less interested in outlets and department stores and more interested in specialty and single-brand stores, possibly for exclusive or specific products. The trend of independent travel also has a negative impact on outlet shopping: Many outlet stores are located in suburban areas, making it inconvenient for independent travelers to visit (not a problem for those on a tour bus). The depreciation of the renminbi against the US dollar and some other currencies makes deals in outlet stores less attractive. In addition, as more people travel, they are less likely to buy things on behalf of friends or family, impacting department store sales. To keep up, many retailers are marketing themselves better to Chinese consumers, such as through WeChat, and adding enhanced services, such as UnionPay or mobile payment options and immediate discounts for international travelers.
Luxury Spending Plans Suggest Beauty Buoyancy
[caption id="attachment_99002" align="aligncenter" width="700"]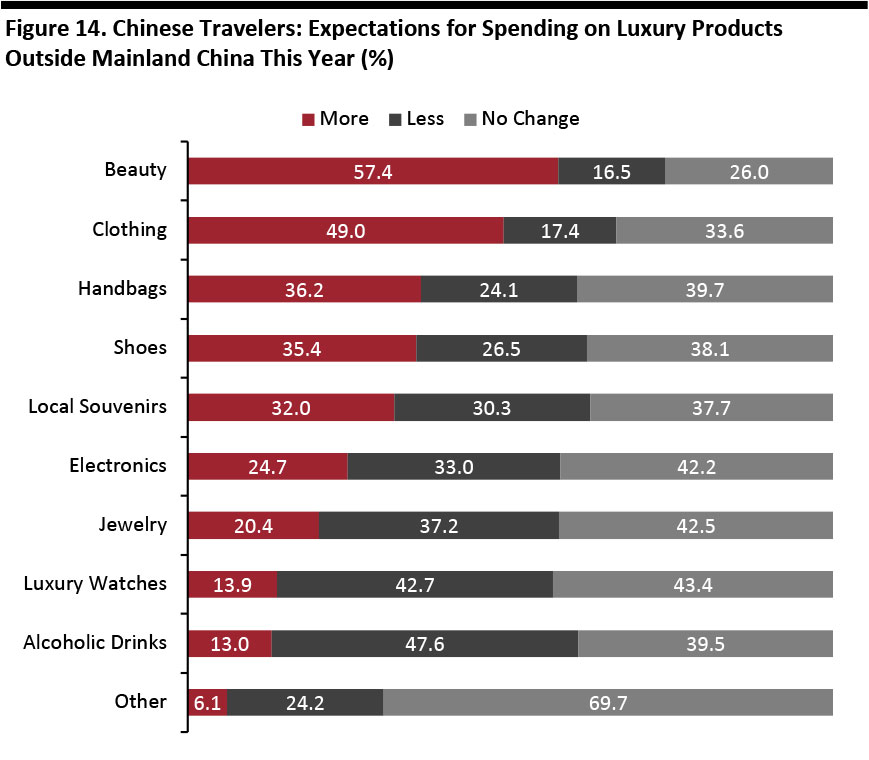 Totals may not sum due to rounding
 Base: 654 Internet users aged 18+ who had taken a trip outside Mainland China in the past 12 months and who expect to travel overseas again before the end of 2018
Source: Coresight Research [/caption] We asked those survey respondents who expect to travel overseas again in the coming months (“e.g., before the end of the year,” per our survey) how their overseas spending on luxury goods categories would likely change. The data suggests that the beauty category will continue to be the big winner, with an 18.4-percentage-point lead over clothing for expectations of spending more this year. In aggregate, respondents indicated an intention to cut back on overseas purchases of hard luxury goods (jewelry and watches): almost half expect to spend less on such items, while only 20.4% expect to spend more on jewelry and 13.9% expect to spend more on watches. We show the net positive/negative results for each category below. [caption id="attachment_99003" align="aligncenter" width="700"]
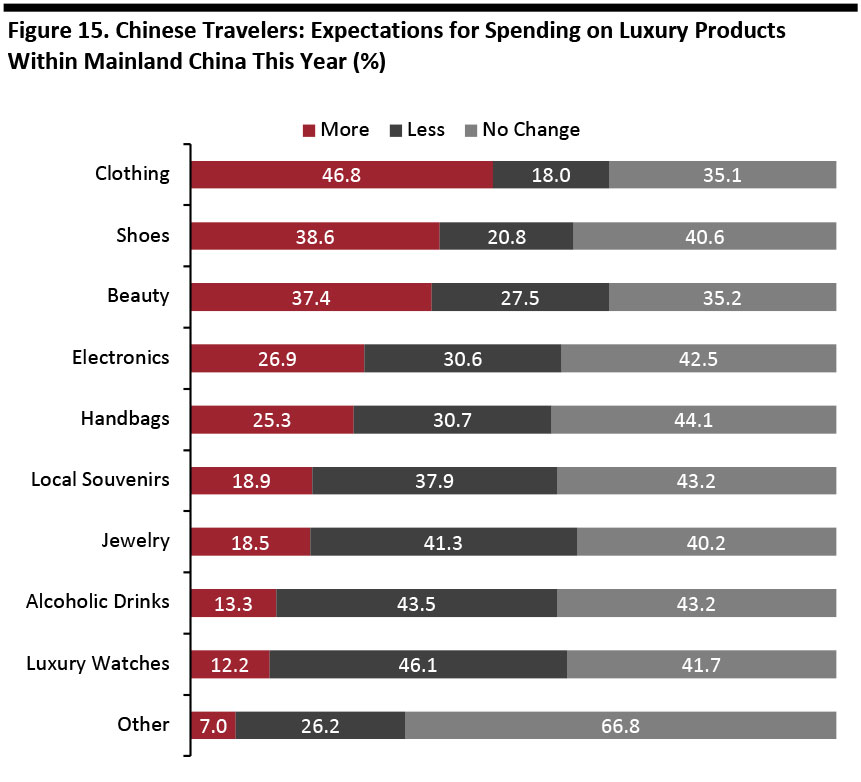 Base: 900 Internet users who had taken a trip outside Mainland China in the past 12 months
 Source: Coresight Research [/caption] We also asked respondents what luxury goods they expected to buy within China in the coming months. The findings confirm that beauty overindexes on overseas purchases versus in-country purchases: The category is in first place in terms of expected higher overseas spending, but falls to third place in terms of expected higher domestic spending. As with overseas purchases, many more survey respondents expect to spend less on jewelry, alcoholic drinks and watches within China in the coming months than expect to spend more. [caption id="attachment_99004" align="aligncenter" width="700"]
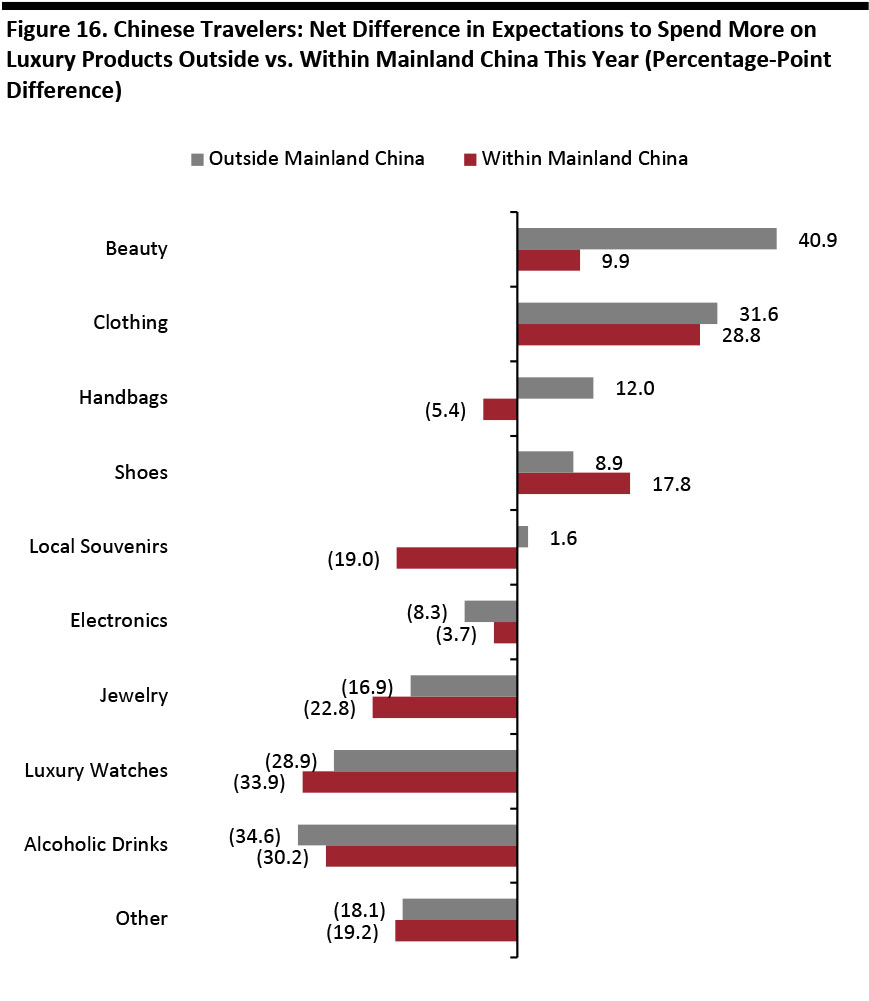 Base: 900 Internet users ages 18+ who had taken a trip outside Mainland China in the past 12 months, including 654 who expect to travel overseas again before the end of 2019
 Source: Coresight Research [/caption] The chart above shows the net difference in the proportion of respondents expecting to spend more on each category in the coming months, split by overseas and within Mainland China. It illustrates the resilience of overseas beauty demand, which suggests that the expansion of cross-border e-commerce is not notably dampening Chinese consumers’ enthusiasm for shopping for beauty items while traveling abroad. The data shows anticipated declines in both domestic and overseas purchases of hard luxury goods, alcoholic drinks and electronics in the coming months.
Services Considered Important and Services Used
[caption id="attachment_99005" align="aligncenter" width="700"]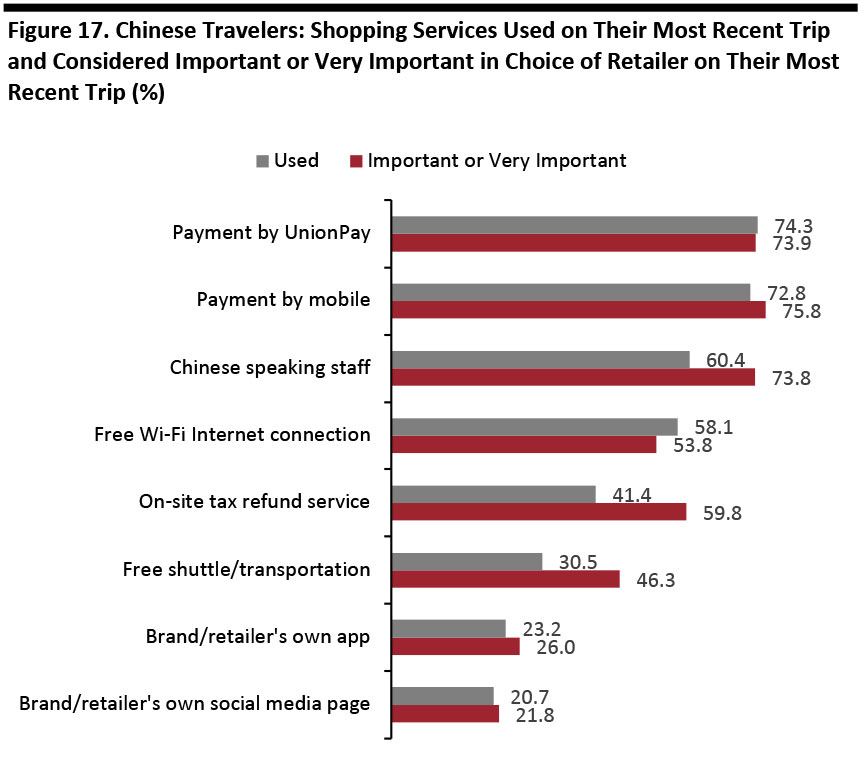 Base: 900 Internet users who had taken a trip outside Mainland China in the past 12 months
 Source: Coresight Research [/caption] Payment options and Chinese-speaking staff are the most-used and most-desired shopping services among Chinese travelers we surveyed. Mobile payment has become the second most important service, driven by its high penetration in China, while the importance of free Wi-Fi slid slightly, from 57.6% to 53.8%. Survey results showed there is a gap between use and importance of Chinese-speaking staff, on-site tax-refund services and free shuttle or transportation, which suggests that there are opportunities for more retailers to provide these services – which could help more effectively reach the rising number of independent travelers. [caption id="attachment_99006" align="aligncenter" width="700"]
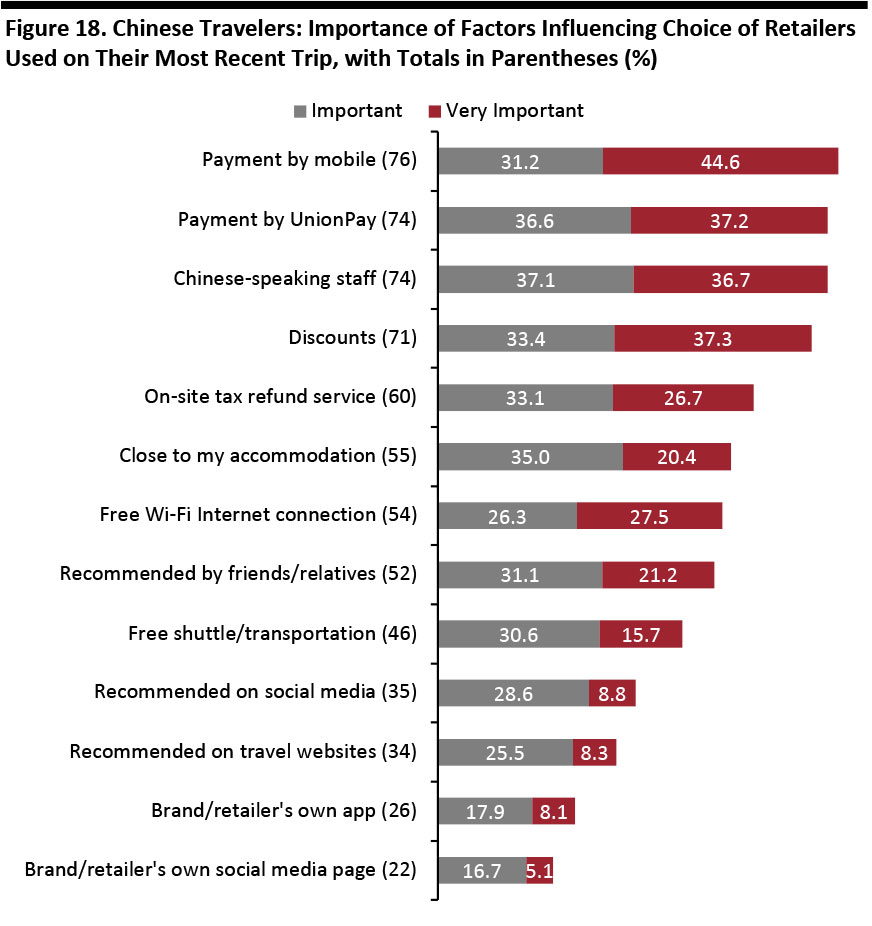 Base: 900 Internet users who had taken a trip outside Mainland China in the past 12 months
 Source: Coresight Research [/caption] Among factors influencing where Chinese travelers shop, the ability to pay by mobile became the most important factor in this year’s survey, up from third-place last year. Services that reduce friction or lower costs for independent tourists are also considered important. Social media recommendations, along with a brand or retailers’ app and social media, ranked as the least important factor influencing respondents’ decisions on where to shop. [caption id="attachment_99007" align="aligncenter" width="700"]
 Base: 900 Internet users who had taken a trip outside Mainland China in the past 12 months
 Source: Coresight Research [/caption] Chinese consumers rely heavily on their smartphones when traveling, especially to search for information. High percentages of respondents said that they had used their phone to find maps and to search for food and shopping destinations on their most recent trip abroad. And a sizeable 45.6% of those surveyed said that they had used their phone to compare prices abroad with those in China. [caption id="attachment_99008" align="aligncenter" width="700"]
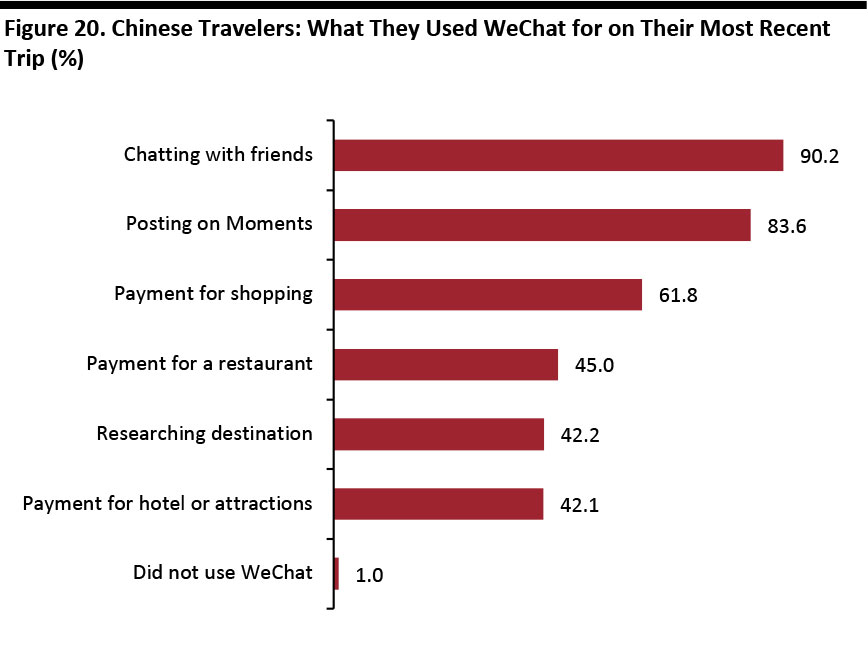 Base: 900 Internet users who had taken a trip outside Mainland China in the past 12 months
 Source: Coresight Research [/caption] More than 99% of survey respondents said they used WeChat on their latest trip overseas: Shopping and posting updates dominated usage. Almost two-thirds of those surveyed said they had used WeChat to pay when shopping and nearly half said they had used it to pay at a restaurant. WeChat continues to roll out payment services to retailers in Western countries including the US and the UK, and we expect to see more major retailers in tourist hot spots sign up to offer payment by WeChat.
How They Travel
[caption id="attachment_99009" align="aligncenter" width="700"]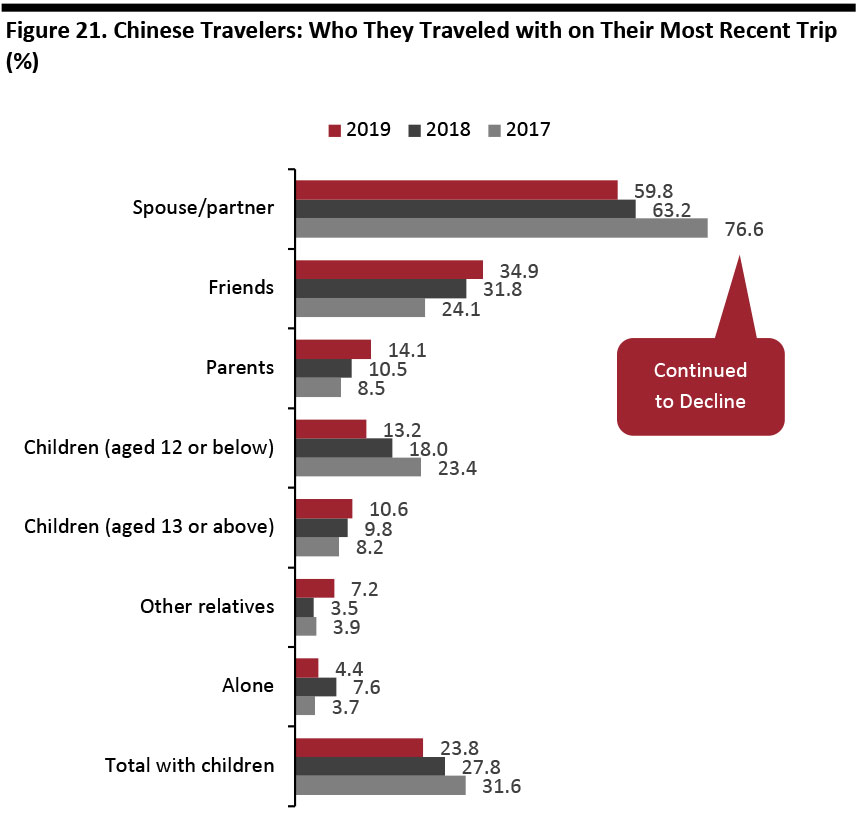 Base: Internet users who had taken a leisure trip outside Mainland China in the past 12 months (871 in 2019, 853 in 2018 and 733 in 2017)
 Source: Coresight Research [/caption] Our survey suggests that there has been an increase in the number of Chinese travelers going overseas with friends and parents, yet a decline in the number traveling in traditional family groups, i.e., with a spouse/partner and children. The number of solo travelers decreased a lot, while traveling with other relatives increased significantly. Residents of non-tier one cities and younger age groups led the shift away from traveling with a spouse/partner and toward traveling with friends. [caption id="attachment_99010" align="aligncenter" width="700"]
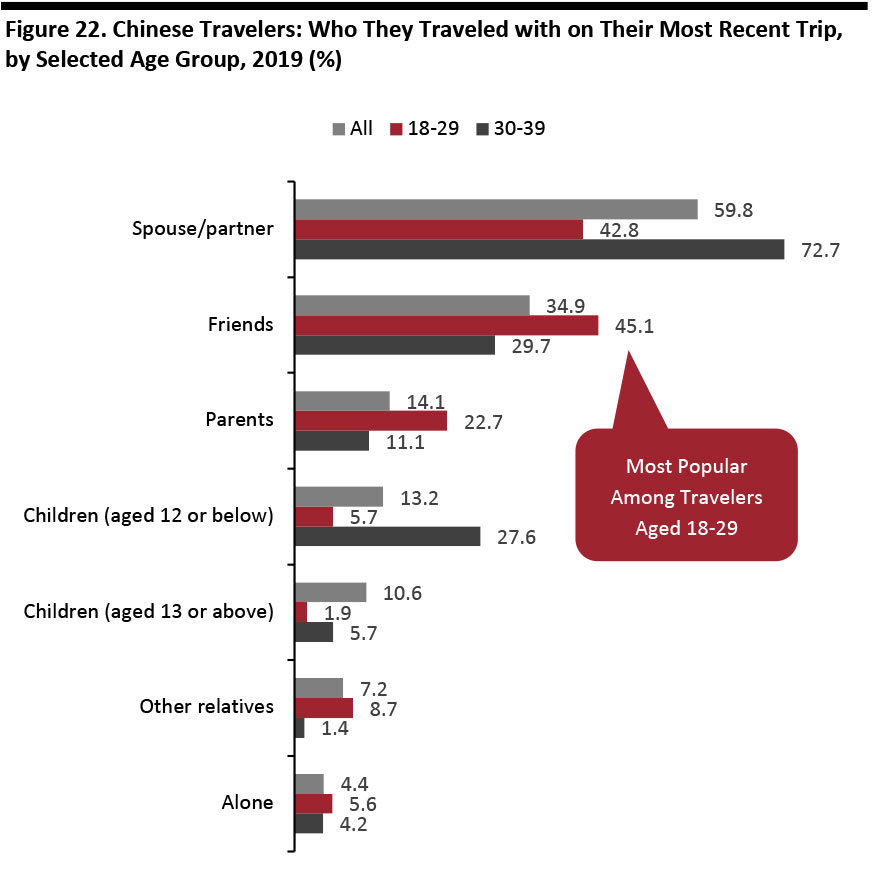 Base: 871 Internet users who had taken a leisure trip outside Mainland China in the past 12 months
 Source: Coresight Research [/caption] Chinese travelers aged 18–29 are much more likely than the average traveler to take trips with friends. Traveling with parents also gained share this year: Some 23% of 18-29 year olds surveyed said that they had traveled with friends this year, compared with 15% of those surveyed two years ago. However, many older millennials (in their 30s) will have already established families and so are much more likely to travel with young children and a spouse or partner. [caption id="attachment_99011" align="aligncenter" width="700"]
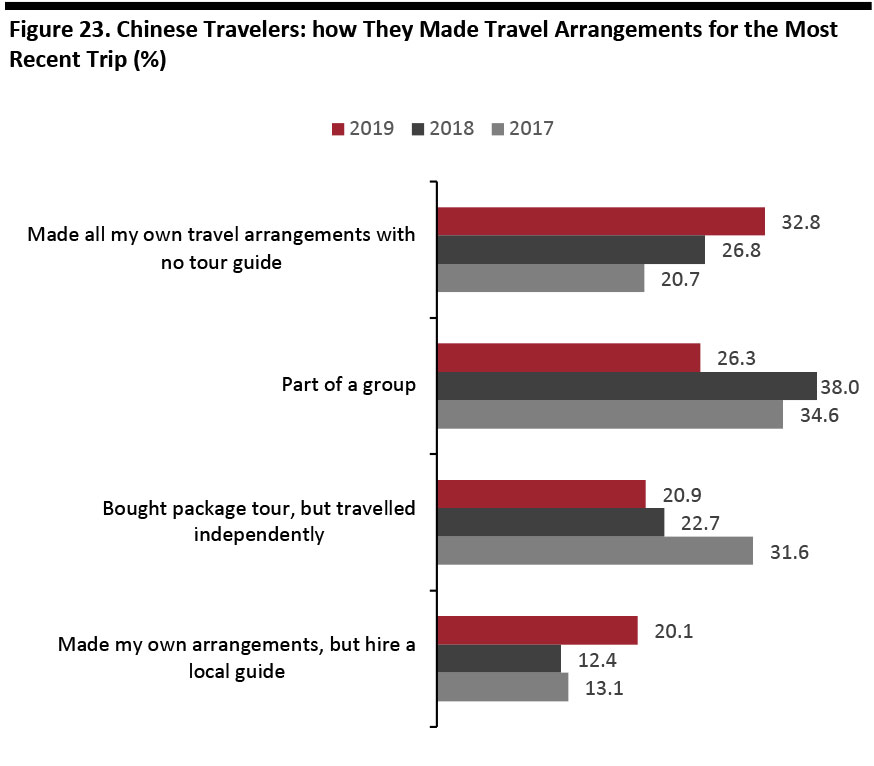 Base: Internet users who had taken a leisure trip outside Mainland China in the past 12 months (871 in 2019, 853 in 2018 and 733 in 2017)
 Source: Coresight Research [/caption] Independent travel options offer greater competition than package tours. Almost one-third of those we surveyed said they traveled independently during their most recent leisure trip, up from around 27% last year, making it the most popular option for Chinese travelers. This year-over-year increase was driven mainly by residents of non-tier one cities. Our latest survey found that traveling in a package tour is still the most popular option among travelers from non-tier one cities: 30% said that they went as part of a group. [caption id="attachment_99012" align="aligncenter" width="700"]
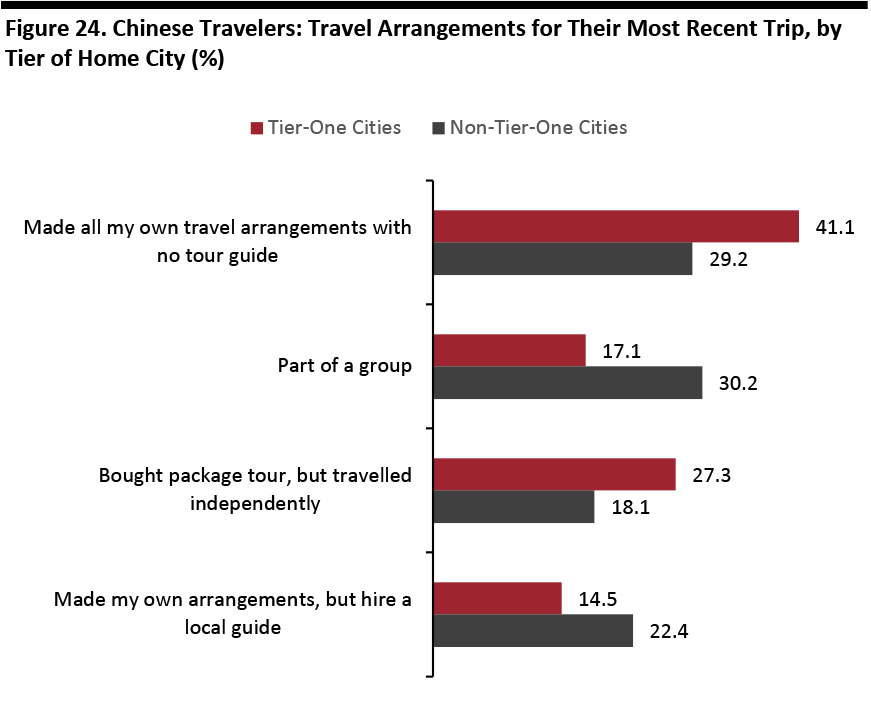 Base: 871 Internet users who had taken a leisure trip outside Mainland China in the past 12 months
 Source: Coresight Research [/caption] Our survey confirms that travelers from tier-one cities are more independent in nature than travelers from lower-tier cities. But middle-class growth is coming more in lower-tier cities now, and these consumers are less experienced international travelers than their tier-one counterparts, but they are catching up. For example, year over year, we saw an eight-percentage-point increase in the number of tourists from non-tier-one cities who made their own travel arrangements and hired a local guide, versus a six-percentage-point increase among those from tier-one cities. We also saw the number of tourists from non-tier-one cities who travel independently without a guide jump almost 11 percentage points, versus a five-percentage-point decline among those from tier-one cities.
Planning The Next Trip
[caption id="attachment_99013" align="aligncenter" width="700"]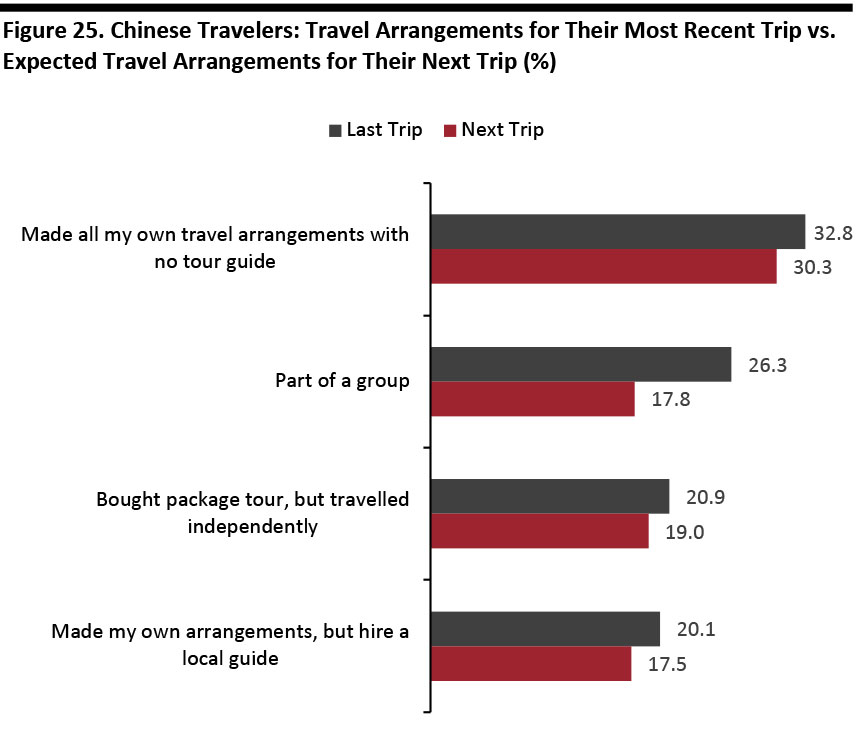 Base: 871 Internet users who had taken a leisure trip outside Mainland China in the past 12 months and 654 Internet users who expect to take a trip outside Mainland China in the coming months, excluding those who answered “Not Decided Yet”
 Source: Coresight Research [/caption] We also asked those respondents who expect to travel again soon about how they are likely to travel on their next trip. The proportion of travelers planning to go on a group trip is down significantly versus those who traveled with a group on their most recent trip. [caption id="attachment_99014" align="aligncenter" width="700"]
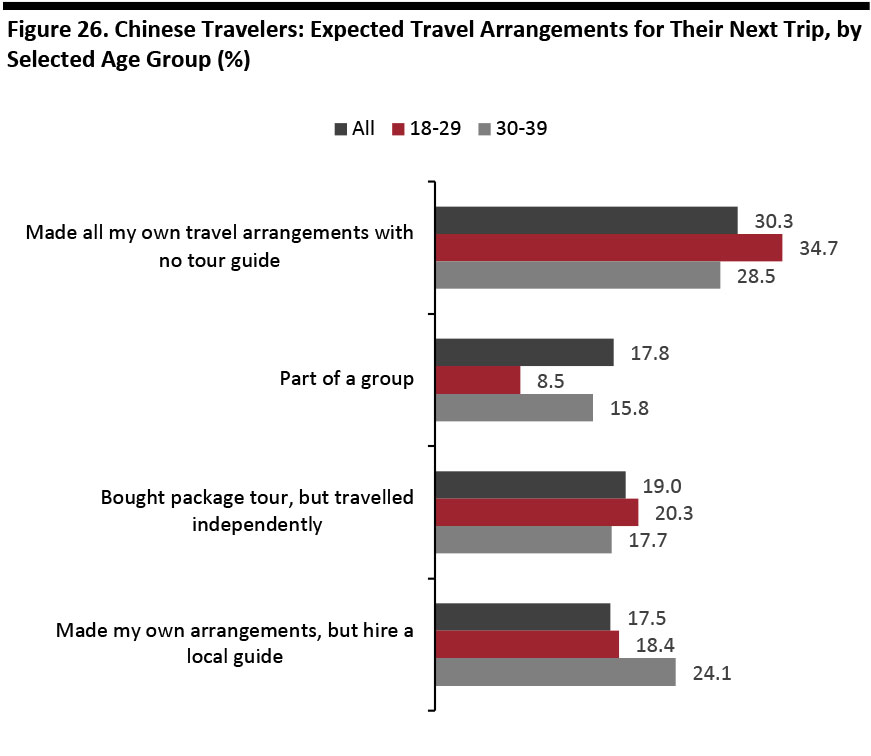 Base: 654 Internet users who expect to take a trip outside Mainland China in the coming months, excluding those who answered “Not Decided Yet”
 Source: Coresight Research [/caption] Younger travelers are much more likely to travel independently, but are also more likely to purchase a package tour and then travel independently than older travelers. For travelers age 30-39, they are more likely to make their own arrangements or hire a local guide. Overall, package tours are the least popular option among travelers age 18-39. [caption id="attachment_99015" align="aligncenter" width="700"]
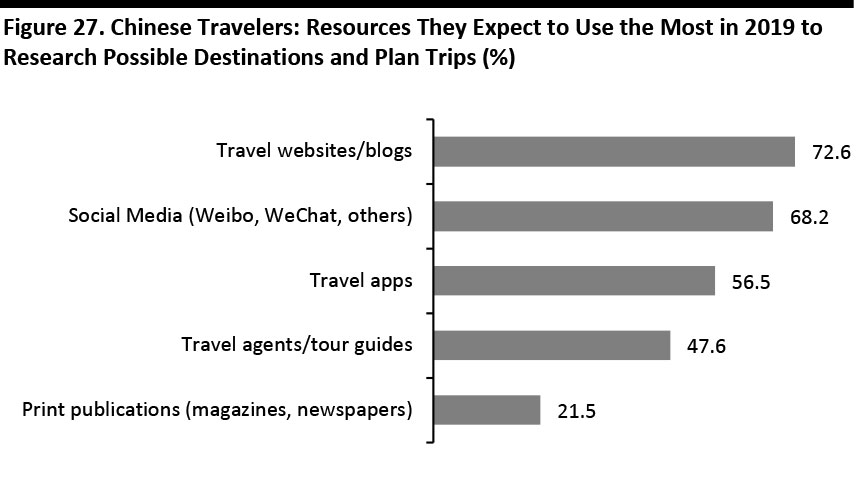 Base: 654 Internet users who expect to take a trip outside Mainland China in the coming months
 Source: Coresight Research [/caption] Similar to last year, online is the leading source of travel information, but the importance of travel websites/blogs decreased from 80.3% to 72.6% this year. Interestingly, travel agents/tour guides and print publications both saw a more than 500 basis points increase, possibly driven by tourists’ need for itinerary ideas.
Key Recommendations
A growing number of Chinese are taking overseas trips, but are spending less on retail and more on experiences. While Chinese travelers will likely still shop for themselves and for their friends and family, their interests and travel patterns are evolving, impacting travel behavior and choice of destination. As the nature of Chinese outbound travel shifts, shopping destinations need to continue to adapt their Chinese consumer strategies. Our top recommendations for the year ahead include:- Review the information about your destination and adjust inappropriate or incorrect verbiage that may cause misunderstandings. Shopping destinations should ensure online information is mobile-friendly, in Chinese and written in the simplified Chinese characters used in Mainland China – and that that information is accessible in both China and the destination country.
- Allocate more resources to cater to independent travelers. Carefully evaluate, adjust and improve facilities and services to remove friction for independent tourists. Launch marketing campaigns that are aligned with the changing nature of the traveler profile. Offering products in smaller packages may also help.
- Prepare for a growing number of tourists, but lower average ticket size. As the number of unique Chinese tourists continues to grow, shopping destinations should expand capacity, increase the variety of choices – but expect a smaller ticket size.
- Highlight exclusive products and experiences that are locally inspired or unavailable in China. As global branded products become more accessible in China, it is increasingly important to offer products or experiences unique to the destination, limited in nature or not available in China, bearing in mind that Chinese tourists love to share experiences on social media. A great experience for the traveler is also a great opportunity to market to all the customer’s social media friends.
- Fully incorporate and leverage WeChat functions. WeChat has become more than just a social media platform. Many retailers and tourist destinations have launched official accounts or mini-sites via the WeChat menu or a WeChat Mini Program functionality. The WeChat app has many features that make it useful for markers, such as its ad-targeting feature and WeChat Pay. With mobile payment being the most important factor in choosing shopping destinations, retailers have to adopt them if they hope to continue to draw Chinese tourists.
Appendix: Exchange Rates
[caption id="attachment_99016" align="aligncenter" width="700"]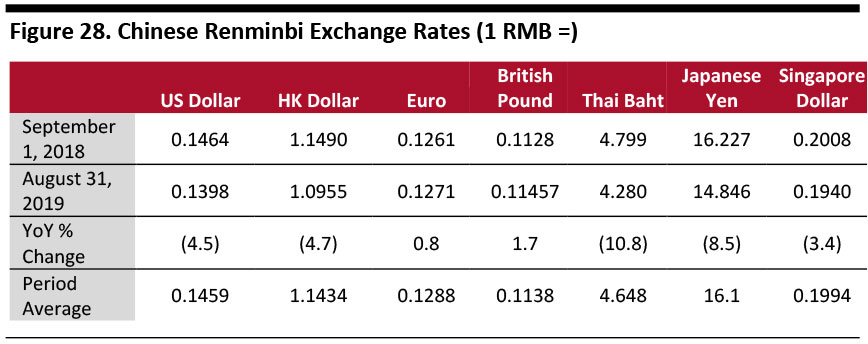 Source: S&P Capital IQ[/caption]
In the year under review, the renminbi was weakened against the US dollar, the Hong Kong dollar (which is pegged to the US dollar), the Thai baht, the Japanese yen and the Singapore dollar.
[caption id="attachment_99017" align="aligncenter" width="700"]
Source: S&P Capital IQ[/caption]
In the year under review, the renminbi was weakened against the US dollar, the Hong Kong dollar (which is pegged to the US dollar), the Thai baht, the Japanese yen and the Singapore dollar.
[caption id="attachment_99017" align="aligncenter" width="700"]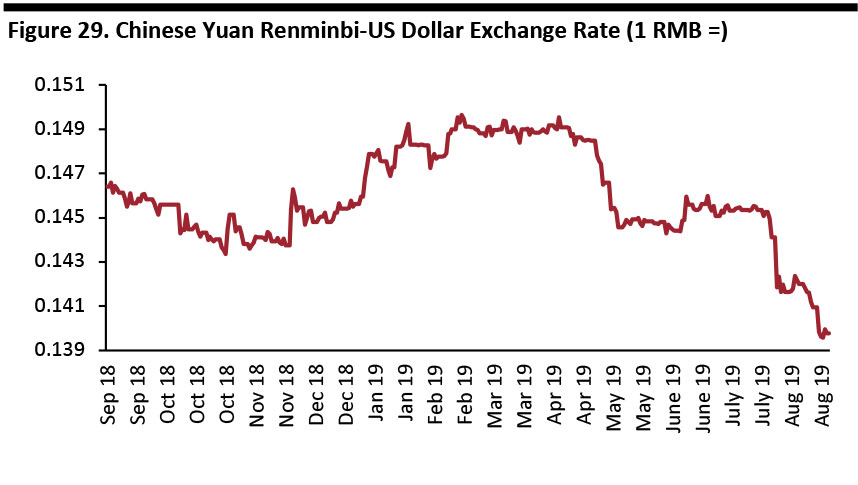 Source: S&P Capital IQ[/caption]
[caption id="attachment_99018" align="aligncenter" width="700"]
Source: S&P Capital IQ[/caption]
[caption id="attachment_99018" align="aligncenter" width="700"]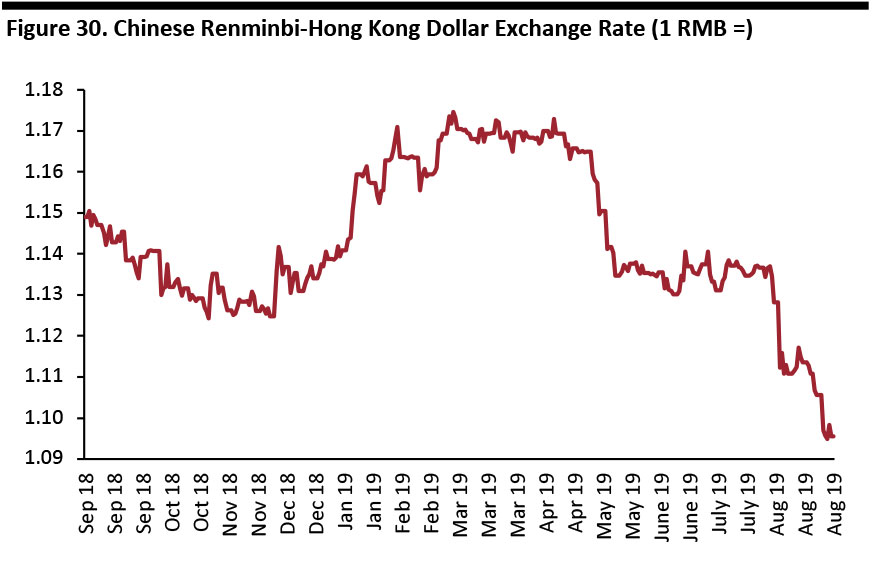 Source: S&P Capital IQ[/caption]
[caption id="attachment_99019" align="aligncenter" width="700"]
Source: S&P Capital IQ[/caption]
[caption id="attachment_99019" align="aligncenter" width="700"]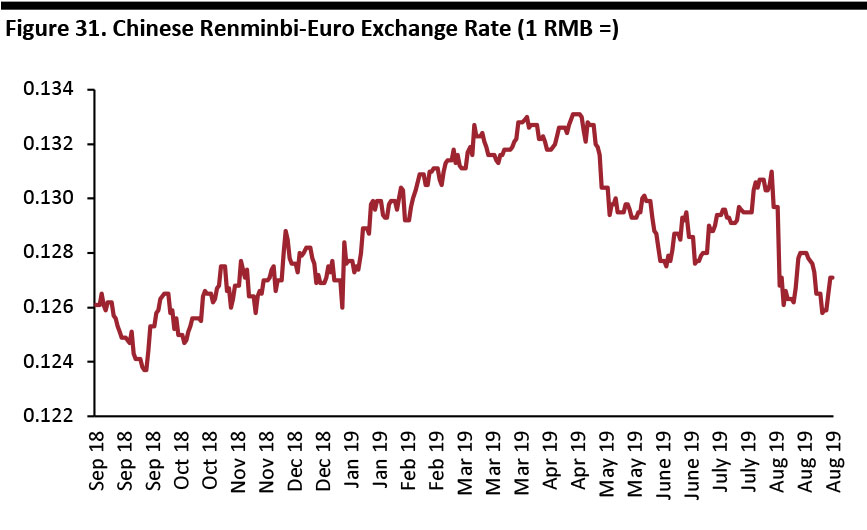 Source: S&P Capital IQ[/caption]
[caption id="attachment_99020" align="aligncenter" width="700"]
Source: S&P Capital IQ[/caption]
[caption id="attachment_99020" align="aligncenter" width="700"]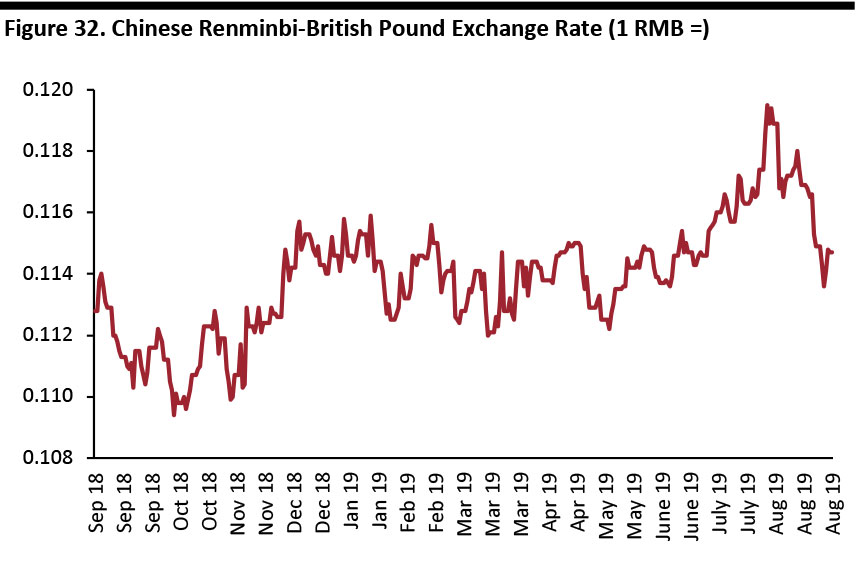 Source: S&P Capital IQ[/caption]
[caption id="attachment_99021" align="aligncenter" width="700"]
Source: S&P Capital IQ[/caption]
[caption id="attachment_99021" align="aligncenter" width="700"]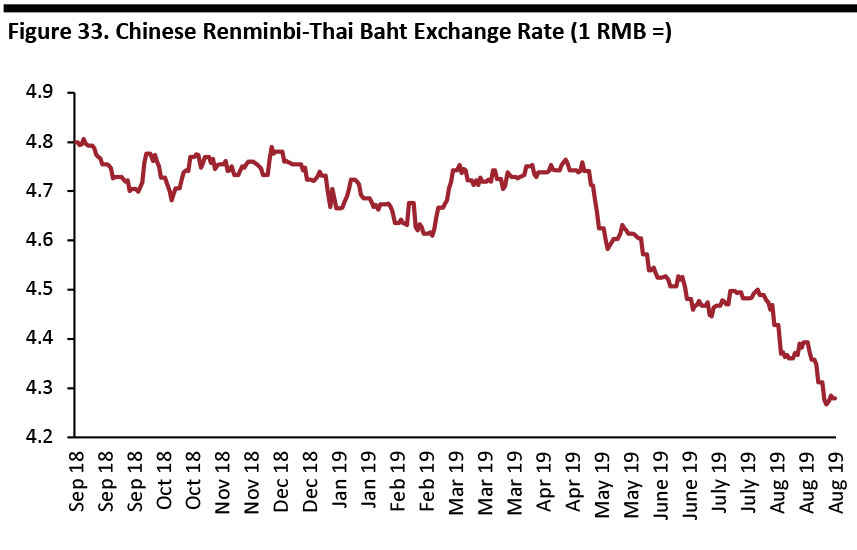 Source: S&P Capital IQ[/caption]
[caption id="attachment_99022" align="aligncenter" width="700"]
Source: S&P Capital IQ[/caption]
[caption id="attachment_99022" align="aligncenter" width="700"]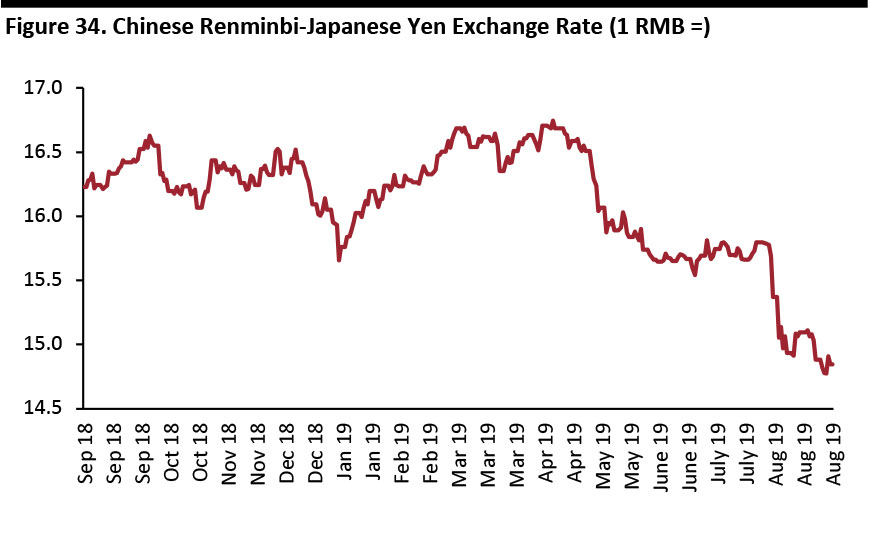 Source: S&P Capital IQ[/caption]
[caption id="attachment_99023" align="aligncenter" width="700"]
Source: S&P Capital IQ[/caption]
[caption id="attachment_99023" align="aligncenter" width="700"]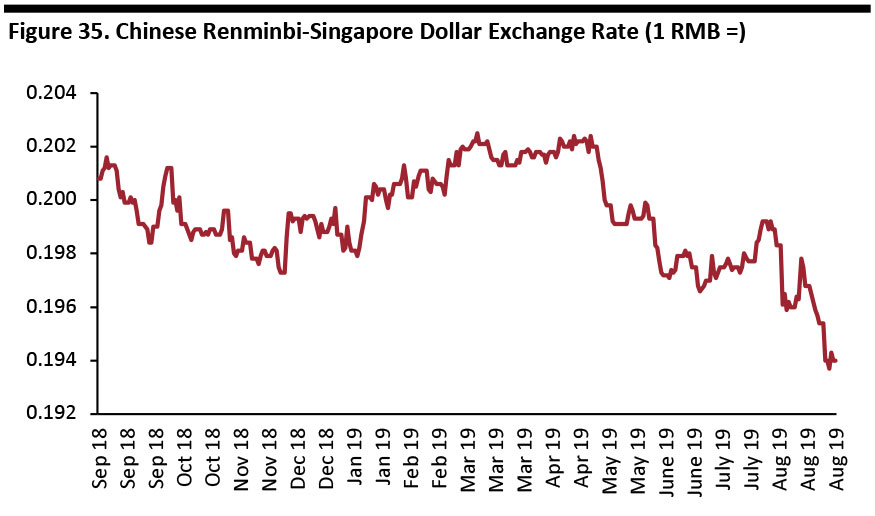 Source: S&P Capital IQ[/caption]