
Web Developers
Americans’ lifestyles have changed significantly over the past five years as various forms of online media have played an increasing role in people’s lives. While time spent viewing live TV has fallen in the US, time spent viewing online streaming services such as Netflix and Hulu has risen. Meanwhile, rapid developments in mobile technology have affected Americans’ shopping preferences and boosted online shopping rates.
Introduction
Daily life for the average American has changed considerably in the past few years, largely driven by technology advancements. In this report, we chart how Americans’ lifestyles have changed in recent years, with an emphasis on their time spent on media interactions and online activities, and their shopping and lifestyle preferences.American Daily Life
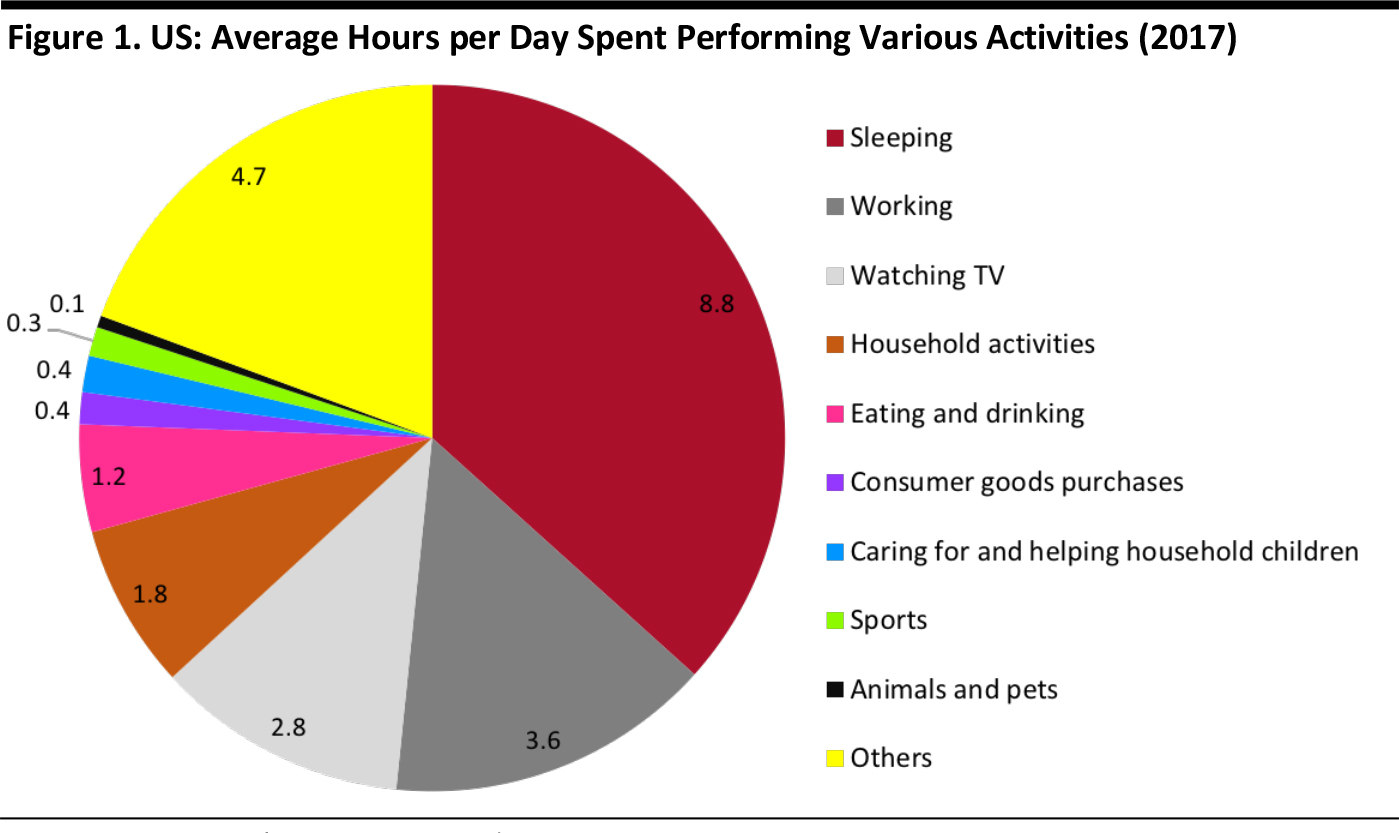
The US Census Bureau has been tracking how Americans spend their time since 2003. The bureau selects sample cases for its survey monthly and conducts interviews continuously throughout the year, surveying approximately 10,200 US citizens age 15 and over. Sleeping, working and eating are the main activities of daily life, and Americans spent an average of 8.8 hours sleeping, 3.6 hours working and 1.2 hours eating each day in 2017. They also spent an average of 2.8 hours watching TV every day, but only 0.3 hours (approximately 18 minutes) participating in sports.
Base: Approximately 10,200 respondents ages 15+ Household children are children under age 18 residing in the household of the respondent. “Others” includes common daily activities such as reading and personal care. Source: US Census Bureau/Coresight Research
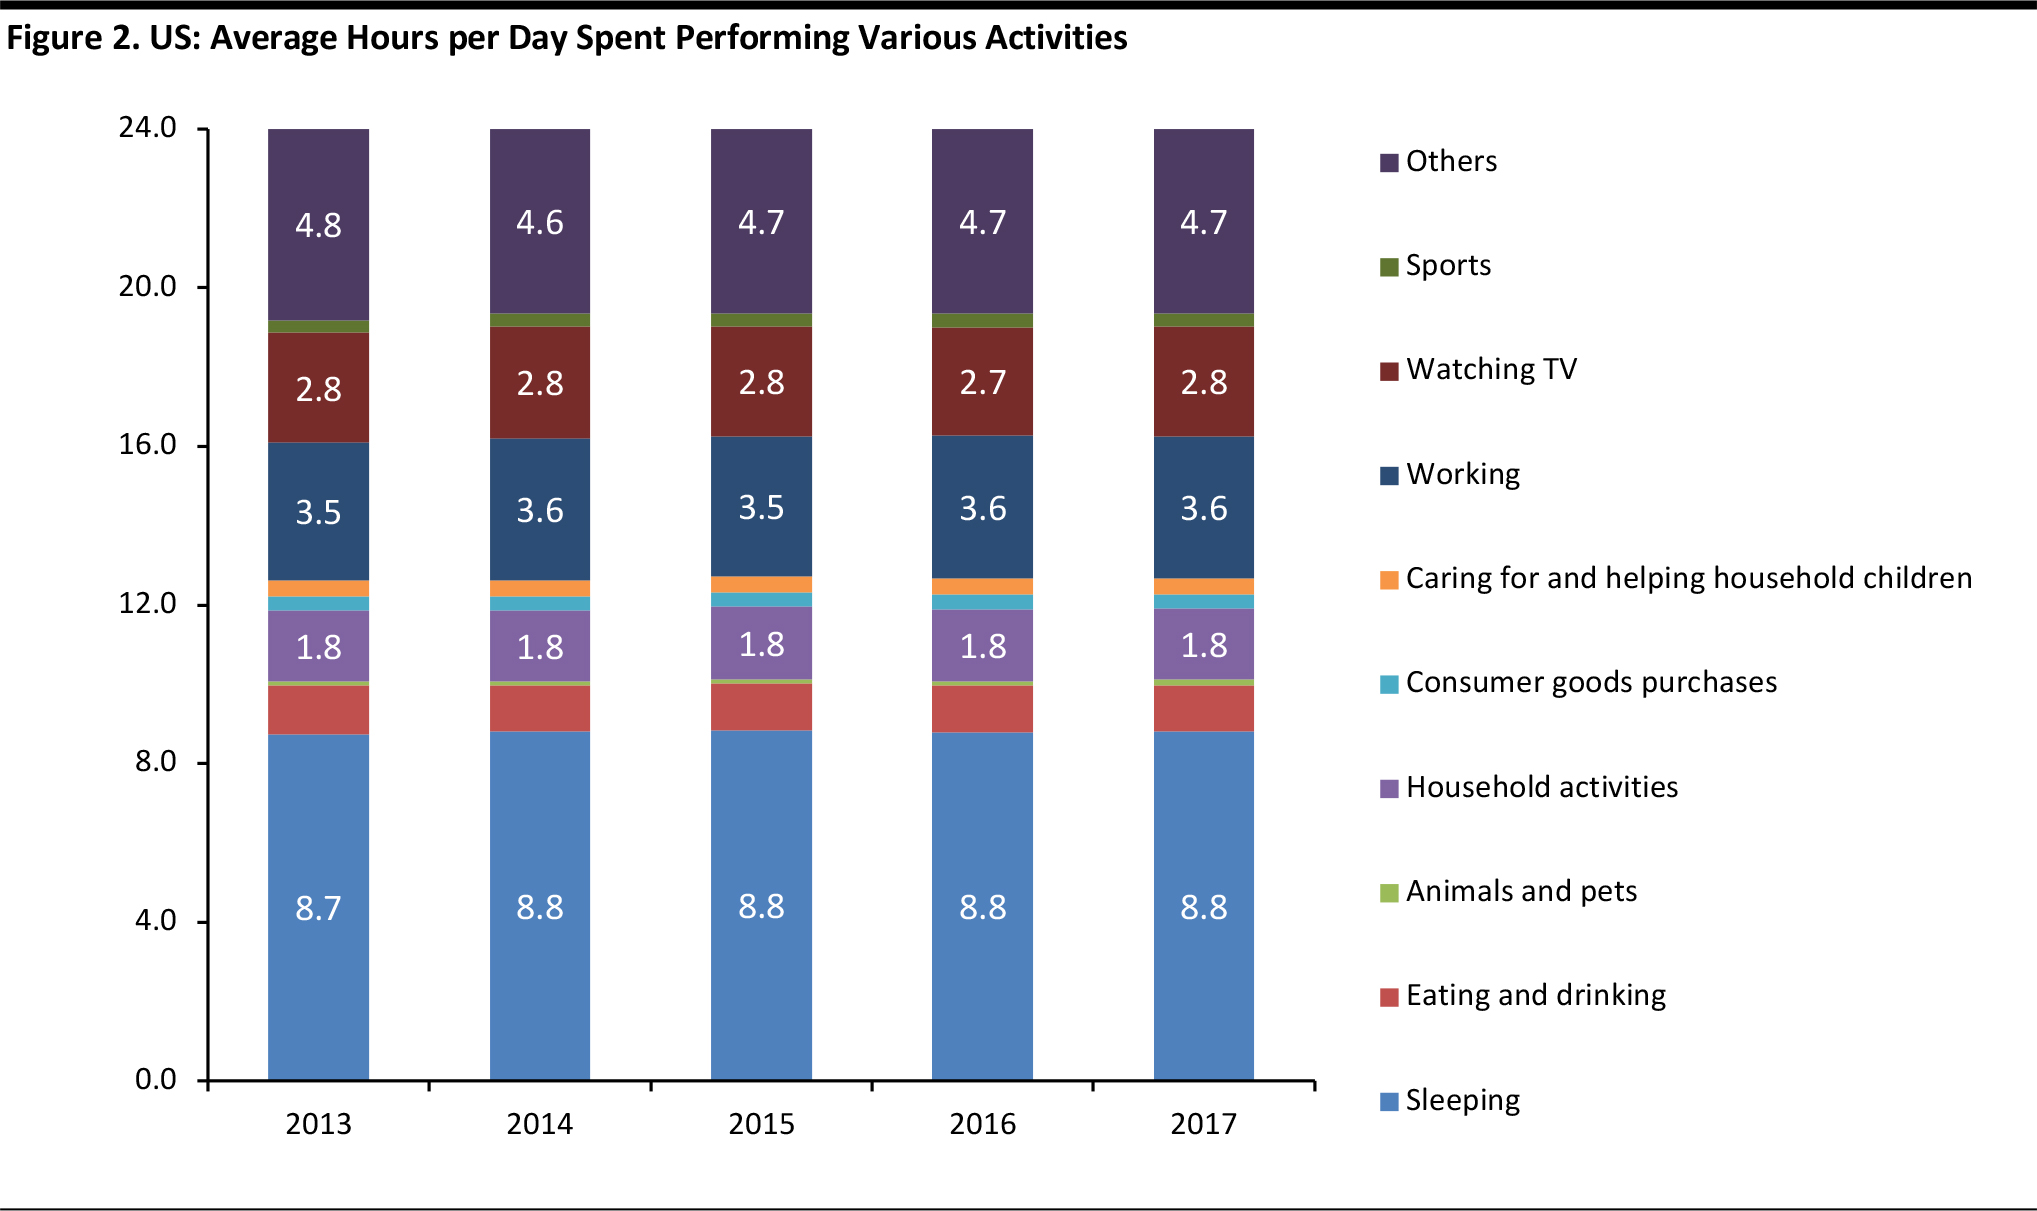
The breakdown of how Americans divide their time each day has been relatively stable over time, as the graph below illustrates. People in the US may be sleeping a few more minutes per day than they were five years ago, but there has been no significant change. However, the Census Bureau survey looks at Americans’ daily life on a holistic level; it does not reflect the activities that people perform simultaneously. For example, if someone is browsing on his or her mobile phone while the TV is running in the background, only the time spent watching TV will be recorded.
Base: Approximately 10,200 respondents ages 15+ Household children are children under age 18 residing in the household of the respondent. “Others” includes common daily activities such as reading and personal care. Source: US Census Bureau/Coresight Research
Media Time
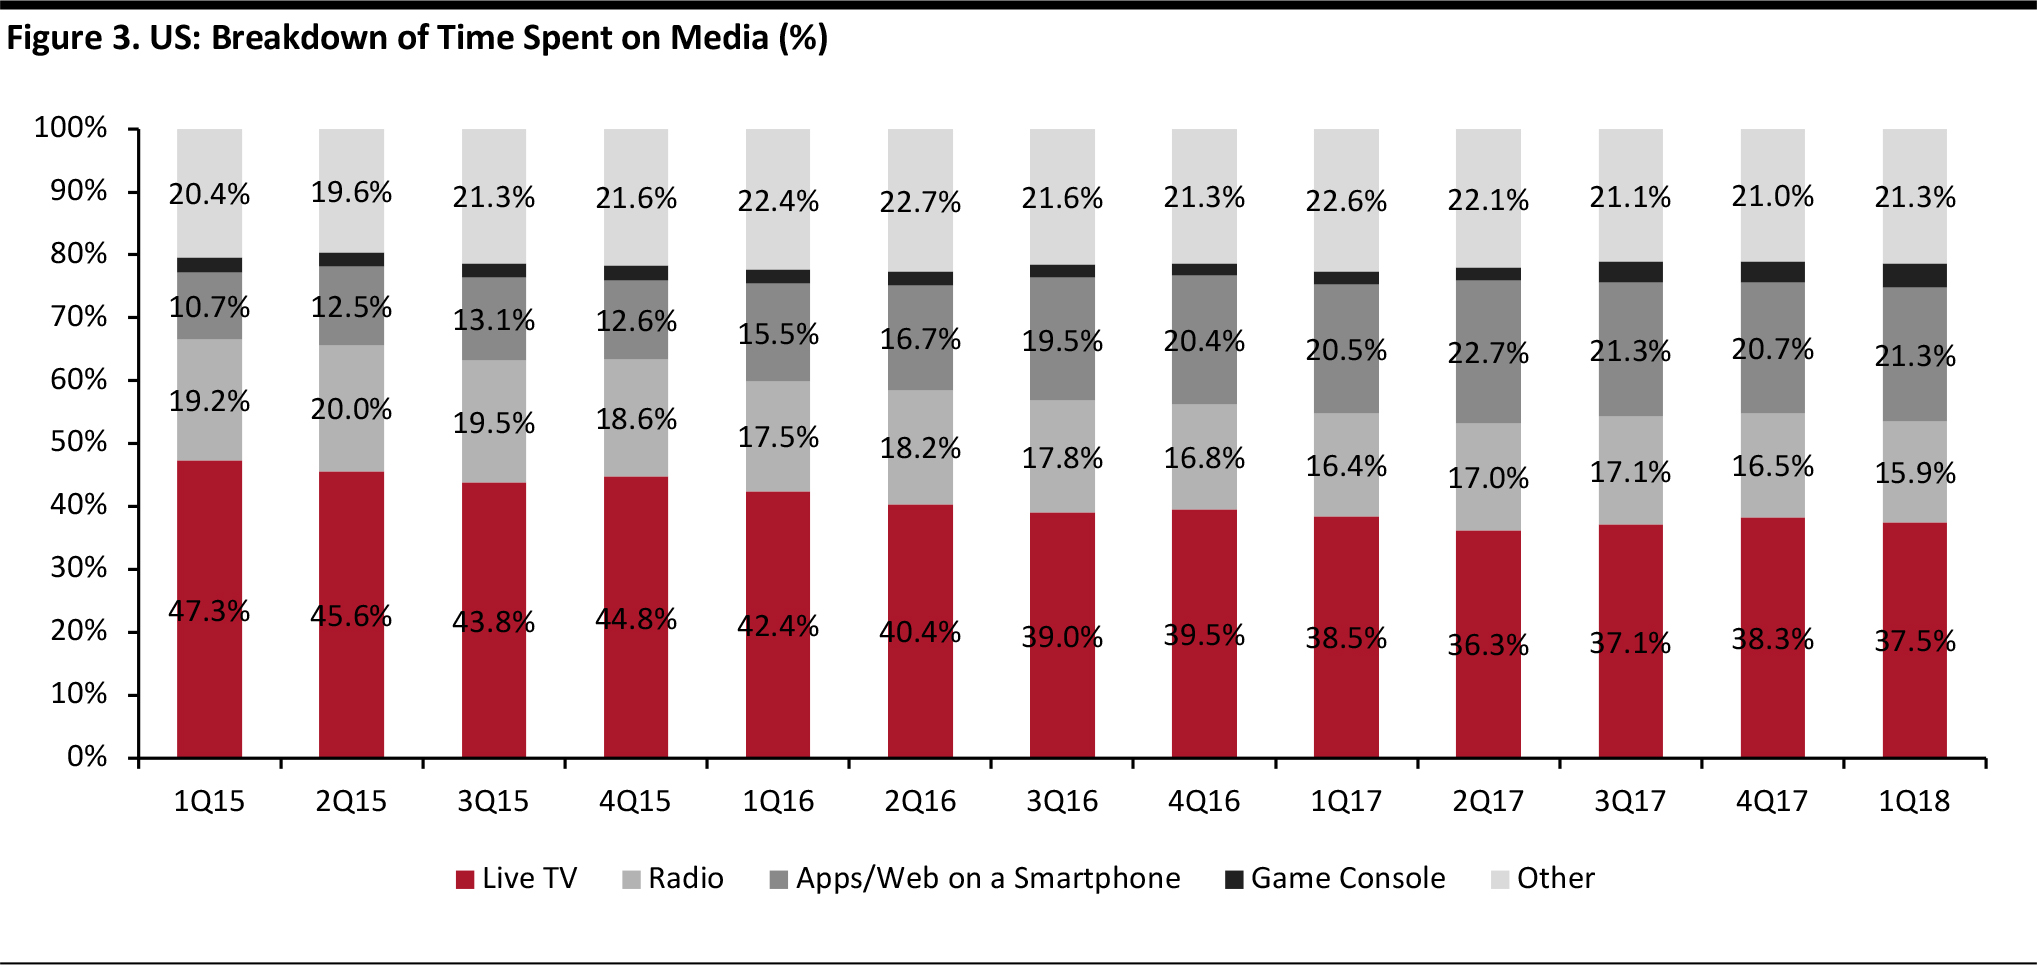
Media plays an important role in Americans’ lives. In the first quarter of 2018, US consumers, on average, spent almost half the day each day using media, according to Nielsen’s Total Audience Report. TV, apps and websites, and radio account for the majority of the time Americans’ spend consuming media. In the first quarter of 2018, live TV accounted for the largest share of Americans’ time spent on media, at 37.5%, followed by apps and websites on smartphones at 21.3%. Radio’s share of Americans’ media time was 15.9% in the first quarter, according to Nielsen’s report. Although live TV accounts for the biggest portion of Americans’ time spent on media, its share has been shrinking over the past three years. Radio’s share has also decreased, perhaps due to the increasing popularity of tablets and large mobile phone screens. The share accounted for by apps and websites on smartphones almost doubled between the first quarter of 2015 and the first quarter of 2018, when it reached 21.3%. In addition, game consoles have gained share of Americans’ daily media time, rising from 2.4% in the first quarter of 2015 to 3.9% in the first quarter of 2018.
“Other” includes DVD, Internet on a desktop computer and DVR/time-shifted TV. Source: Nielsen Total Audience Report
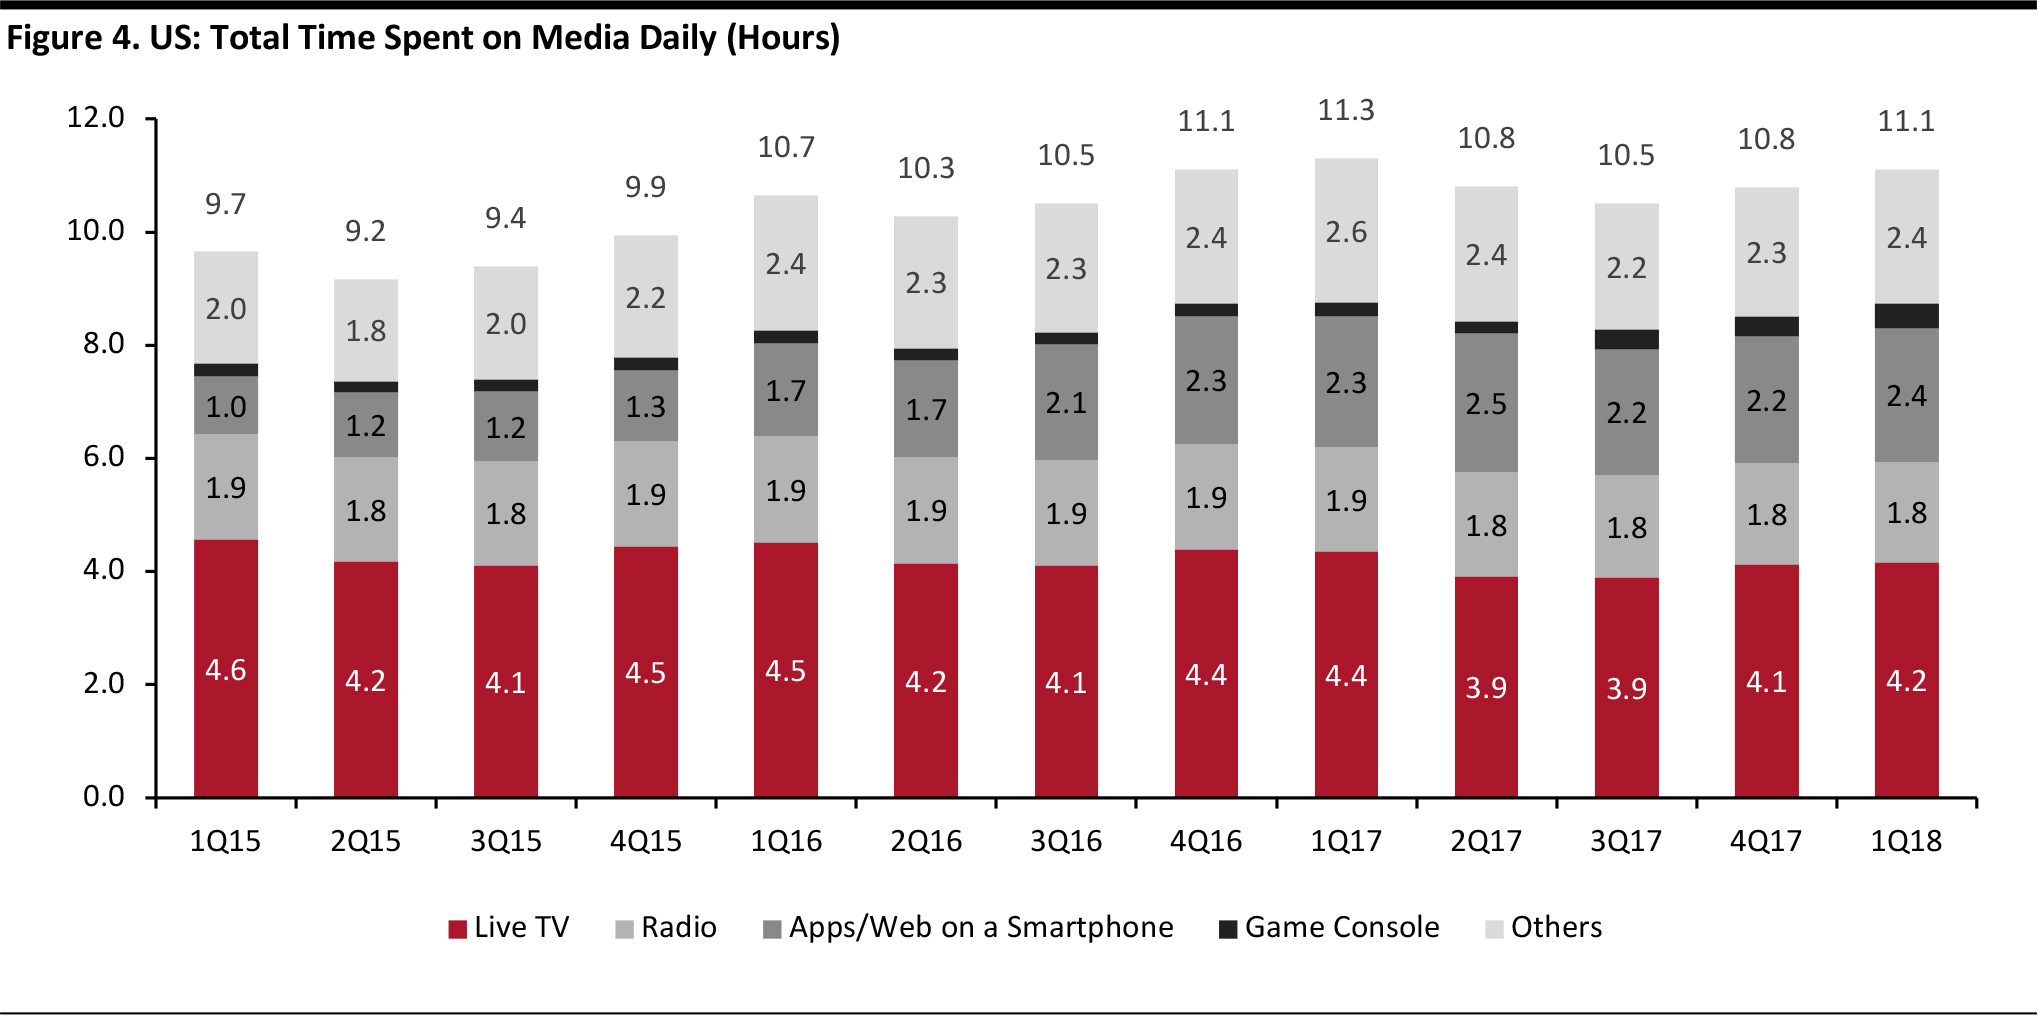
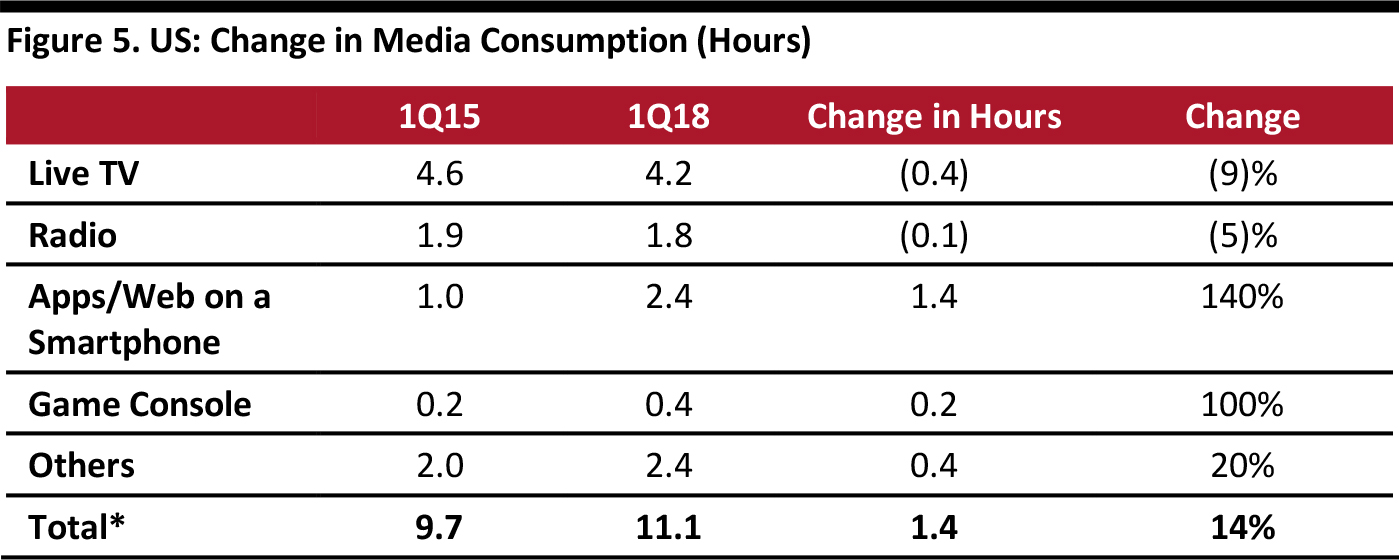
Over recent years, the total time American adults spend daily on media has been on an upward trend, increasing from 9.7 hours in the first quarter of 2015 to 11.1 hours in the first quarter of 2018, according to Nielsen. An increase in the time Americans spend using apps and websites on smartphones has been the biggest driver behind this overall rise. American adults are also spending more time on game consoles, although the time they spend listening to the radio has been relatively stable. Nielsen’s data also show that Americans watched live TV for an average of 4.2 hours per day in the first quarter of 2018, down from 4.6 hours per day in the first quarter of 2015.
Other” includes DVD, Internet on a desktop computer and DVR/time-shifted TV. Source: Nielsen Total Audience Report
The table below compares Americans’ daily media consumption in hours in the first quarter of 2015 and the first quarter of 2018. The total average time spent on media per day increased by 1.4 hours over that period, driven by time spent using apps and websites on a smartphone. Americans spent 2.4 hours per day on smartphone apps and websites in the first quarter of 2018, up 140% from 1.0 hour three years earlier. Time spent on game consoles also increased significantly, rising by an extraordinary 100% over the three-year period.
*Some figures may not sum due to rounding. Source: Nielsen Total Audience Report/Coresight Research
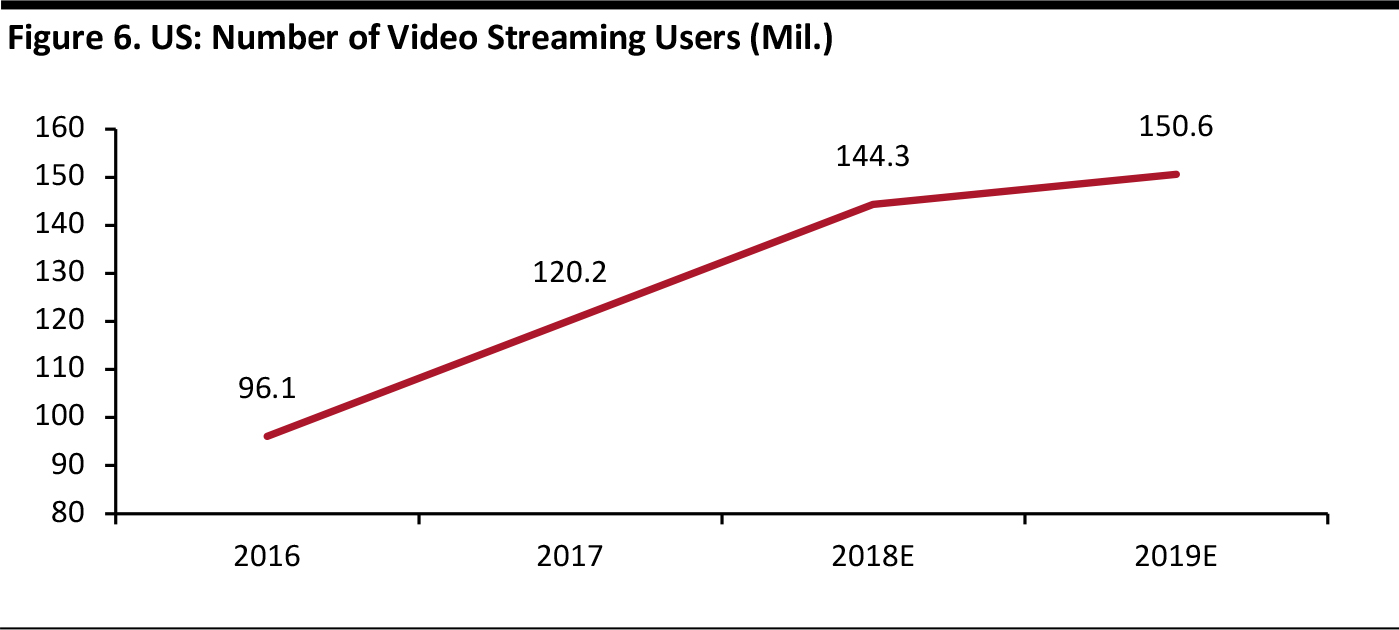
Although Americans are watching less live TV, the number of them watching video streams has been growing significantly. Statista projects that the number video stream viewers will reach 150.6 million next year, up from 96.1 million in 2016. Amazon Prime Video, Hulu and Netflix are major competitors in the streaming market. The number of Netflix subscribers grew at a 13% CAGR from 2013 to 2017, from 33.4 million to 54.8 million.
Source: Statista
Online Activities
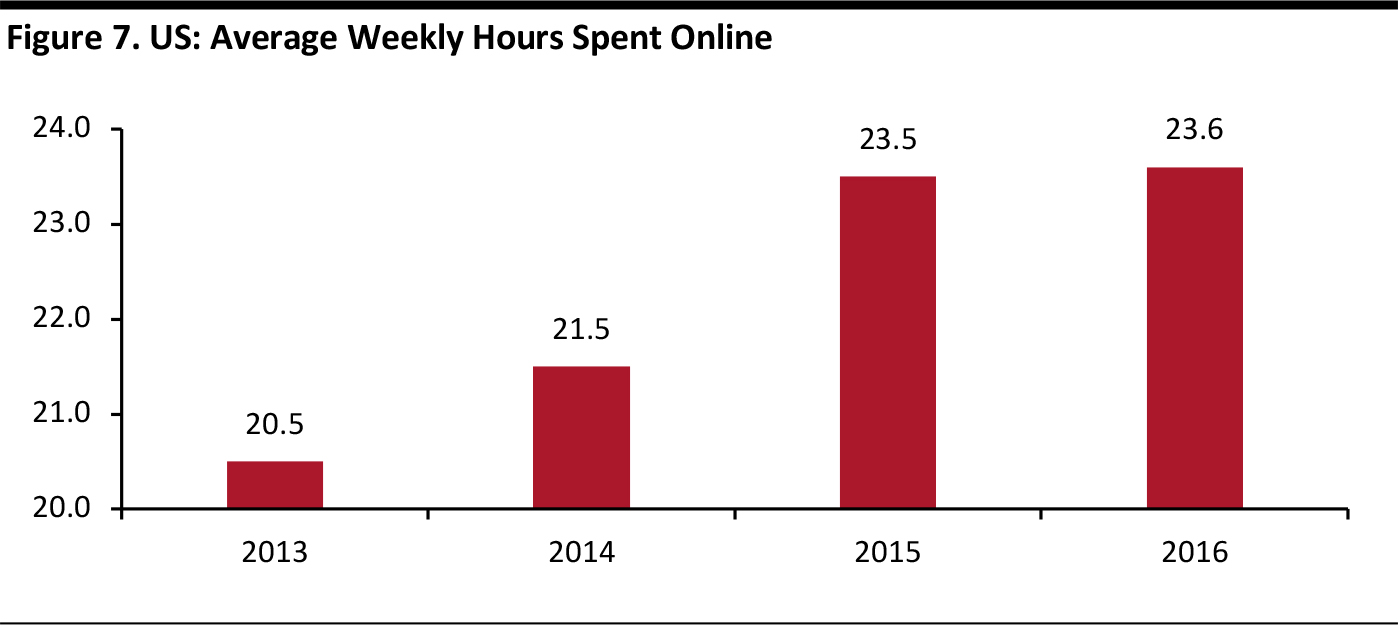
Americans are spending much more time online than they used to. On average, Americans spent 23.6 hours per week online in 2016, up from 20.5 hours per week in 2013, according to the most recent data from the Center for the Digital Future at USC Annenberg.
Base: 2,000 respondents ages 18+ Source: The Center for the Digital Future at USC Annenberg
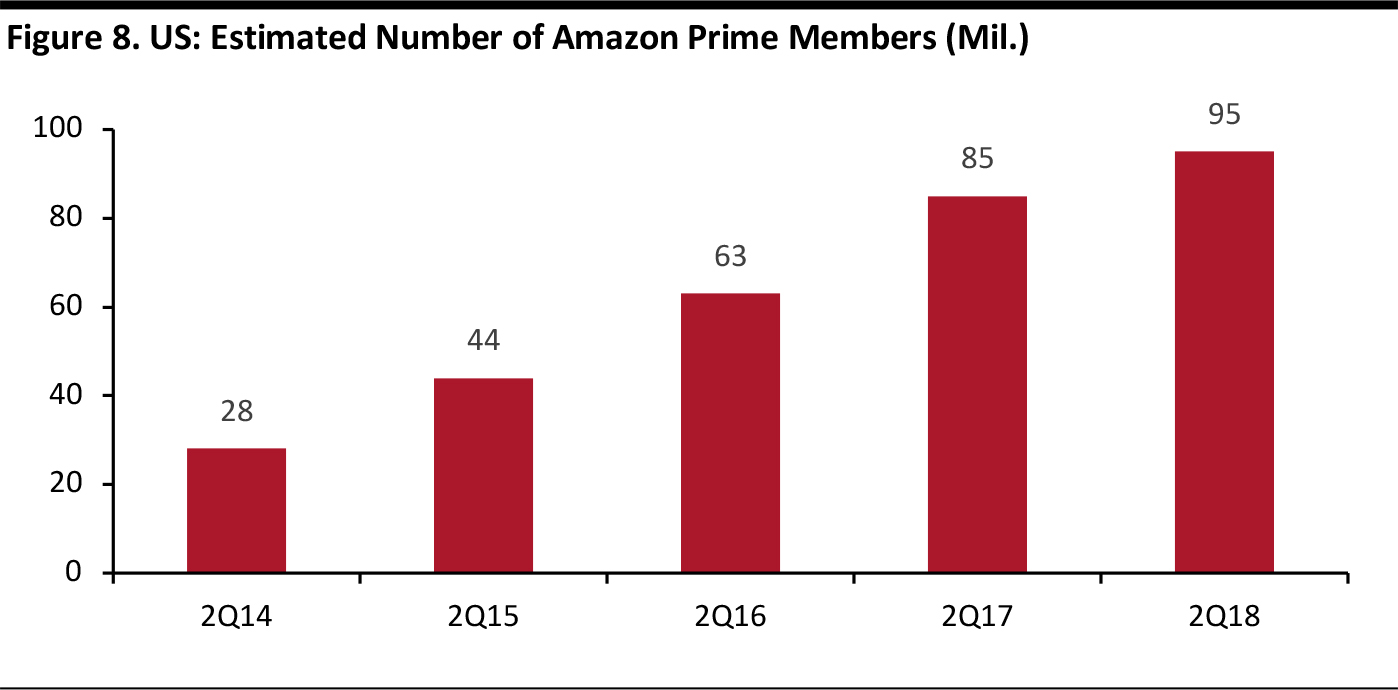
Retailers are capturing this trend by developing augmented- and virtual reality apps for mobile phones, by running promotions on social networks and by creating digital loyalty programs to engage customers and improve brand awareness. However, consumers’ increasing online time also brings challenges to retailers, as Internet access allows consumers to easily compare products and prices on their smartphones before they make purchases. A study conducted by the Center for the Digital Future at USC Annenberg found that approximately 75% of Internet users had used a mobile device in-store to check if there was a better deal to be had online. The boom in e-commerce has been one of the natural consequences of increased online time. According to Prosper Insights & Analytics’ US consumer surveys, 39.2% of adults over age 18 “frequently” made purchases online in 2017. Amazon is among those benefiting from this lifestyle change: Consumer Intelligence Research Partners estimates that there are now 95 million Amazon Prime members in the US, almost four times more than in 2013.
Source: Consumer Intelligence Research Partners
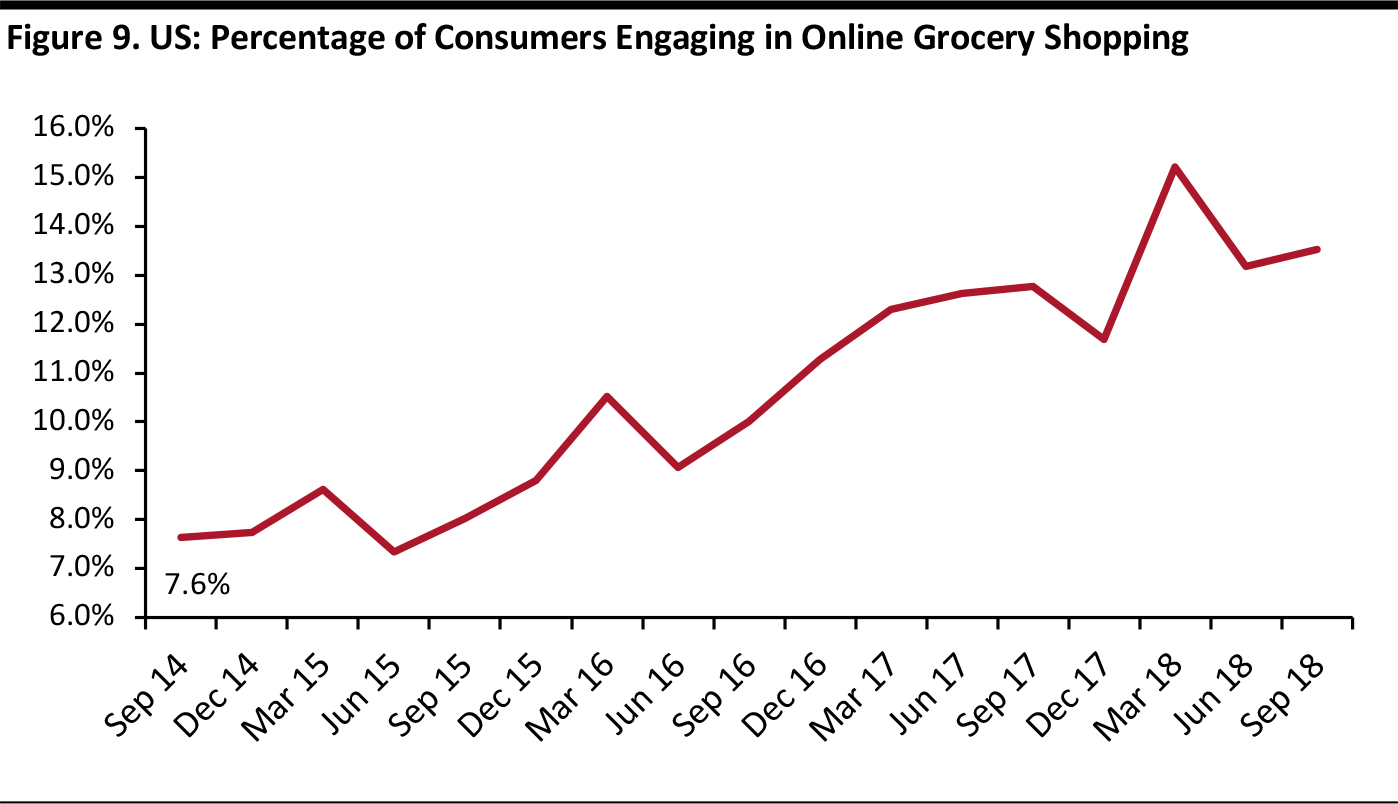
In the US, e-commerce has been relatively slow to penetrate the grocery market, but the proportion of consumers buying groceries online has been increasing. Prosper Insights & Analytics’ consumer surveys indicate that the proportion of US adults who shop for groceries online increased from 7.6% in September 2014 to 13.5% in September 2018.
Base: 7,000 respondents ages 18+ Source: Prosper Insights & Analytics
Increased Health Consciousness
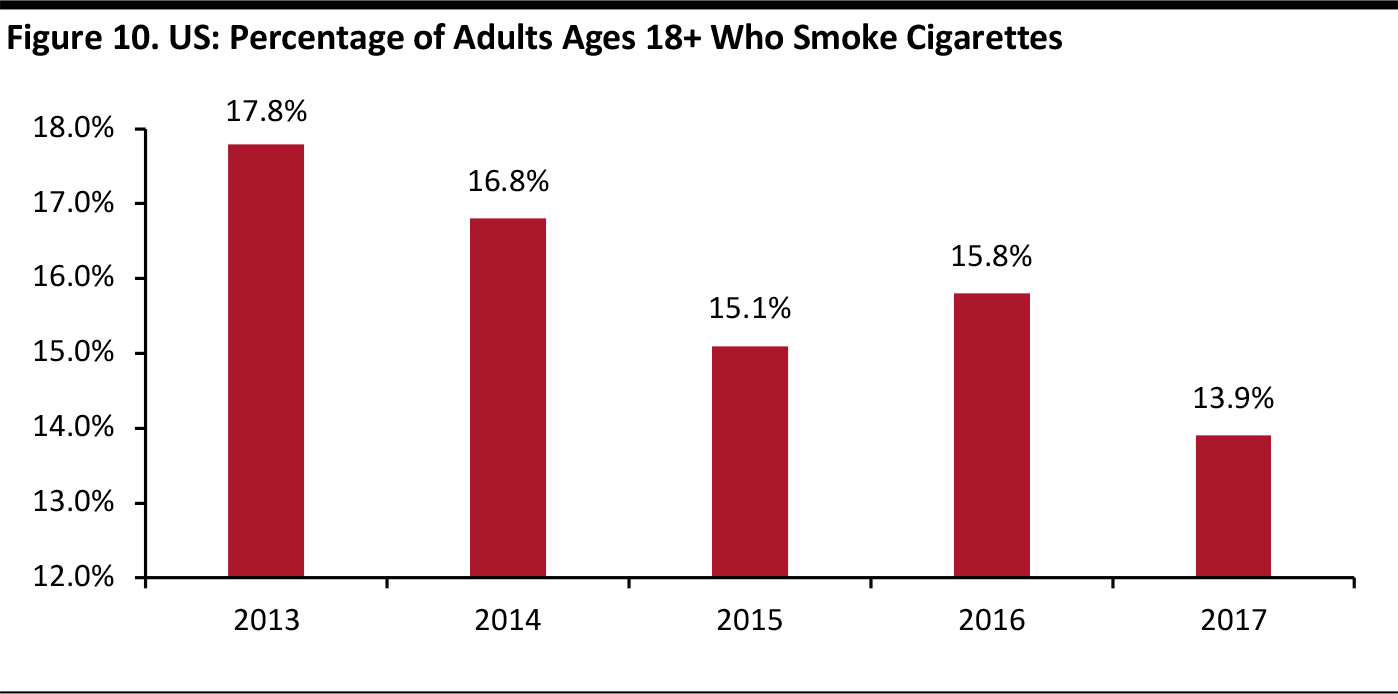
Americans have become more health conscious over the past few years. They are giving up cigarettes, signing up for gym memberships and purchasing organic food at higher rates than in the past. The percentage of American adults over age 18 who smoke cigarettes decreased to 13.9% last year from 17.8% in 2013, according to the US Centers for Disease Control and Prevention.
Source: US Centers for Disease Control and Prevention
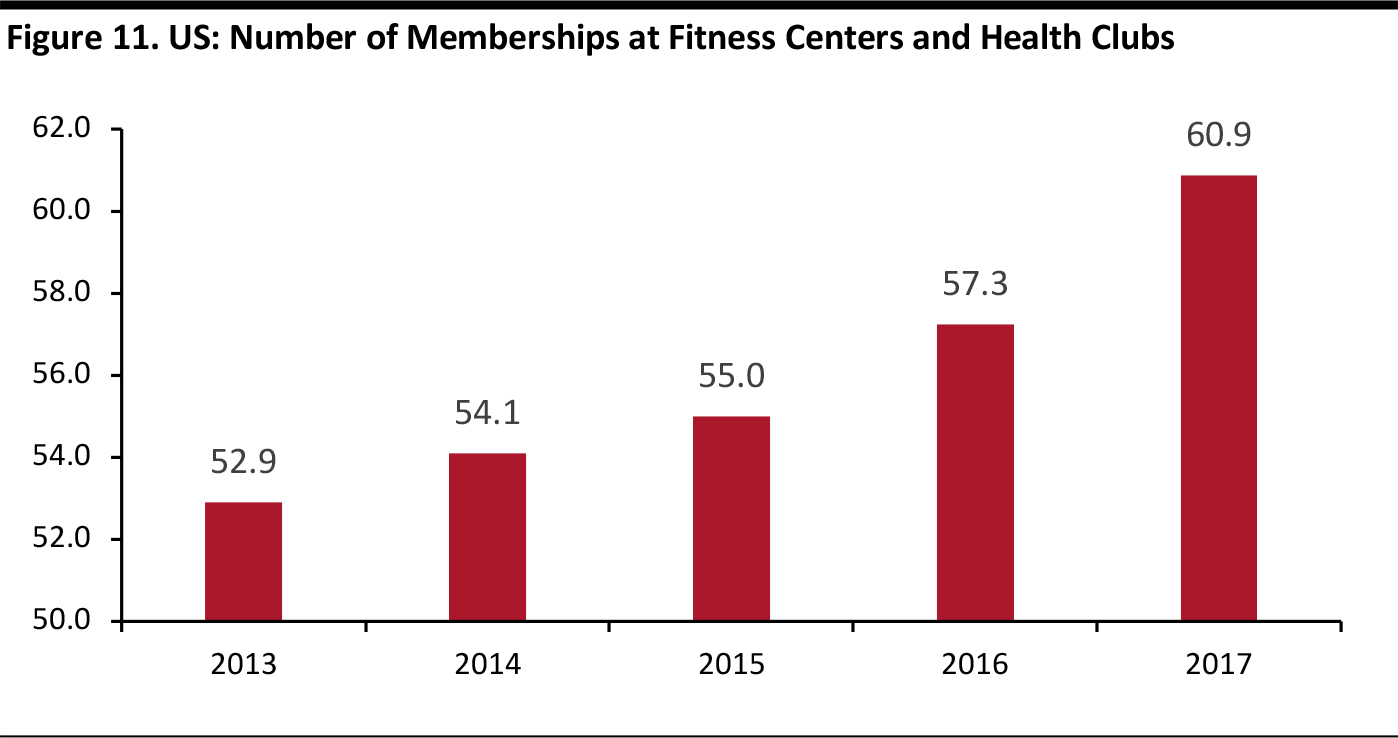
Influenced by social media, Americans are working out more to stay healthy and fit. The number of memberships at fitness centers and health clubs has been rising. In 2017, the total number of gym memberships reached 60.9 million, up from 52.9 million in 2013, according to the International Health, Racquet and Sportsclub Association.
Source: International Health, Racquet and Sportsclub Association
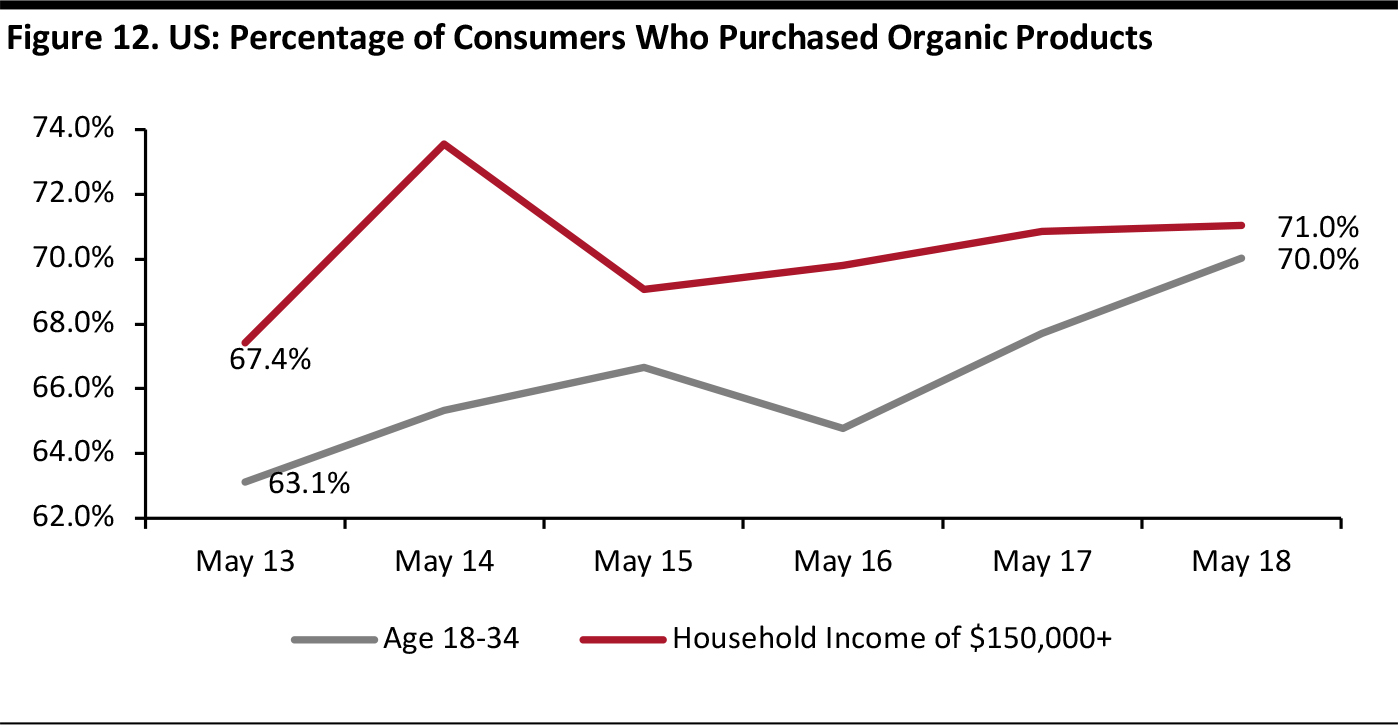
Eating healthy has also become more important to many Americans in recent years. According to data from Prosper Insights & Analytics, 70% of US consumers ages 18–34 purchased organic products in May 2018, up from 63.1% in May 2013. Among households with annual incomes over $150,000, the percentage that bought organic products reached 71% in May 2018, up from 67.4% in May 2013.
Base: 7,000 respondents ages 18+ Source: Prosper Insights & Analytics/Coresight Research
Wearables and Smart Devices
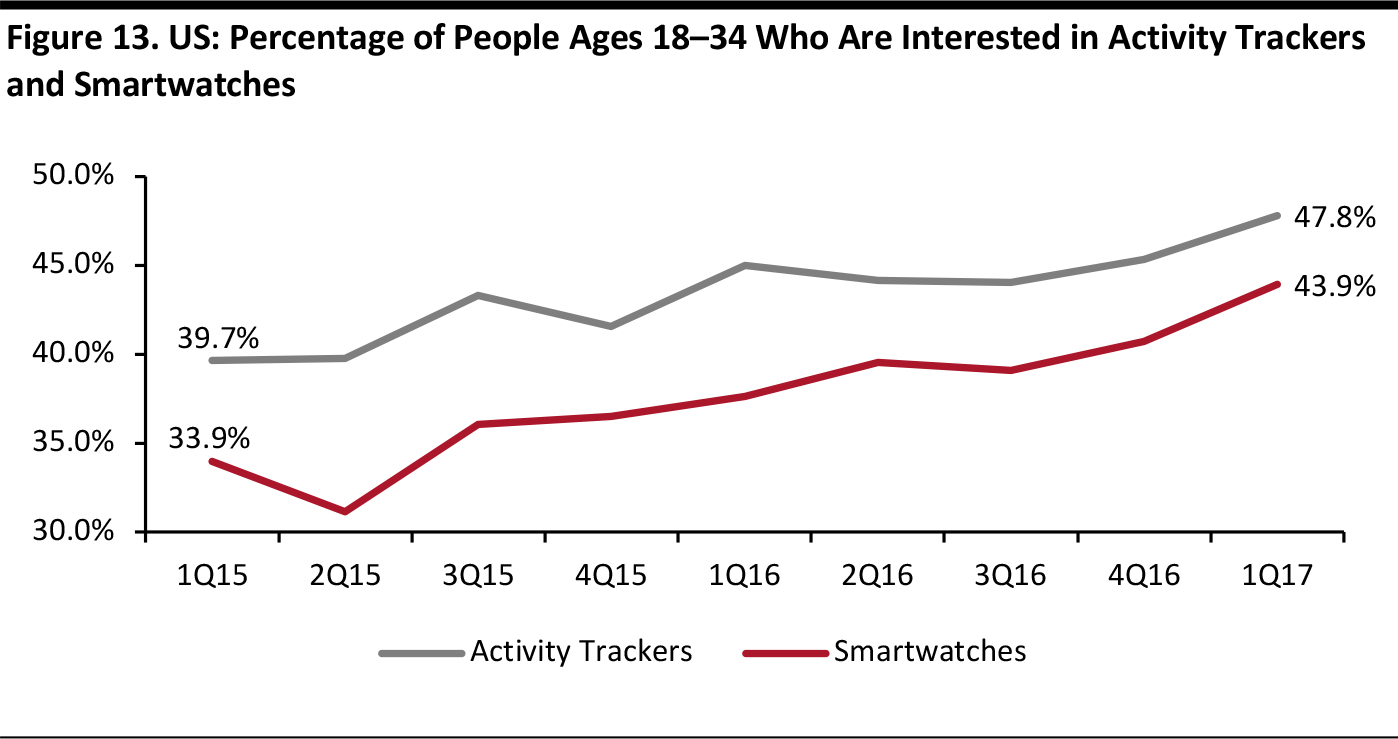
Ever since the launch of the first wristband tracker, the Fitbit Flex, in May 2013, new releases of wearable devices have grabbed consumers’ attention. Fitbit wearables allow users to track their physical activities and measure data such as heart rate. In 2013, Google launched its Google Glass smart glasses and in 2015, Apple released its own smartwatch. Microsoft, Samsung and Motorola have also all introduced their own wearable devices to catch the trend. Surveys suggest that people are showing increasing interest in wearable devices. According to data from Prosper Insights & Analytics, the percentage of consumers ages 18–34 who are interested in activity trackers has been growing in recent years, rising from 39.7% in the first quarter of 2015 to 47.8% in the first quarter of 2017. The same group’s rate of interest in smartwatches increased from 33.9% to 43.9% over the period.
Base: 7,000 respondents ages 18+ Source: Prosper Insights & Analytics/Coresight Research
Aside from fitness wearables and smartwatches, companies are also producing other kinds of smart devices. These include home appliances such as smart speakers with personal assistants powered by artificial intelligence. Amazon introduced the Echo in 2014, and Google and Apple have since launched their own smart speakers. According to technology-focused news website Voicebot, the number of smart speaker users reached 57.8 million in September 2018, up from 47.3 million in January 2018. Thanks to developments in speech recognition and artificial intelligence, smart speakers can even shop for consumers, who can simply talk to the devices and have their purchases completed without needing to click on anything.Americans and Their Pets
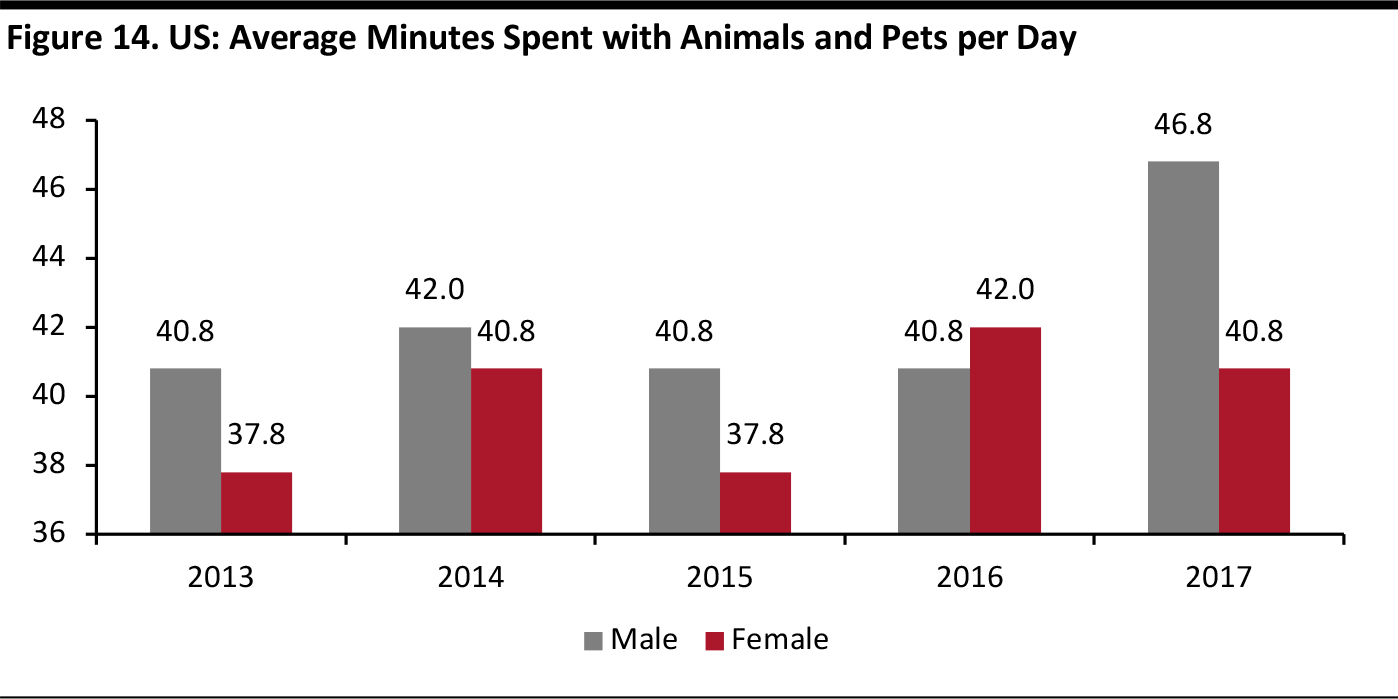
Between 2013 and 2017, the average amount of time American pet owners spent on animals each day increased from 39.0 minutes to 43.8 minutes, according to data from the US Census Bureau. For men, the time they spent on their animals and pets increased by 14.7% over the period, to 46.8 minutes. American women spent 40.8 minutes on their animals and pets in 2017, up 8% from 2013.
Base: Those who own animals and pets among approximately 10,200 respondents ages 15+ Source: US Census Bureau
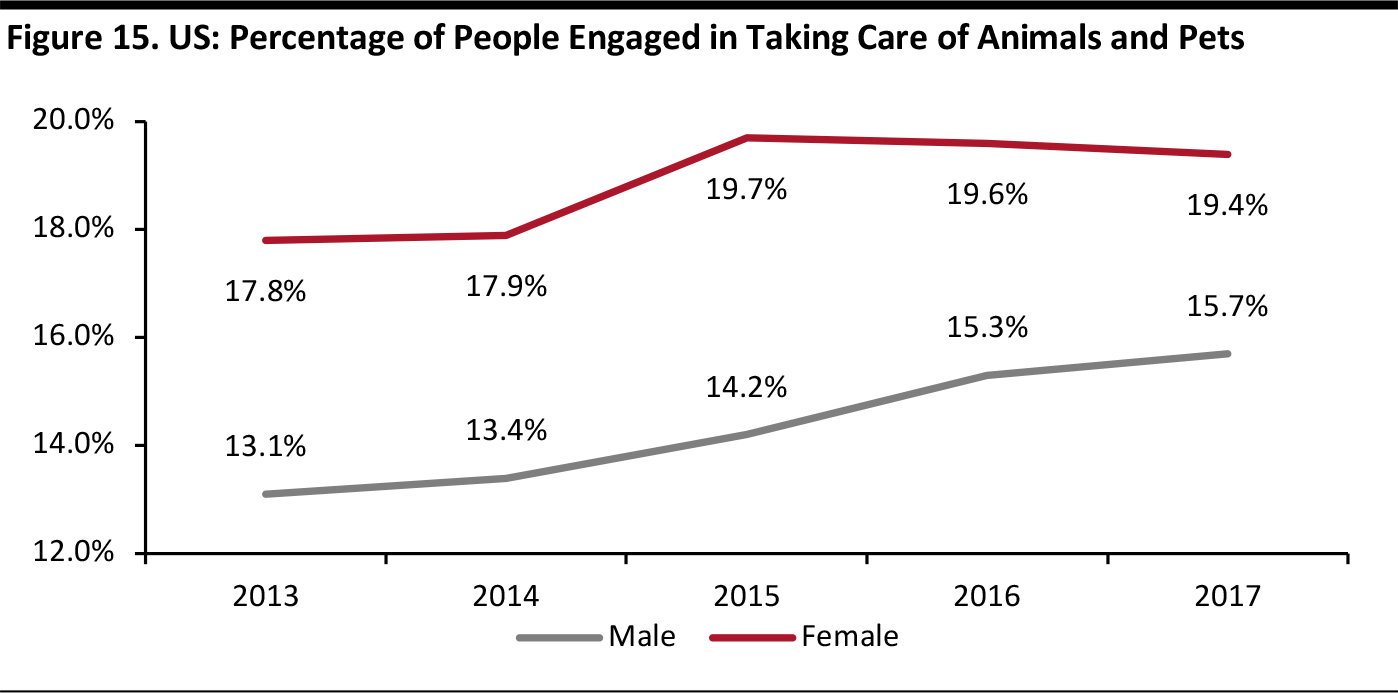
Not only are Americans spending more time on their pets, but also more of them are keeping pets. In 2017, approximately 17.6% of Americans kept animals and pets, according to data from the US Census Bureau. The rate for American men grew from 13.1% in 2013 to 15.7% in 2017 and the rate for women grew from 17.8% to 19.4% over the period. These findings could indicate that many Americans are trying to return to “real world” experiences by switching off their screens in order to spend time with pets.