Nitheesh NH
Introduction: Understanding the Marijuana Consumer
The legal market for marijuana continues to open up, growing the opportunities for brands and retailers to serve recreational and medical users of the drug. In this report, we shed light on the legal marijuana consumer with the findings of our proprietary survey of marijuana users in nine US states that had legalized marijuana for recreational and medical use at the time of our survey in October–November 2019. Those states are Alaska, California, Colorado, Maine, Massachusetts, Michigan, Nevada, Oregon and Washington. Possession of marijuana is also legal in Vermont, but we did not survey in this state because sale remains illegal. Starting January 1, 2020, legal sales of marijuana for recreational use will start in Illinois. Most questions in our survey were asked to respondents who had used marijuana in the past 12 months. Some questions were asked to sub-sets of marijuana users, such as people who had personally purchased marijuana. This report accompanies our November 2019 report The CBD Consumer.Survey Key Insights
1. Medical Users Drive Spending Medical reasons are a major driver of marijuana use and the market’s total value, while those using the drug for both medical and nonmedical reasons are the highest-value consumer segment. In total, around 70% of marijuana users cited medical reasons for use. That total includes just under half of marijuana users citing both medical and nonmedical reasons for use, and 21% citing medical reasons only. Just 30% said they use the drug for nonmedical (i.e., recreational) reasons only. Those who use marijuana for medical reasons tend to use it more frequently and spend more on the drug than do recreational users. Frequency of use and average spend peaks among those using marijuana for both medical and nonmedical reasons. 2. How Much Are They Spending? We asked respondents how much they typically spend on marijuana each month. We saw a clustering of responses in the $20–40 range, but the peak was in the $100–149.99 range. Using the midpoint of the spending ranges, we estimate overall average monthly spend at around $91. In turn, population data and the proportion of those buying marijuana (25% had purchased in the past 12 months) imply total legal consumer spending on marijuana of around $21.5 billion in 2019, in the nine states surveyed. We estimate approximately 81% of the market is accounted for by consumers who use marijuana for medical reasons (partly or wholly). Those using only for medical reasons account for an estimated 18% of all spend, and those using for both medical and nonmedical reasons account for an estimated 63% of all spend. This leaves approximately 19% of the market accounted for by those purchasing solely for recreational use. 3. New Ways of Consuming Emerge Around eight in 10 marijuana users smoke the drug, driven by recreational users—but almost one in three now vape. On average, each user we surveyed consumed it in two different ways in the past 12 months: For example, they smoked and vaped. Those using marijuana for both medical and nonmedical reasons registered the highest cross-category usage rates, an average of 2.3 categories. Tinctures, oils or sprays, drinks and capsules or pills are less common, although we see a repertoire effect: people who use one of these less-common methods to consume marijuana are more likely to also use other less-common methods than are average users. 4. Marijuana Use Represents a Hit To Alcohol but a Boost to CBD Our survey suggests marijuana legalization has a net negative impact on alcohol consumption. Six in 10 marijuana users say they use marijuana more frequently after legalization, and among those six in 10, some 40.9% say they cut alcohol use as a result, while only 5.1% said they now consume more alcohol. Our survey confirmed a strong link between CBD/hemp use and marijuana. Use of CBD/hemp is much higher among marijuana users (in nine states) than among the overall US population, and higher still among those using marijuana for medical reasons. Likewise, marijuana use is high among CBD/hemp users, with over half telling us they use the drug.Who Uses What
[caption id="attachment_101055" align="aligncenter" width="700"]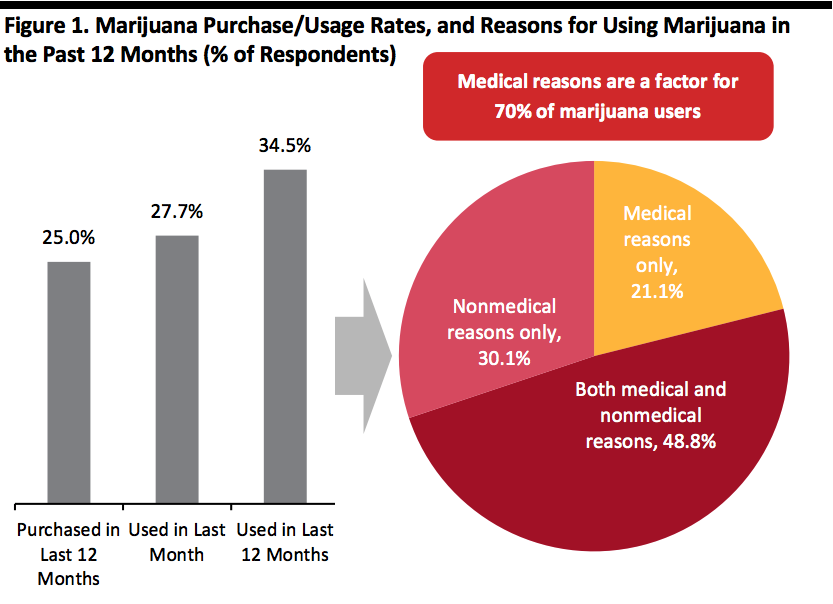 Base: 2,117 Internet users aged 18+ in nine US states, including 730 who had used marijuana in the past 12 months
Source: Coresight Research[/caption] Marijuana’s reputation as a recreational drug belies why people are using it: In total, around 70% of marijuana users cited some medical reasons for use. Just under half of marijuana users cited both medical and nonmedical reasons for use, with the remainder citing either medical reasons only or nonmedical reasons only (i.e., recreational). Just over one-third of respondents in the nine states surveyed had used marijuana in the past 12 months. Just over one-quarter had used the drug in the past month—an indicator of more frequent/non-lapsed users. A smaller proportion still—one-quarter—had personally purchased marijuana in the past 12 months. The 12-month usage rate was higher among men (at around 40%) than among women (at around 32%). Usage peaked at around half among the 18–24 and 25–34 age groups and was lowest in the 65+ age group. [caption id="attachment_101056" align="aligncenter" width="700"]
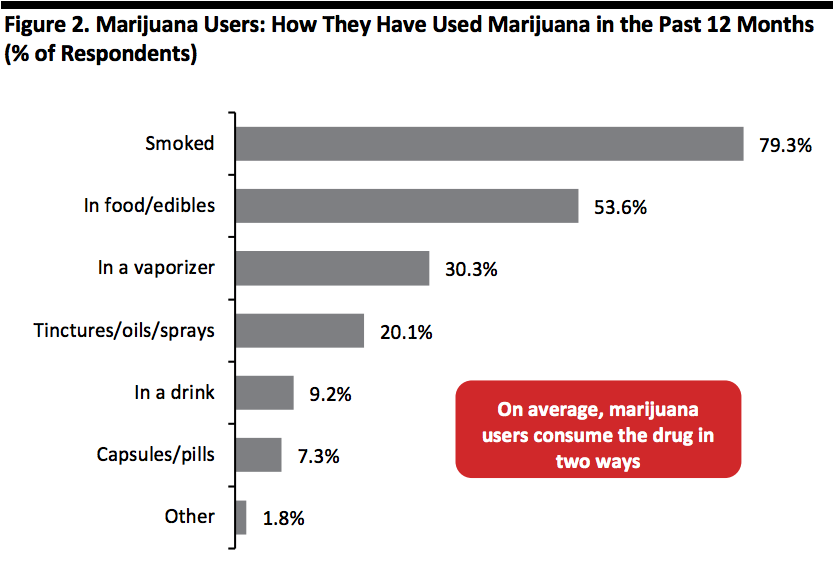 Respondents could select multiple options
Base: 730 Internet users aged 18+ in nine US states, who had used marijuana in the past 12 months
Source: Coresight Research[/caption] Around eight in 10 marijuana users smoke the drug but vaping is catching up, with almost one in three inhaling the drug in this way. On average, each marijuana user consumed the drug in two different ways in the past 12 months (e.g., smoking and vaping or eating and smoking). Levels of vaping were broadly the same among those who smoked marijuana as among marijuana users in general—around one in three smokers also vapes. While tinctures/oils/sprays, drinks and capsules/pills are niche overall, people who use one of these less-common ingestion methods are more likely to also use another method: for example, those who use tinctures/oils/sprays recorded above-average use of drinks (at 20% versus the 9% average) and capsules/pills (at 21% versus the 7% average). [caption id="attachment_101057" align="aligncenter" width="700"]
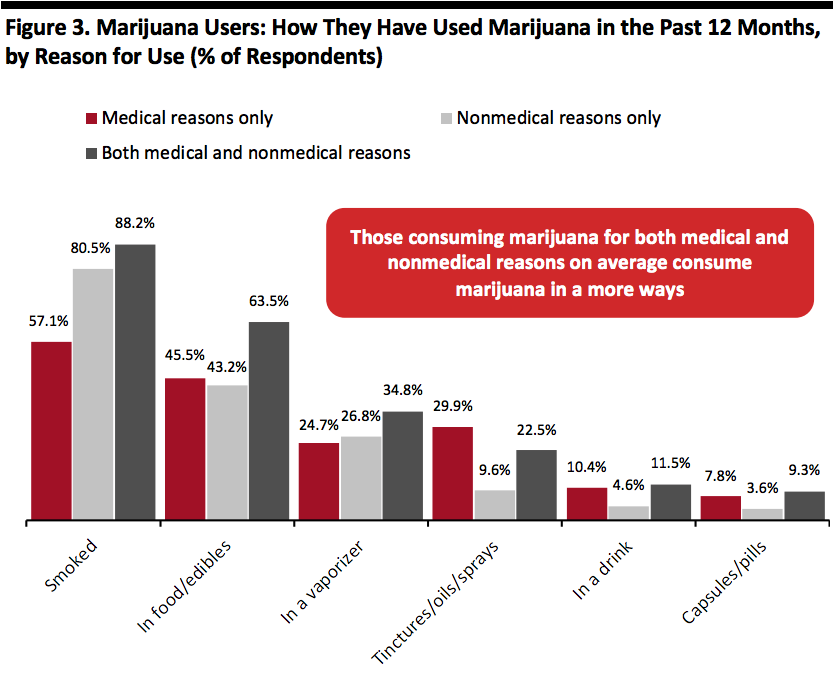 Respondents could select multiple options
Base: 730 Internet users aged 18+ in nine US states, who had used marijuana in the past 12 months
Source: Coresight Research[/caption] Those using marijuana for medical reasons are meaningfully less likely than the average user to smoke it and more likely to use less common methods such as oils/tinctures/sprays, drinks and capsules/pills. On average:
- Those using marijuana only for nonmedical reasons consumed the drug in 1.7 ways in the past 12 months (for example, smoked and in food).
- Those using marijuana only for medical reasons consumed the drug in 1.8 ways.
- Those using marijuana for both medical and nonmedical reasons consumed it in 2.3 ways.
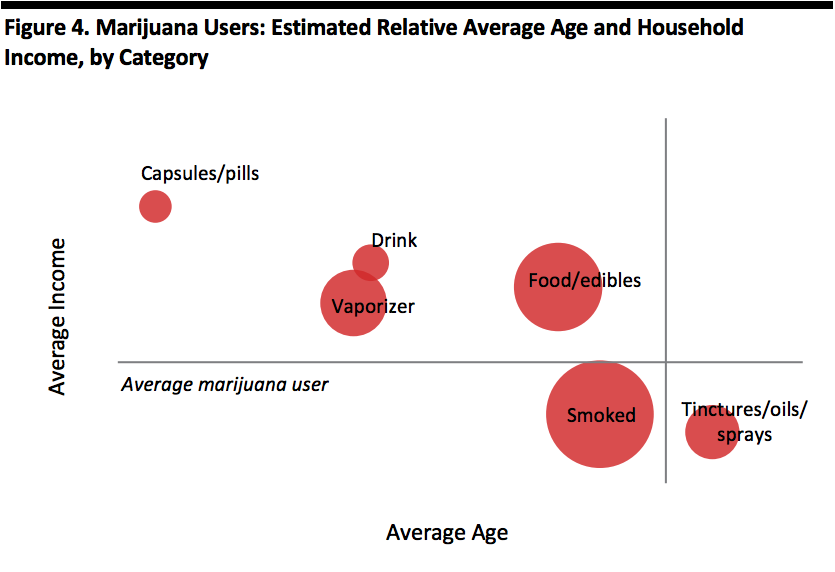 Bubble size reflects number of users
Base: 730 Internet users aged 18+ in nine US states, who had used marijuana in the past 12 months
Source: Coresight Research[/caption] People who vape marijuana are about three years younger and slightly more affluent than the average marijuana user. While the number who use capsules/pills is relatively small, they are even younger and more affluent. Perhaps reflecting medicinal use, people who consume marijuana tinctures, oils or sprays are slightly older than the average. The profile of the typical marijuana smoker is close to the overall average, and this reflects its status as the most popular means of using marijuana.
How Often They Use Marijuana
[caption id="attachment_101059" align="aligncenter" width="700"]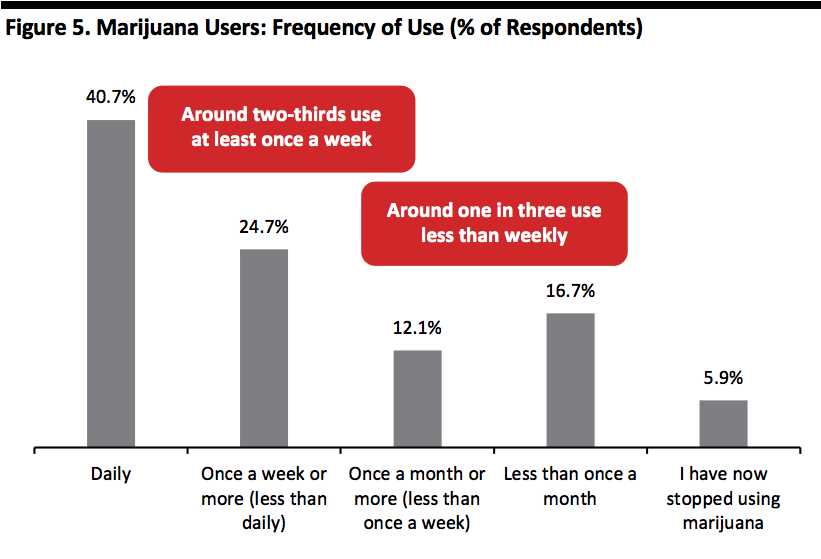 Base: 730 Internet users aged 18+ in nine US states, who had used marijuana in the past 12 months
Source: Coresight Research[/caption] Although four in 10 use marijuana daily, almost one in three use the drug only monthly or less often. And 6% of those who had used marijuana in the past year were no longer using it at the time of our survey. The youngest adult age group, 18–24, is the least likely to use marijuana daily (at 36% versus the 41% average) and the most likely to have stopped using it (at 15% versus the 6% average). The 55–64 age group is slightly more likely to be infrequent users, with lower rates of daily/weekly usage and higher rates of monthly or less-than-monthly usage. [caption id="attachment_101060" align="aligncenter" width="700"]
 Base: 730 Internet users aged 18+ in nine US states, who had used marijuana in the past 12 months
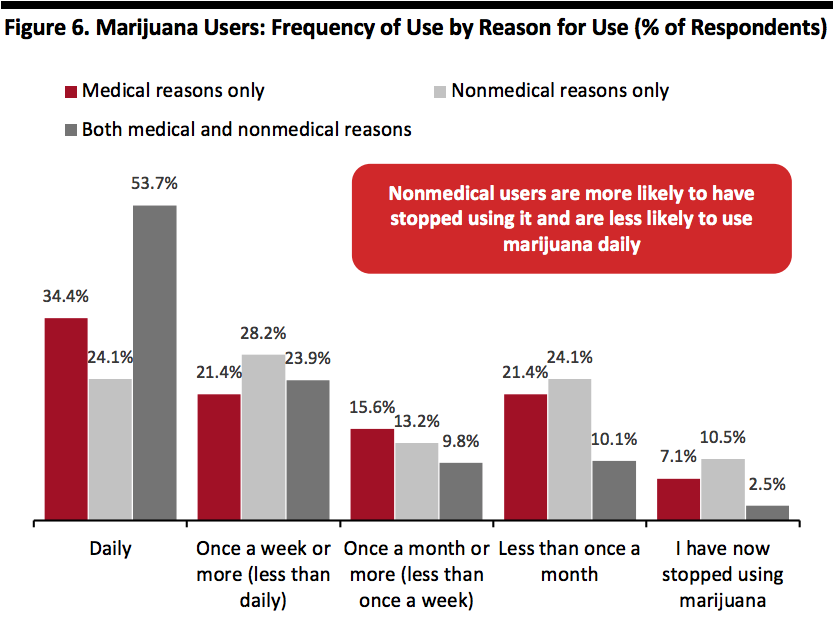
Source: Coresight Research[/caption] Medical reasons drive frequent usage: only one-quarter of those who use marijuana solely for nonmedical reasons use it daily, versus the 41% overall average of daily use. Our separate question on whether respondents had used marijuana in the past month found a similar picture: a lower figure for nonmedical users and the highest rate among those citing both medical and nonmedical reasons.
Where They Buy Marijuana Products and How Much They Spend
[caption id="attachment_101061" align="aligncenter" width="700"]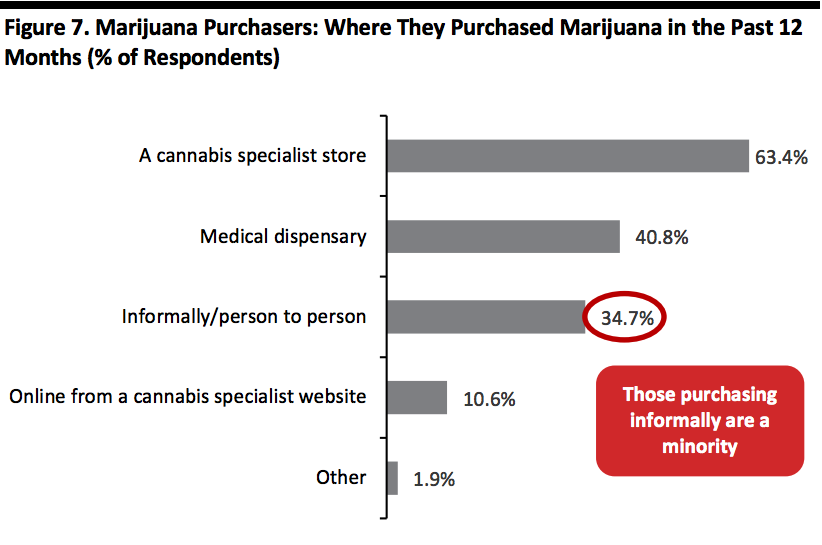 Respondents could select multiple options
Base: 530 Internet users aged 18+ in nine US states, who had personally purchased marijuana in the past 12 months
Source: Coresight Research[/caption] Inevitably, legalization has radically changed where users purchase marijuana: formal retail channels (specialist stores and medical dispensaries) have established leading positions and only just over one-third of users now buy informally (such as person to person). We continue to see a medical/nonmedical divide:
- Those using for nonmedical reasons only are much more likely (at 70%) to buy from a cannabis specialist store than are medical users (at 54%).
- Medical users are more likely to buy from medical dispensaries (at 45%).
- At 36%, nonmedical users are more likely to buy informally than medical users (at just 22%).
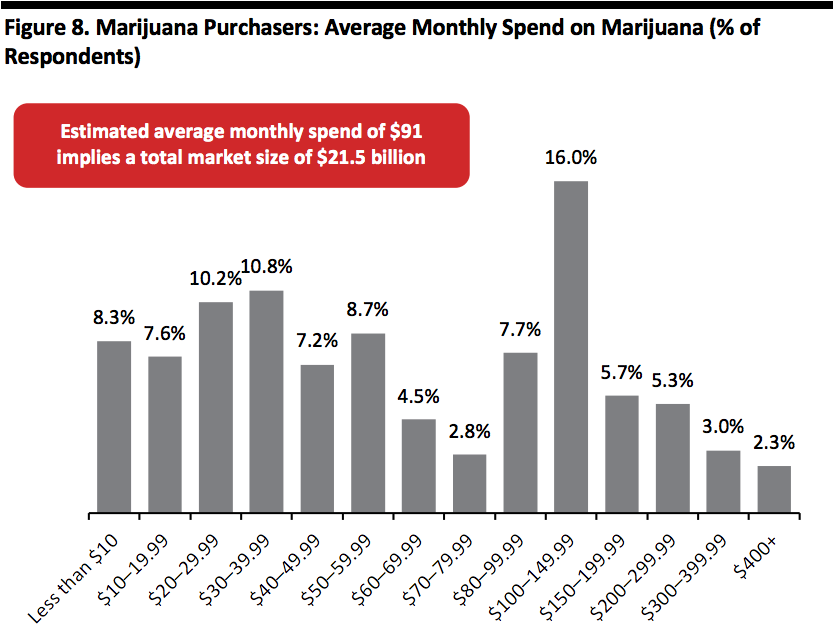 Base: 530 Internet users aged 18+ in nine US states, who had personally purchased marijuana in the past 12 months
Source: Coresight Research[/caption] In average monthly spend, we see clustering at around $20–40, but the peak is in the $100–149.99 range; as we show in the next graph, that peak is driven by those using marijuana for both medical and nonmedical reasons. Using the midpoints of the spending ranges, we estimate the average monthly spend of marijuana purchasers is around $91. In turn, also factoring in state population numbers and the proportion of respondents claiming to have purchased marijuana, we estimate total legal consumer spending on recreational and medical marijuana use to be $21.5 billion in 2019, across the nine states in which it is legal to purchase the drug for recreational use. We present this estimate with the caution that it is based on assumptions about average spending within each spending range. [caption id="attachment_101063" align="aligncenter" width="700"]
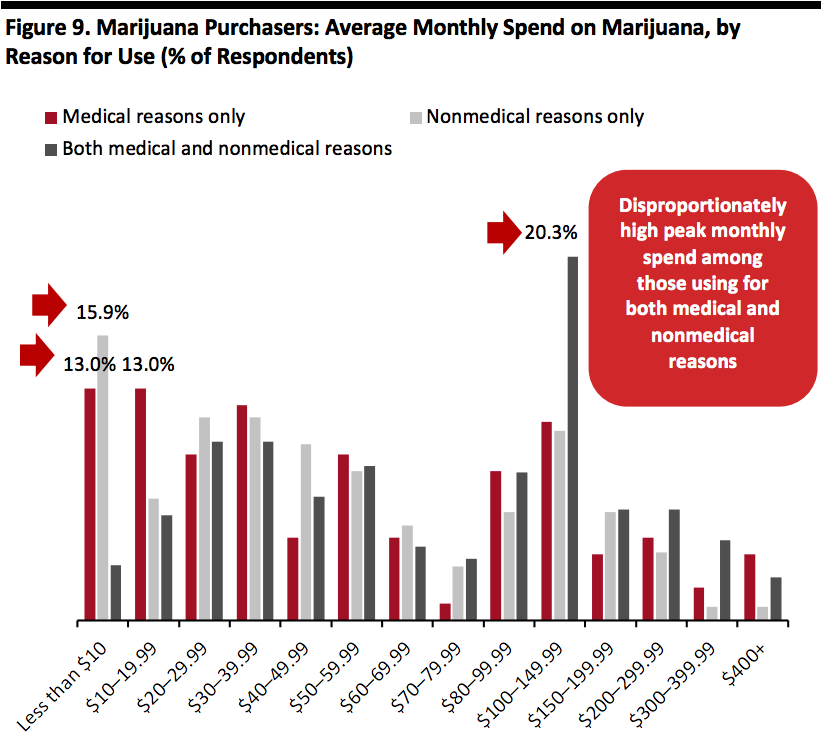 Base: 530 Internet users aged 18+ in nine US states, who had personally purchased marijuana in the past 12 months
Source: Coresight Research[/caption] Based on the midpoints of the spending ranges, we estimate that those buying marijuana for nonmedical reasons only spend the least, at roughly $68 per month; this compares to an estimated $81 for those using marijuana for medical reasons only and $105 among those using it for both medical and nonmedical reasons. Nonmedical users are also less likely to have personally purchased marijuana, at just 60.0% versus 81.5% for medical-and-nonmedical users (not charted). [caption id="attachment_101064" align="aligncenter" width="700"]
 Source: Coresight Research[/caption]
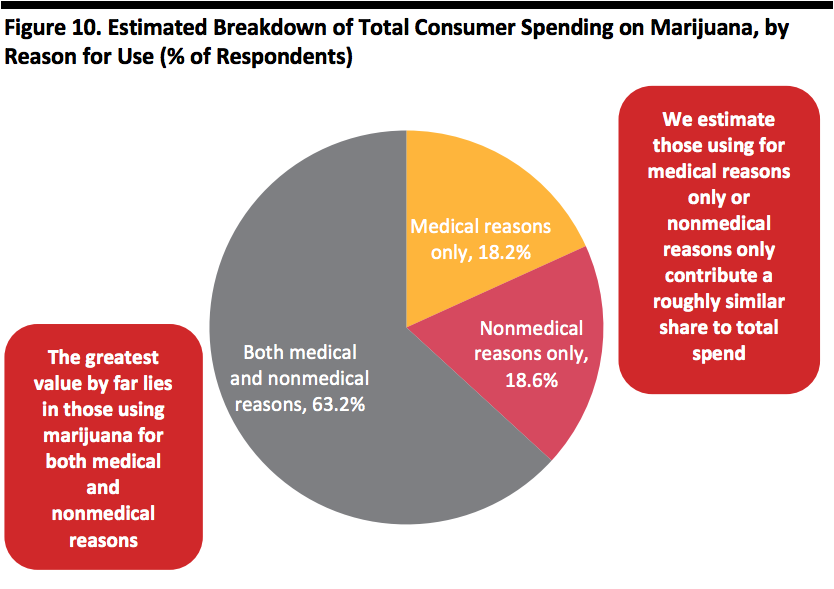
We took our estimates one step further and calculated the distribution of total consumer spending on marijuana by reason for use. The results suggest those using marijuana for both medical and nonmedical reasons account for a disproportionate share of total spend: Although just under half use for both medical and recreational reasons, we estimate that these consumers account for close to two-thirds of all spend, based on how much that group reports spending each month.
Source: Coresight Research[/caption]
We took our estimates one step further and calculated the distribution of total consumer spending on marijuana by reason for use. The results suggest those using marijuana for both medical and nonmedical reasons account for a disproportionate share of total spend: Although just under half use for both medical and recreational reasons, we estimate that these consumers account for close to two-thirds of all spend, based on how much that group reports spending each month.
Medical and Nonmedical Reasons for Use
[caption id="attachment_101065" align="aligncenter" width="700"]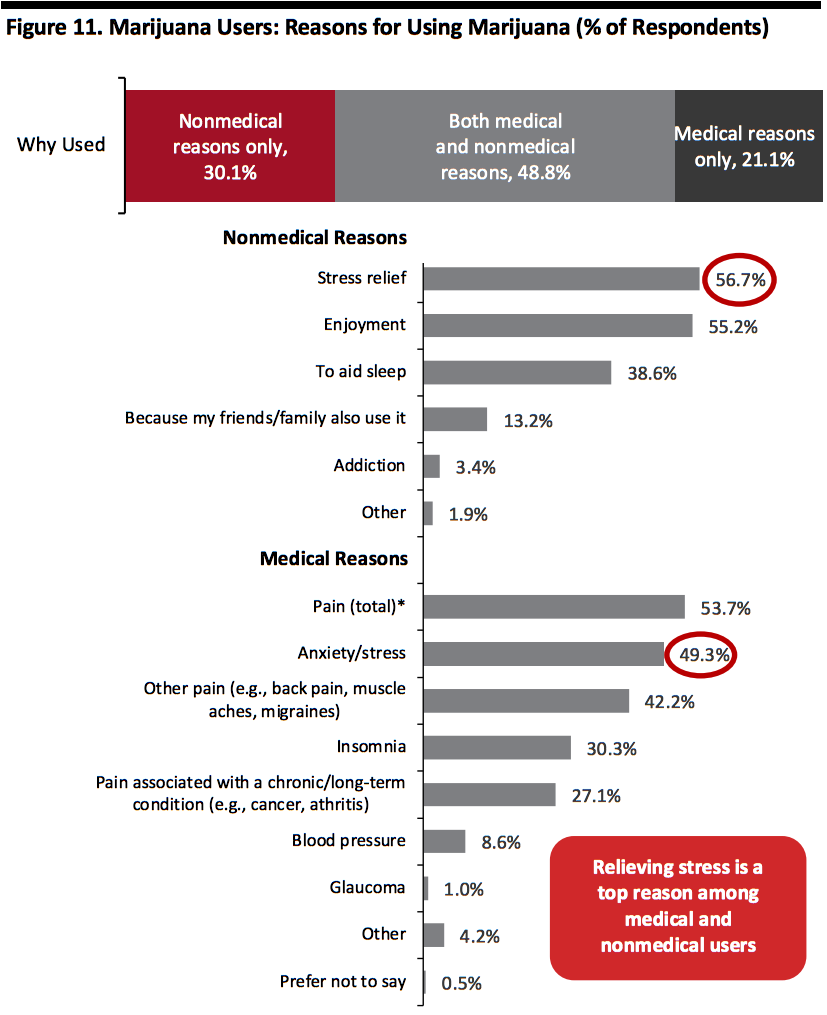 Respondents could select multiple options.
Base: 730 Internet users aged 18+ in nine US states, who had used marijuana in the past 12 months
*The deduplicated total of “pain associated with a chronic condition” and “other pain”
Source: Coresight Research[/caption] Stress relief is neck and neck with enjoyment as the top nonmedical reason for using marijuana. Although pain relief was the top medical reason, anxiety/stress came a close second. Nonmedicalized stress was also an option for recreational/nonmedical use, and this was broadly level with enjoyment as a top driver of nonmedical use. Within pain, pain associated with a chronic condition (such as arthritis or cancer) was cited considerably less than “general” pain such as backache.
Alcohol and CBD
[caption id="attachment_101066" align="aligncenter" width="700"]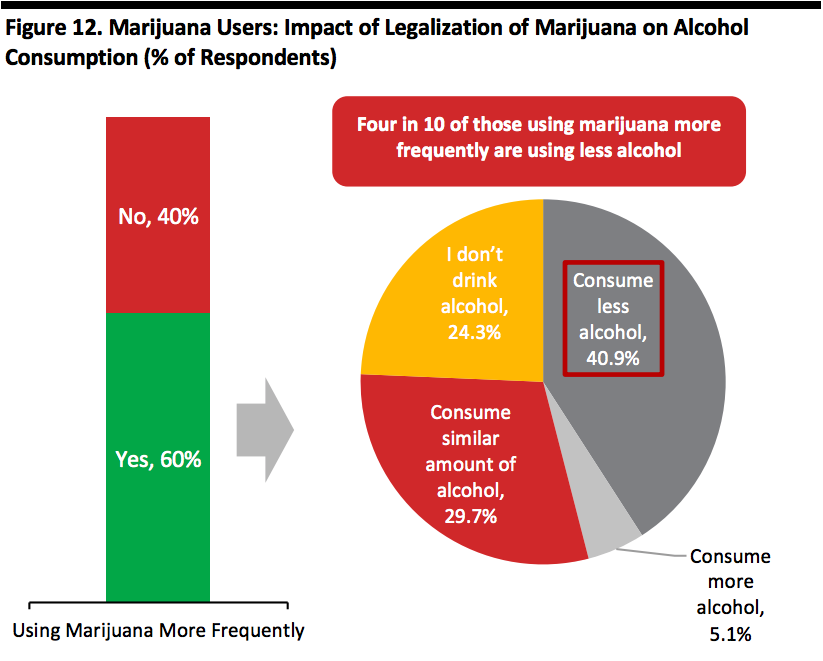 Base: 730 Internet users aged 18+ in nine US states, who had used marijuana in the past 12 months
Source: Coresight Research[/caption] Growth in the marijuana market can come at the expense of other intoxicants. Six in 10 say they use marijuana more frequently following legalization, and, on average, this reduces alcohol consumption. On average four in 10 of those who have increased their consumption of marijuana have reduced their use of alcohol. Among those using for medical reasons only and who use marijuana more frequently, around 29% drink less alcohol. Among those using for both medical and nonmedical reasons and who use marijuana more frequently, fully half have cut alcohol intake. [caption id="attachment_101067" align="aligncenter" width="700"]
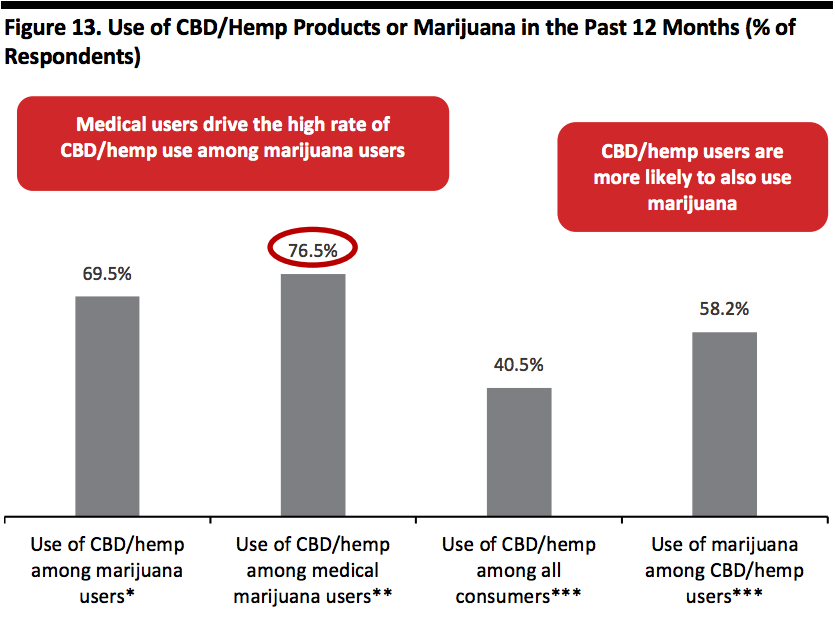 Respondents could select multiple options
Base: 730 Internet users aged 18+ in nine US states, who had used marijuana in the past 12 months and 920 US Internet users aged 18+, who had used CBD/hemp products in the past 12 months
*In the nine states surveyed for this report
**Aggregate total for “medical use only” and “both medical and nonmedical use” in the nine states surveyed for this report
***Among US consumers nationwide
Source: Coresight Research[/caption] While marijuana use on average reduces alcohol consumption, it correlates to above-average use of CBD/hemp products. Our data suggests a significant overlap in consumers who use CBD/hemp and those who use marijuana:
- Use of CBD/hemp is much higher among marijuana users (in the nine surveyed states) than the average (nationwide). It is even higher among those who use marijuana for medical reasons.
- Likewise, marijuana use is high among CBD/hemp users, with well over half saying they use the drug.
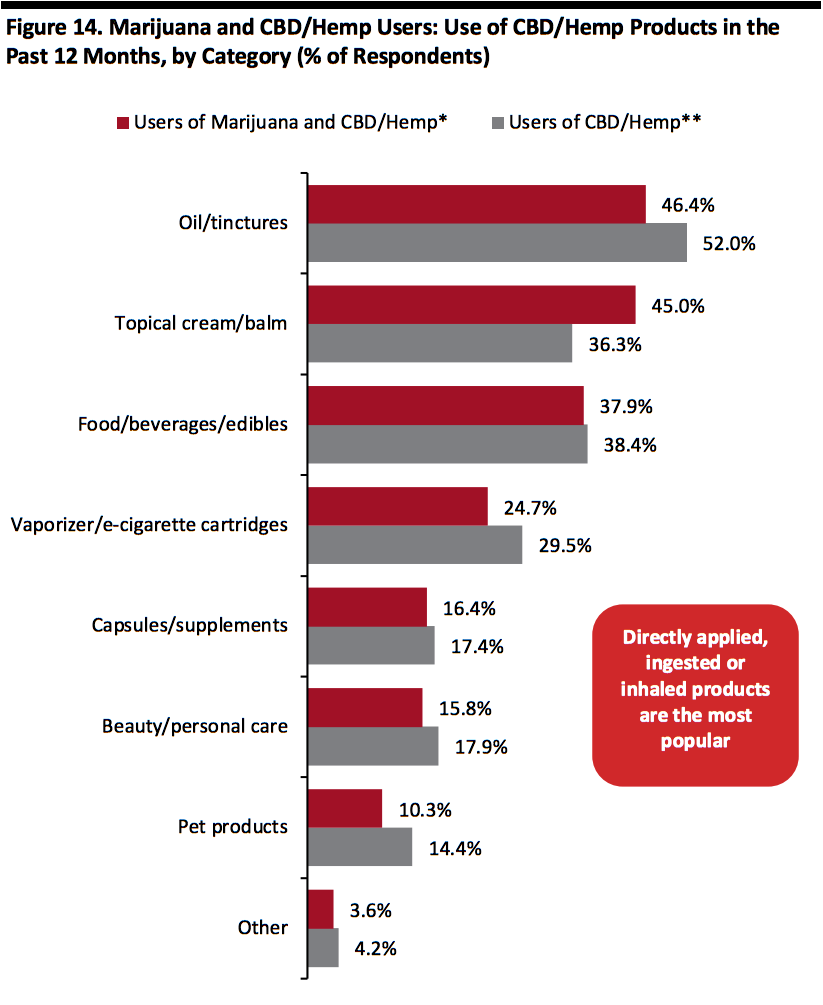 Respondents could select multiple options
Base: 507 Internet users aged 18+ in nine US states, who had used both marijuana and CBD/hemp products in the past 12 months; and 920 US Internet users aged 18+, who had used CBD/hemp products in the past 12 months
*In the nine states surveyed for this report
**Nationwide
Source: Coresight Research[/caption] We asked those marijuana users who said they also used CBD/hemp which types of CBD/hemp products they had used. In the chart above, we compare the results with those from our recent nationwide survey of users of CBD/hemp products. Around half used oil or tinctures, very roughly the same as the average for CBD/hemp users. We recorded greater use of topical cream/balm among marijuana users than among CBD/hemp users overall. And we recorded a lower rate of use of vaporizers/e-cigarettes among those who used marijuana.