Nitheesh NH
Introduction: Understanding the CBD Consumer
In retail and consumer goods, cannabidiol (CBD) is a phenomenon in categories from skincare to food and in formats from CBD specialist stores to beauty chains. And the results of our survey suggest a long runway for growth in CBD. CBD occurs naturally in the cannabis sativa plant, and we’re seeing it increasingly included in a range of mainstream products. Before the end of 2018, the legal status of CBD in the US was unclear, which no doubt stunted new product launches. However, in December 2018, the federal government clarified the status of CBD from certain types of plants, making it explicitly legal in all states. Now, companies are rushing to launch new CBD products. At shelf level, there is much crossover between CBD and hemp in product names and descriptions. For this reason, our survey asked respondents about their use of products containing CBD/hemp. We surveyed 2,271 US Internet users aged 18+ in October and November 2019, including 920 who had used products containing CBD/hemp in the past 12 months. Some questions were asked to sub-sets of CBD/hemp users, such as people who had personally purchased CBD/hemp products. We will publish results from a follow-up survey of marijuana users in a separate report coming soon, The Marijuana Consumer.Survey Key Insights
1. Long Runway for Mainstream Products Containing CBD CBD/hemp has become a significant product trend across mainstream product categories. However, our survey suggests it continues to have a niche positioning:- The most-used products tend to be more traditional CBD/hemp products such as oils and tinctures and food/beverages/edibles. Categories in which CBD/hemp is an “add-on” to an existing product, such as beauty/personal care and pet products, are much less commonly used.
- The most frequently cited reasons for using CBD/hemp products are therapeutic benefits, such as pain relief or stress relief. Outward or visible benefits such as treating skin conditions or improving appearance are much less important drivers.
- The dominant channels are CBD specialist stores and health-food stores as well as online: Mainstream physical formats such as beauty stores and supermarkets lag. There looks to be an opportunity for mass-market, physical-store formats to capture greater spend.
- Older consumers are much more likely to use CBD or hemp for pain relief, with 85% of 65+ users citing this reason.
- Younger consumers are much more likely than older consumers to use CBD/hemp products for holistic and mental-wellbeing reasons, such as for stress relief, relaxation and to aid sleep.
- Oil or tincture use is relatively consistent across age groups, but older consumers are much more likely than their younger counterparts to use these products daily, which would align with pain-relief use.
- The oldest age group (65+) is more likely than younger consumers to use a topical cream or balm, while younger users are much more likely to consume edibles, vape or use beauty or personal care products with CBD or hemp added.
- Is aged around 45. Use peaks in the 25-34 age group, but a substantial number of older users push up the average.
- Is more affluent, with a household income of around $71,000, versus around $59,000 for nonusers in our survey.
- Those using CBD/hemp in vaporizers or e-cigarettes are younger and less affluent than the average CBD/hemp user.
- Those using pet products containing CBD/hemp are the most affluent sub-set of CBD/hemp consumers.
- Among CBD/hemp users, fully 58.2% said they had used marijuana in the past 12 months.
- Regional data on CBD/hemp use further suggests a link: We found use was highest in regions in which states have legalized marijuana.
- And, 18.6% of CBD/hemp users said they used these products as an alternative to marijuana.
Who Uses CBD/Hemp Products
[caption id="attachment_100013" align="aligncenter" width="700"]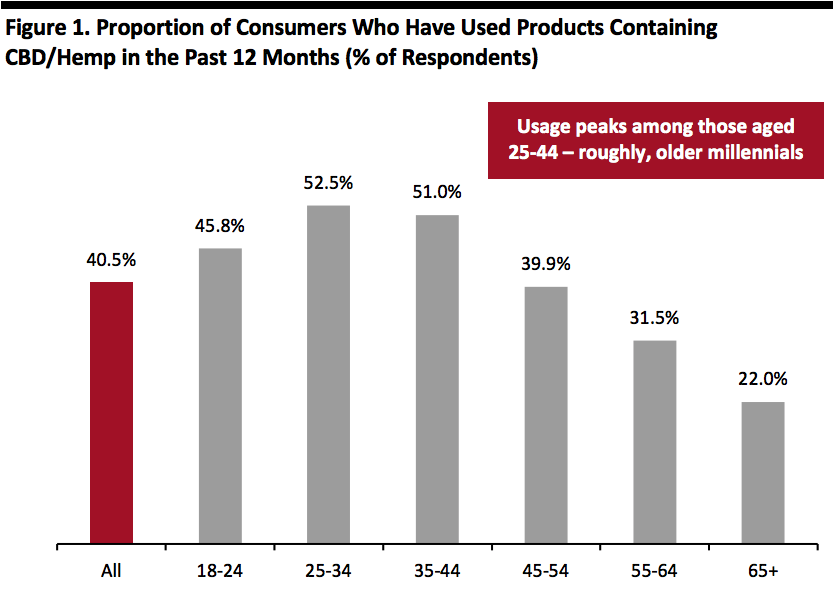 Base: 2,271 US Internet users aged 18 and above
Source: Coresight Research[/caption] We asked respondents whether they had used products containing CBD or hemp in the past 12 months: four in ten said they had. Usage peaks among the 25-34 and 35-44 age groups. Our survey confirmed most CBD or hemp users are using these products regularly:
- Among those who had used CBD/hemp products in the past 12 months, 80.9% had used CBD/hemp products in the past month. This means just under 33% of all 2,271 respondents (i.e., all consumers) used products containing CBD/hemp in the past month.
- We also asked about frequency of use for specific types of CBD/hemp products and, on average, over one-third use CBD/hemp products daily across all categories. We detail frequency of use by product category later in this report.
What Categories They Use and How Often They Use Them
[caption id="attachment_100014" align="aligncenter" width="700"]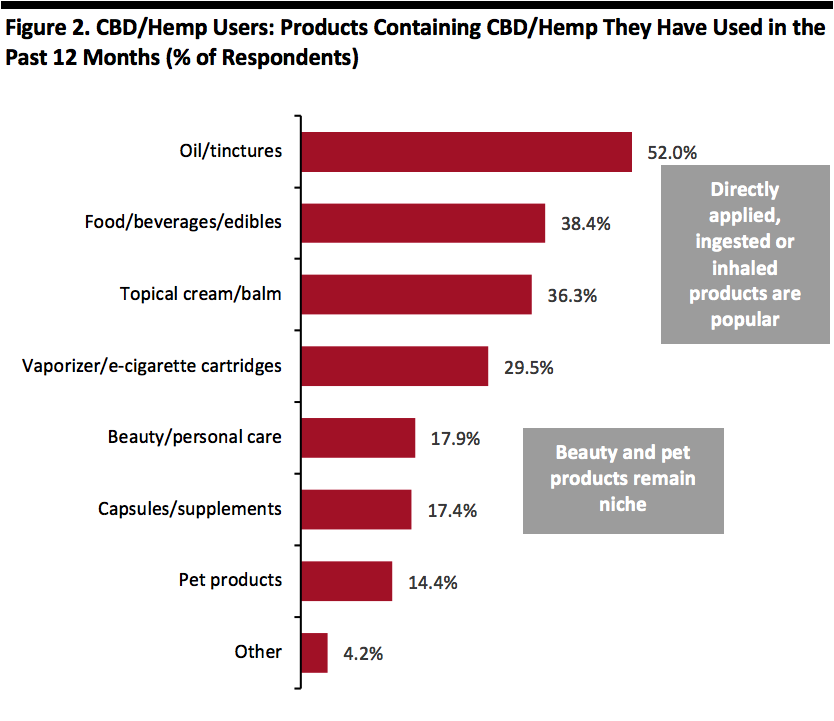 Respondents could select multiple options Base: 920 US Internet users aged 18 and above who had used CBD/hemp products in the past 12 months
Source: Coresight Research[/caption] Product categories in which CBD/hemp is directly applied, ingested or inhaled are the most popular, with oil/tinctures being the most-used. Categories in which CBD/hemp is an “add-on” to an existing product, such as an ingredient in beauty/personal care and pet products, are much less used. This suggests there is an opportunity for these more mainstream categories to grow user numbers. [caption id="attachment_100140" align="aligncenter" width="700"]
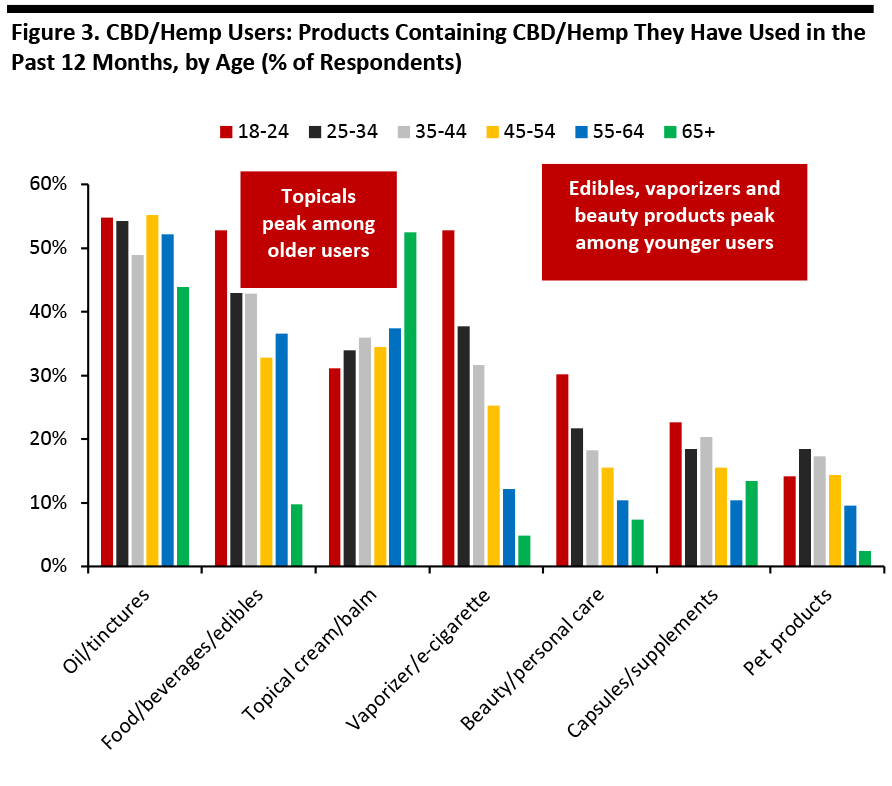 Respondents could select multiple options
Base: 920 US Internet users aged 18 and above who had used CBD/hemp products in the past 12 months
Source: Coresight Research[/caption] Our data on category usage by age shows:
- Oils and tinctures are the most consistently used across age groups.
- Topical cream/balm use peaks strongly among the 65+ group, which aligns with our finding (discussed later) that older people use CBD/hemp most for pain relief.
- Food/beverages/edibles, vaporizers and beauty/personal care product use peaks among the youngest age groups, which fits with their use of CBD/hemp for holistic, wellness and lifestyle reasons rather than pain relief.
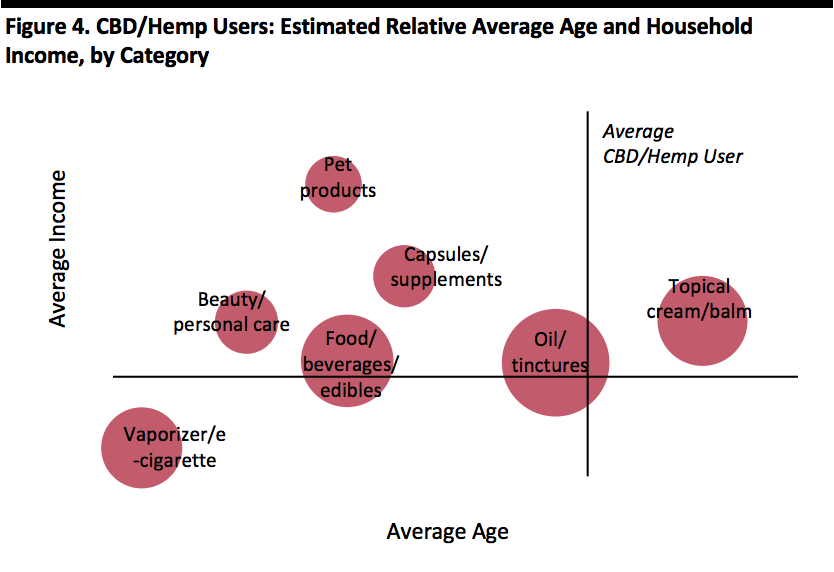 Bubble size reflects number of users
Base: 920 US Internet users aged 18 and above who had used CBD/hemp products in the past 12 months
Source: Coresight Research[/caption] People who vape CBD/hemp are significantly younger and slightly less affluent than the average CBD/hemp user. Those who use CBD pet products are significantly more affluent than the average – understandable, given the highly discretionary nature of such a product. The profile of the typical oil/tincture user is closest to the overall average, and this reflects its status as the most popular CBD/hemp category. [caption id="attachment_100017" align="aligncenter" width="700"]
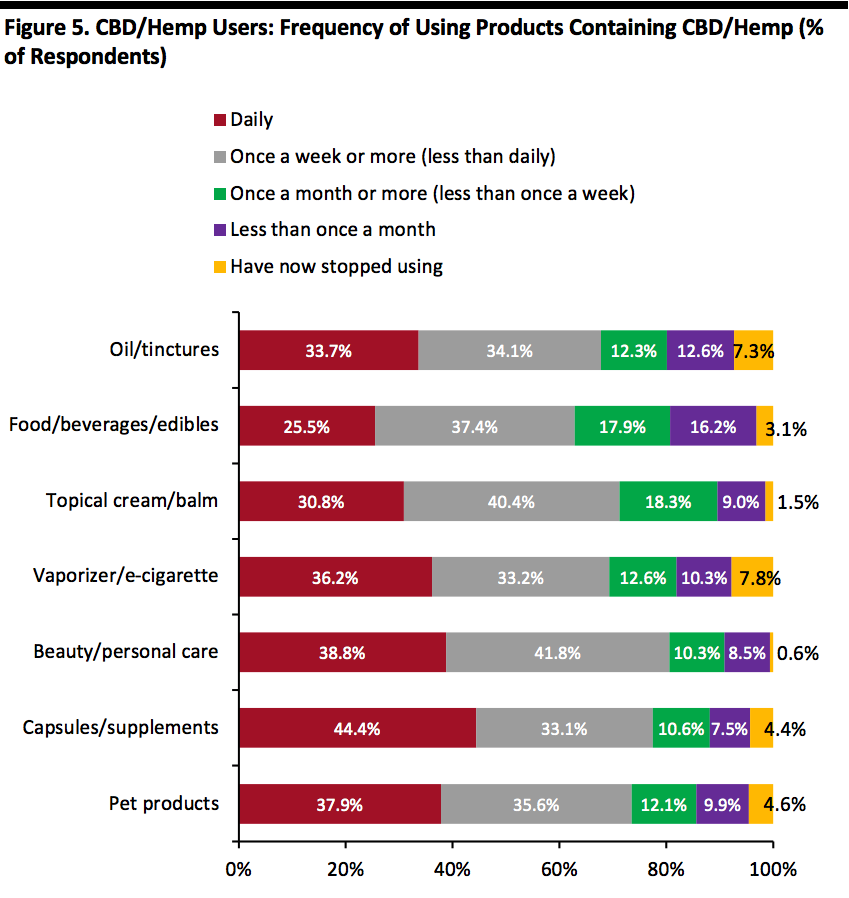 Base: US Internet users aged 18 and above who had used the respective CBD/hemp categories in the past 12 months
Source: Coresight Research[/caption] On average, over one-third of CBD/hemp consumers across the categories use the products daily, though the food/beverages/edibles category sees notably lower rates of daily use. Oil/tinctures and vaporizers/e-cigarettes showed the greatest proportion of lapsed users. [caption id="attachment_100019" align="aligncenter" width="700"]
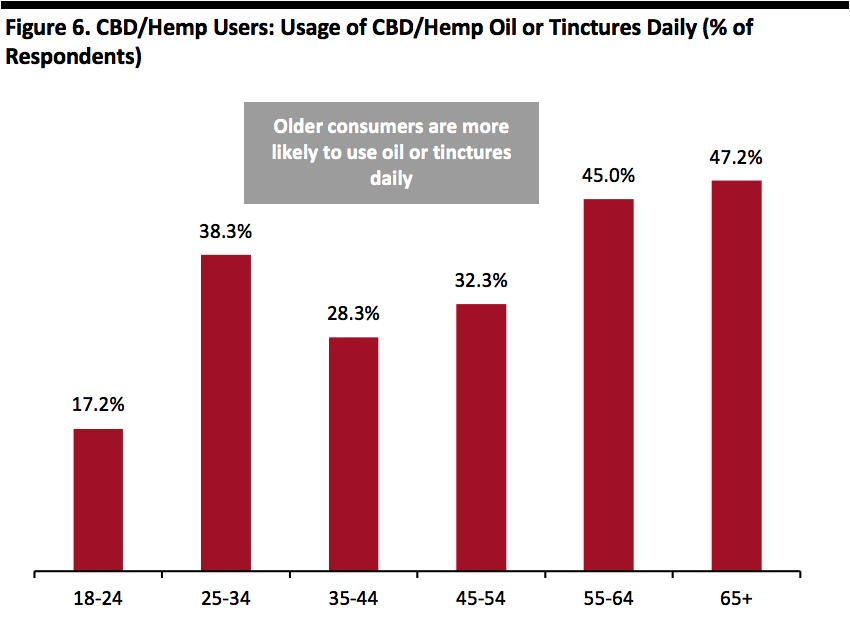 Base: US Internet users aged 18 and above who had used CBD/hemp oil/tinctures in the past 12 months
Source: Coresight Research[/caption] As we showed earlier, consumers use oil/tinctures relatively consistently across the age groups, but as shown in the chart above, older consumers are more likely to use them daily. This frequency of use dovetails with the thesis that older consumers use CBD/hemp for pain relief (needed daily) while younger consumers are more likely to use CBD/hemp products for other wellness benefits.
Where They Buy CBD/Hemp Products and How Much They Spend
[caption id="attachment_100020" align="aligncenter" width="700"]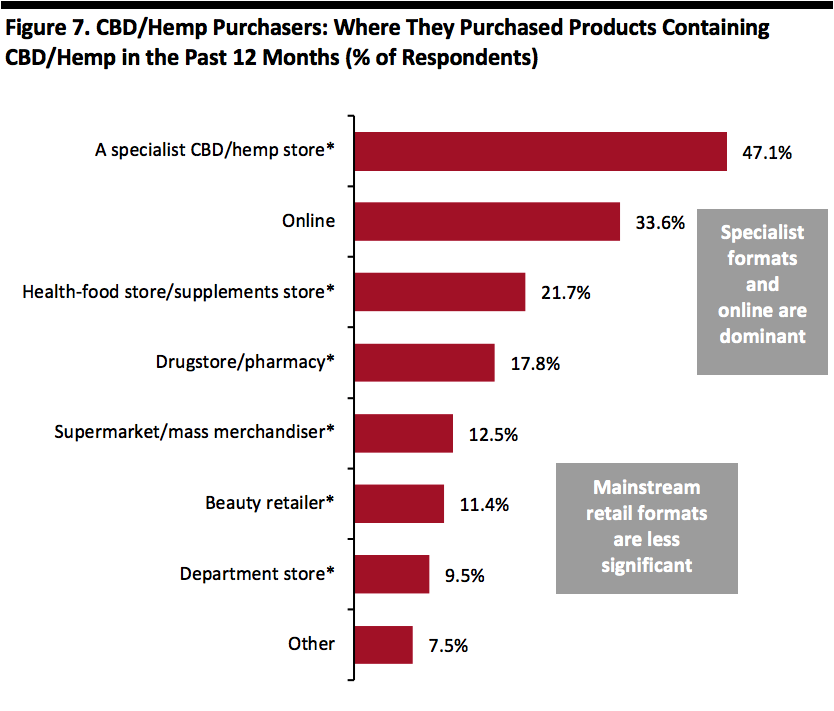 Respondents could select multiple options
Base: 872 US Internet users aged 18 and above who had personally purchased CBD/hemp products in the past 12 months
*”In store” was specified
Source: Coresight Research[/caption] While CBD is becoming more common on the shelves of mainstream retailers, formats such as drugstores, supermarkets, beauty retailers and department stores are not the most popular destination to purchase CBD or hemp products. Specialist stores, the online channel and health-food/supplement stores are more commonly used. The findings provide further evidence there is an opportunity for CBD to move into the mainstream, and for mass-market formats to capture a greater share of this fast-growing market. [caption id="attachment_100021" align="aligncenter" width="700"]
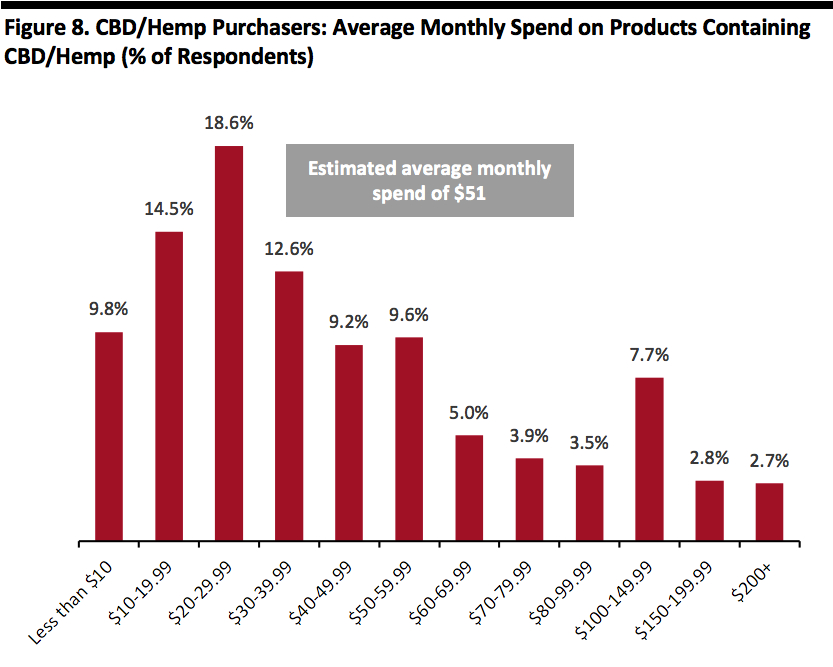 Base: 846 US Internet users aged 18 and above who currently personally purchase CBD/hemp products
Source: Coresight Research
[/caption] While $20-29.99 is the most common typically monthly spend on CBD/hemp products, we also see a jump in the proportion spending $100-149.99 per month. Based on the midpoints of the spending ranges in our survey, we estimate the average monthly spend of CBD/hemp purchasers is around $51. We estimate average monthly spend peaks at around $59 in the 35-44 age group and is lowest, at a little under $47, in the 18-24 and 65+ age groups.
Why They Use CBD/Hemp Products
[caption id="attachment_100022" align="aligncenter" width="700"]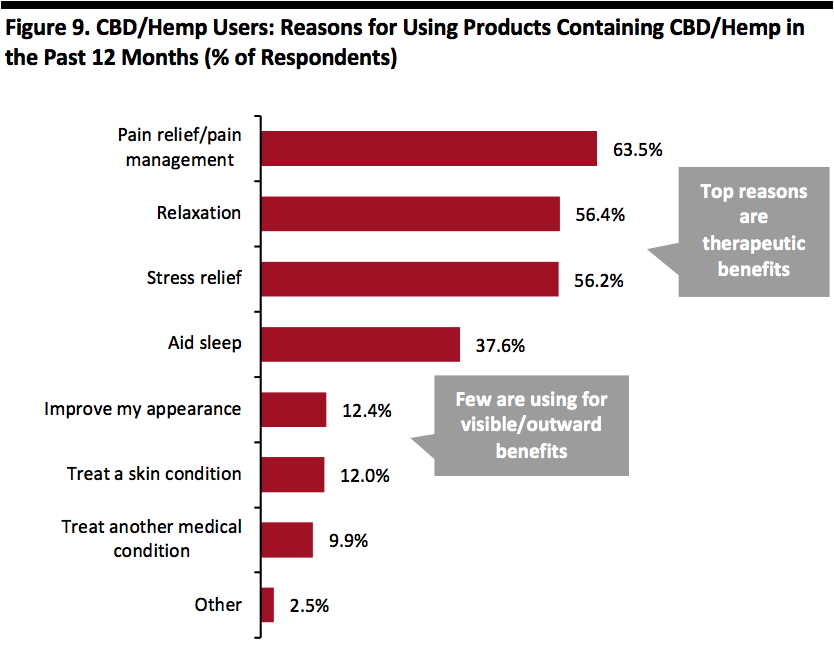 Respondents could select multiple options
Base: 920 US Internet users aged 18 and above who had used CBD/hemp products in the past 12 months
Source: Coresight Research[/caption] The most popular reasons for using CBD/hemp products are therapeutic benefits such as pain relief or stress relief. Outward or visible benefits such as treating skin conditions or improving appearance are much less important drivers. This aligns with our finding, shown earlier, that beauty and personal care products are a niche category within CBD/hemp. [caption id="attachment_100023" align="aligncenter" width="700"]
 Respondents could select multiple options
Base: 920 US Internet users aged 18 and above who had used CBD/hemp products in the past 12 months
Source: Coresight Research
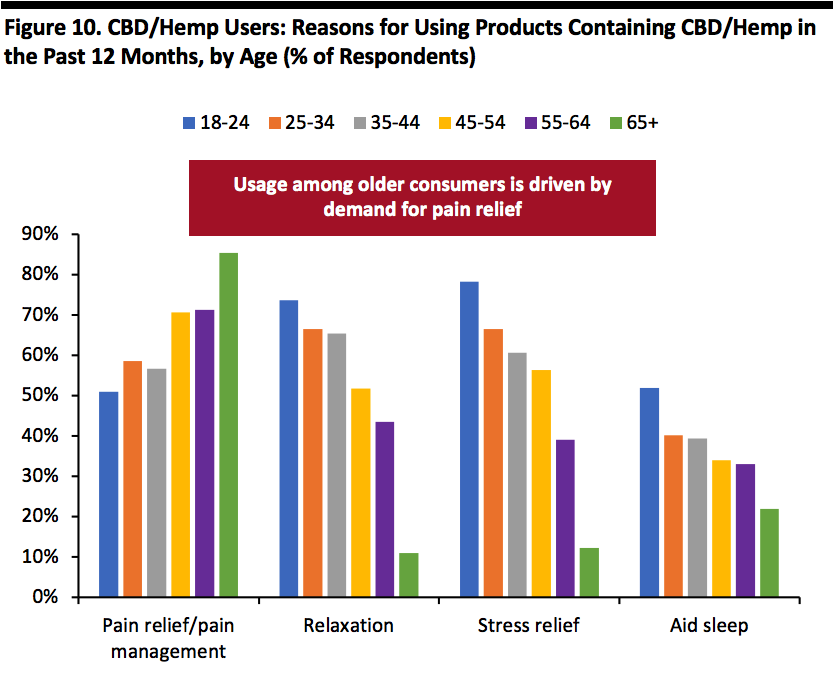
[/caption] We found big differences in why consumers use CBD among the different age groups:
- For older consumers, CBD/hemp is primarily a medical product: Some 85% of CBD users in the 65+ age group use it for pain relief – making this demographic the biggest users for pain relief.
- Older consumers are far less likely to use CBD for relaxation or stress relief, at just over 10% of this age group citing these reasons.
- Younger consumers are much more likely to use CBD/hemp for holistic or mental-wellbeing reasons such as relaxation (around 74% of users in this age group) or stress relief (at 78%).
Attitudes Toward CBD/Hemp Products
[caption id="attachment_100024" align="aligncenter" width="700"]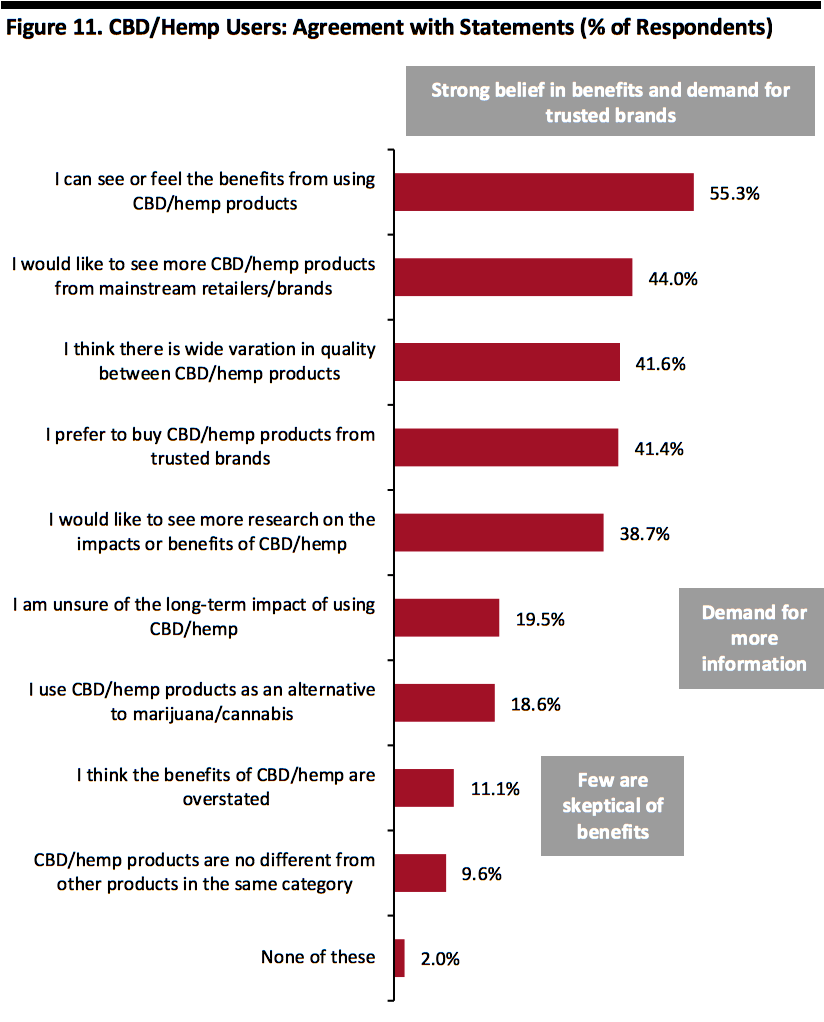 Respondents could select multiple options
Base: 920 US Internet users aged 18 and above who had used CBD/hemp products in the past 12 months
Source: Coresight Research[/caption] We asked CBD/hemp product users whether they agreed with the charted statements, and this is what we found: Consumers have a high degree of confidence in the category, although current users are self-selecting: They use CBD products, and so are likely to have cofidence in it, but skeptics are likely to be non-users or lapsed users.
- Some 55.3% of users say they can see or feel the benefits of CBD/hemp use, while only 11.1% think the benefits are overstated and 9.6% think CBD/hemp products are no different from regular products.
- Some 44.0% of users would like to see more products from mainstream retailers and brands, and 41.4% prefer to buy from trusted brands.
- 7% would like to see more research on the impact or benefits and 19.5% are unsure of the long-term impact of using CBD/hemp products.
CBD and Hemp versus Marijuana
[caption id="attachment_100025" align="aligncenter" width="700"]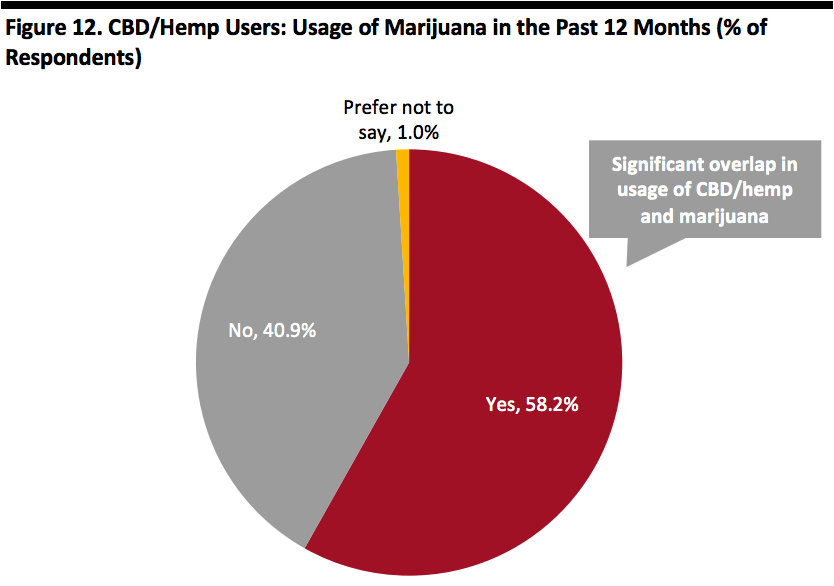 Base: 920 US Internet users aged 18 and above who had used CBD/hemp products in the past 12 months
Source: Coresight Research[/caption] Our data suggests a significant overlap in consumers who use CBD/hemp and those who use marijuana. Fully 58.2% of CBD/hemp users said they had used marijuana in the past 12 months. Watch for the results and analysis of our marijuana survey in an upcoming report, The Marijuana Consumer.