Source: Company reports/Coresight Research
4Q17 Results
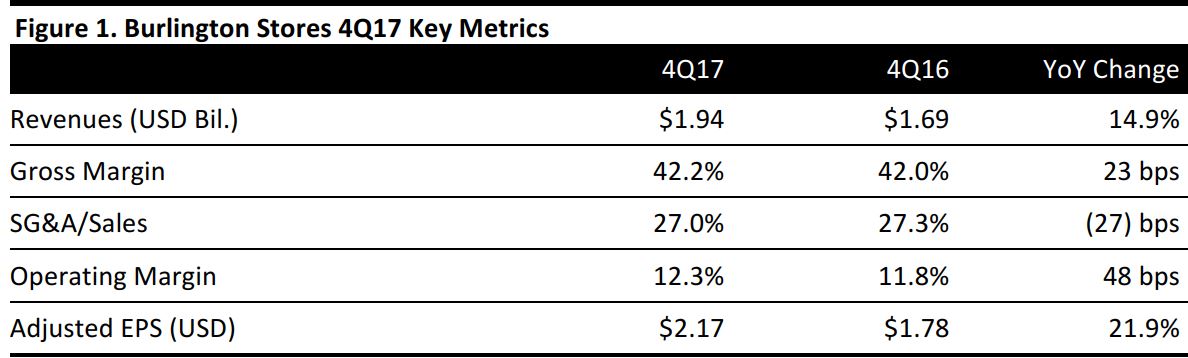
Burlington Stores reported 4Q17 revenues of $1.94 billion, up 14.9% year over year and above the $1.88 billion consensus estimate. Sales increased by 10.0% on a 13-week basis. Revenues from new and non-comparable stores were reduced by approximately $25 million in the quarter due to weather-related store closings.
Comparable sales were up 5.9%, beating the 3.1% consensus estimate and guidance of 2%–3%.
Adjusted EPS (which excludes the impact of the 2017 tax reform) was $2.17, up 21.9% year over year and beating the $2.10 consensus estimate. GAAP EPS was $3.47, compared with $1.77 in the year-ago quarter.
Inventories at year-end were $753 million versus $702 million at the end of 2016. The increase was primarily due to inventory related to the 37 net new stores opened during the year and an increase in pack-and-hold inventory, which accounted for 25% of total inventory at year-end, compared with 23% at the end of 2016.
Details from the Quarter and Year
Management lauded the milestones the company achieved during the year, including reaching $6 billion in sales; expanding adjusted operating margin by 90 basis points, to 8.6%; and achieving record-low aged inventory and record-high comparable inventory turnover levels.
- The top-performing businesses in the quarter were all areas of home; beauty; men’s sportswear; ladies’ better sportswear; and men’s, kids and athletic shoes.
- Burlington made significant progress in further de-weatherizing its business, and comps for non-cold-weather categories exceeded the chain average.
- Looking at geography, the Southeast and Southwest performed above average, and comps in the Midwest were characterized as solid despite being below average. Comps were positive in26 of 27 regions.
- Management was pleased with receipt flow and inventory and ended the quarter with comp store inventories down 7% on top of a 9% decline in the year-ago quarter. Comp store inventory turnover improved by 10% on top of 13% improvement in the year-ago quarter.
- The company’s long-term strategic priorities continue to be focusing on driving comps; expanding, modernizing and optimizing the store fleet; and increasing operating margins.
- To drive comp growth, the company aims to enhance its assortments while improving execution of its off-price model, with particular focus on under-penetrated businesses; build marketing initiatives to continue to engage both new and existing customers; and improve the store experience for customers.
- The company made substantial progress in home in FY17, increasing the category to 13.9% of sales versus 12.4% in FY16. Home still represents the largest category growth opportunity for Burlington; there is a substantial gap between the retailer’s home category sales and those of its peers, which see home sales account for more than 20% of total sales.
- Ladies apparel remains another significant opportunity, as penetration of 23.3% is still well below the peer group’s rate of approximately 30%. While penetration in overall ladies apparel dropped by 110 basis points in FY17, Burlington continues to see strong growth in missy sportswear, the largest component of ladies apparel.
FY17 Results
On a 53-week, GAAP basis, revenues increased by 9.3%, to $6,085 million, and EPS increased by 82%, to $5.48. The previous year had 52 weeks.
On a 52-week basis, total sales increased by 7.8%, to $6,003 million, driven by a 3.4% increase in comps. Weather-related store closings reduced sales from new and non-comparable stores by approximately $42 million.
Adjusted EPS (excluding the 2017 tax reform) was $4.37, versus $3.24 the prior year.
Outlook
For FY18, management expects:
- Sales growth of 9%–10%, excluding the 53rd week, to $6.66–$6.72 billion, versus the $6.41 billion consensus estimate.
- Comps of 2%–3% on top of FY17’s 3.4% increase.
- Adjusted EBIT margin expansion of 20–30 basis points.
- Adjusted EPS of $5.73–$5.83, versus the $5.32 consensus estimate.
For 1Q18, management expects:
- Sales growth of 9.5%–10.5%.
- Comps of 2%–3%.
- Adjusted EPS of $1.05–$1.09, compared with $0.79 in the year-ago quarter.