
Nitheesh NH
[caption id="attachment_79926" align="aligncenter" width="620"]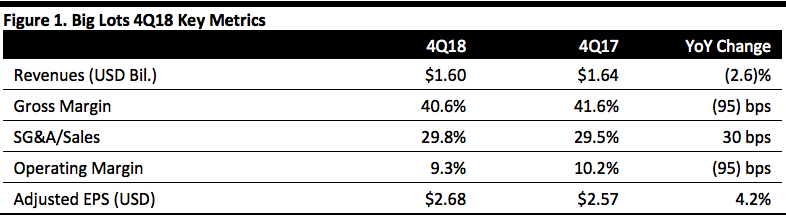 Source: Company reports/Coresight Research[/caption]
4Q18 Results
Big Lots reported 4Q18 revenues of $1.60 billion, down 2.6% year over year and in line with the consensus estimate. Revenue growth was hurt by a lower store count year over year and the extra week in the year-ago quarter.
Comps increased 3.1%, beating guidance of flat to up 2% and marking the second consecutive quarter with comps above 3%.
Adjusted EPS was $2.68, up 4.2% and handily beating the $2.30 consensus estimate. The year-ago EPS figure excludes a $0.11 per share charge for the write-down of deferred tax assets. GAAP EPS was $2.68, up 8.8%. The extra week in the year-ago quarter added $0.09 to EPS.
FY18 Results
FY18 revenues were $5.24 billion, down 0.5%.
Comps for the year increased 1.2%.
Adjusted EPS was $4.04, down 9.2%. The EPS figure excludes $0.15 per share for the impact of the CEO’s retirement and $0.06 per share for the settlement of shareholder litigation. GAAP EPS was $3.83, down 12.6%.
Details from the Quarter
Management commented that after a slow start to the quarter, the company experienced a meaningful sales acceleration in December and January, which drove sales and earnings above the high end of guidance.
Source: Company reports/Coresight Research[/caption]
4Q18 Results
Big Lots reported 4Q18 revenues of $1.60 billion, down 2.6% year over year and in line with the consensus estimate. Revenue growth was hurt by a lower store count year over year and the extra week in the year-ago quarter.
Comps increased 3.1%, beating guidance of flat to up 2% and marking the second consecutive quarter with comps above 3%.
Adjusted EPS was $2.68, up 4.2% and handily beating the $2.30 consensus estimate. The year-ago EPS figure excludes a $0.11 per share charge for the write-down of deferred tax assets. GAAP EPS was $2.68, up 8.8%. The extra week in the year-ago quarter added $0.09 to EPS.
FY18 Results
FY18 revenues were $5.24 billion, down 0.5%.
Comps for the year increased 1.2%.
Adjusted EPS was $4.04, down 9.2%. The EPS figure excludes $0.15 per share for the impact of the CEO’s retirement and $0.06 per share for the settlement of shareholder litigation. GAAP EPS was $3.83, down 12.6%.
Details from the Quarter
Management commented that after a slow start to the quarter, the company experienced a meaningful sales acceleration in December and January, which drove sales and earnings above the high end of guidance.
- Big Lots continued to expand its loyalty program, ending the quarter with 17.2 million active members.
- Active membership increased 15%, up 2.3 million members, during the year, with half of the increase from stores and half from online sign-ups.
- During the year, Big Lots remodeled 115 stores under its Store of the Future program, in addition to opening 32 new or remodeled stores. About 200 stores were converted to the new format at the end of the year.
- Store remodels generated incremental sales increases, primarily from the furniture, seasonal and soft home categories, which carry above-average margins. Sales growth is driven by both a larger basket and a higher number of transactions. Sales increases after a remodel are in the high single to low double digits in most markets.
- Opportunities include competitors’ store closings.
- Six of seven merchandise divisions posted positive comps in the quarter. Soft home was the best performing category, with comps in the high single digits. The company added space and improved its assortments through quality, brand, fashion and value (QBFV), and nearly all departments within soft home had positive comps, led by home decor, decorative textile, home organization and bath.
- Furniture comps were also up by high single digits in the quarter, with positive comps in four departments: upholstery, mattresses, case goods and ready-to-assemble. The newness of products plus the company’s lease-to-purchase program helped drive positive comps.
- Consumables posted comps in the low single digits, the best quarterly comp in four years, driven by health and beauty, holiday events and gifting sales, in addition to good momentum in the housekeeping category.
- Hard home comps were up by low single digits, the best quarter in the last five years.
- Food posted positive comps, the first positive comp in three years. Holiday gift sets resonated very well with customers.
- Seasonal posted slightly positive comps, with Christmas trim up by low single digits. Trim comps were partially offset by a slower start to lawn and garden and summer, particularly in California, which was adversely impacted by weather.
- Electronics, toys and accessories comps were down year over year, due to the category’s space being reduced or transferred to other categories.
- E-commerce posted strong sales with a lower operating loss year-over-year. After a slow start to the year and with multiple challenges, management was pleased with the comps in Q2, Q3 and Q4.
- A low single-digit increase in comps.
- Cash flow from operations less capex of $95-105 million.
- Adjusted EPS of $3.55-3.75 (down 7-12%), in line with the $3.64 consensus estimate.
- A low single-digit increase in comps.
- Adjusted EPS of $0.65-0.75 (down 21-32%), below the $0.92 consensus estimate.