Nitheesh NH
Introduction: Inditex and H&M, Head to Head
Zara and H&M are often spoken of in the same breath, as the fast-fashion invaders that are stealing market share away from mass-market rivals in a number of regions. Yet, we think there are some key distinctions between H&M and Zara’s parent company Inditex, and in this report, we bring together some key metrics to put these two firms head to head. We focus on three themes in this report:- H&M is not a majority fast-fashion retailer as is widely believed: only a minority of H&M fashion ranges are designed in response to in-season trends.
- Inditex has been growing much more strongly than H&M, and we believe this is due to Inditex’s more comprehensive fast-fashion offering.
- Revenues by segment: we look at where these companies generate their revenues.
- Readers may also be interested in our May 2017 report Fast Fashion Speeding Toward Ultrafast Fashion.
Fast Facts
We begin with a comparison of some top-line figures. By revenues, Inditex is 14% larger than H&M. For the current fiscal year, analyst consensus is for euro-denominated revenue growth of 10.4% at Inditex and 4.5% at H&M. [caption id="attachment_82376" align="aligncenter" width="580"]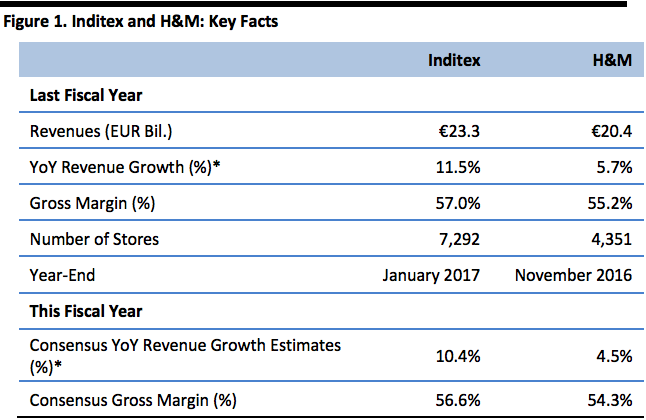 * Euro-denominated. YoY = year over year.
Source: S&P Capital IQ/FGRT[/caption]
1. H&M Is Not a Majority Fast-Fashion Retailer
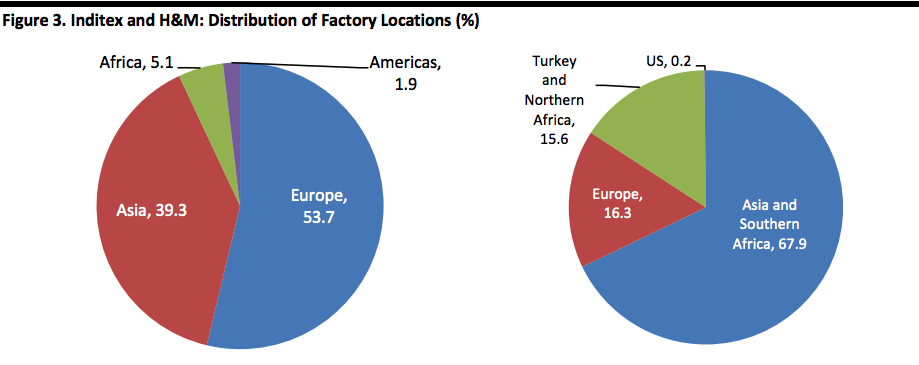
One of the most meaningful differences between Inditex and H&M—and it is one that may come as a surprise to some readers—is that H&M is not predominantly a fast-fashion retailer. According to a number of news websites, including WSJ.com, just 20% of H&M’s product offering is fast fashion—in other words, only 20% of its clothes are designed in-season in response to current trends. The remaining 80% of products are ordered months in advance. When we tried to verify this with the company, H&M neither confirmed nor denied this widely reported 20%/80% split. Inditex, in contrast, designs around 60% of its products in-season, according to research by Fung Business Intelligence. Indeed, a visit to any H&M store will dispel the notion that it is mainly a fast-fashion retailer: its shops are filled with rack upon rack of basics and staples, from plain shirts and t-shirts to chinos and hooded tops. A split of the factory locations used by the two firms gives a strong indication of how much is manufactured in-season and how much in advance: fast fashion must be produced in or close to the market in which it is sold (predominantly, Europe for Inditex and H&M), due to the long shipping times for orders from the more traditional Asian sourcing markets. While a majority of factories used by Inditex are located in or close to Europe, just under one-third of those used by H&M are in such “proximity” locations. [caption id="attachment_82377" align="aligncenter" width="580"]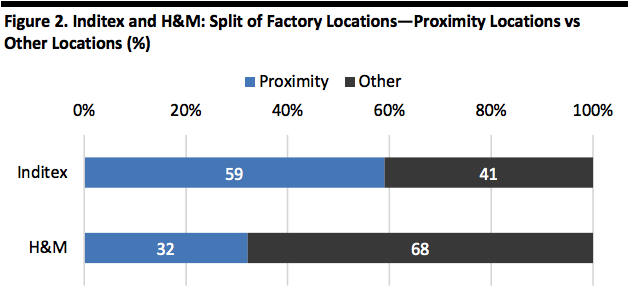 H&M data are for manufacturing factories only, excluding processing factories and fabric/yarn factories.
Source: Company reports/FGRT[/caption] Further distinctions include the following:
- Factories: H&M does not own factories, while Inditex is vertically integrated to a certain degree. In Arteixo, Galicia, where its head office is located, Inditex owns 11 factories focused on skilled work such as cutting out garment pieces, according to a 2013 Guardian Third-party factories then stitch such pieces into finalized garments. Inditex’s own factories account for just 2%–3% of the company’s manufacturing capacity, per the Guardian, while the Telegraph in 2014 stated that Inditex’s own factories accounted for 5% of Zara products.
- In-house design teams: Zara alone employs around 350 in-house designers, according to sources such as Bloomberg and the Financial Times. Inditex’s corporate website states that the group has design teams of “over 700 individuals.” H&M, on the other hand, has a much smaller design team, employing 160 designers, according to Fung Business Intelligence.
 H&M data are for manufacturing factories only, excluding processing factories and fabric/yarn factories.
Source: Company reports/FGRT[/caption]
1. Varying Performance
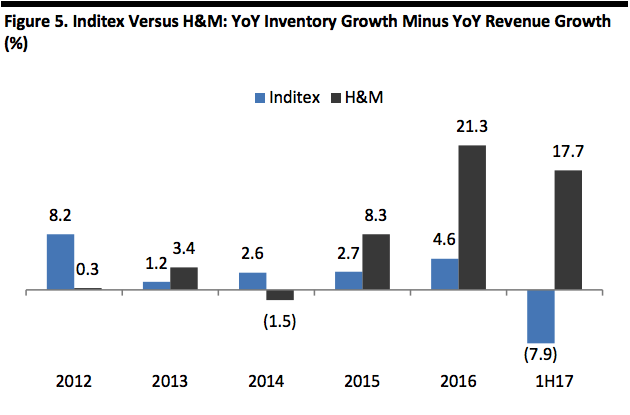
Inditex is growing much faster than H&M. In the companies’ most recent respective fiscal years, Inditex grew euro-denominated sales at almost double the pace that H&M did. And the growth gap has widened in the first half of the current fiscal year:- Inditex: In 1H17, Inditex grew total revenues by 11.5% year over year and comparable sales grew by 6%.
- H&M: In 1H17, H&M grew total revenues by 5.2% in euros, or by 8.6% in Swedish krona. H&M does not report comparable-sales growth.
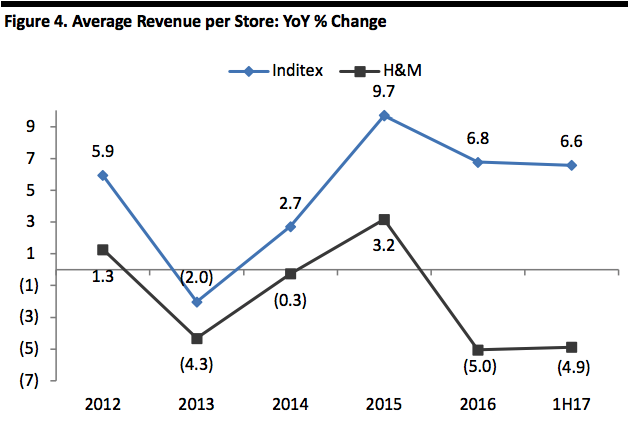 Based on euro-denominated revenue per store. For H&M, this was converted from SEK at average annual exchange rates; Inditex reports in euros.
Years reflect closest calendar years, so 2016 is the year ended November 2016 for H&M and the year ended January 2017 for Inditex.
Source: Company reports/FGRT[/caption] [caption id="attachment_82380" align="aligncenter" width="580"]
 Source: S&P Capital IQ/FGRT[/caption]
[caption id="attachment_82381" align="aligncenter" width="800"]
Source: S&P Capital IQ/FGRT[/caption]
[caption id="attachment_82381" align="aligncenter" width="800"]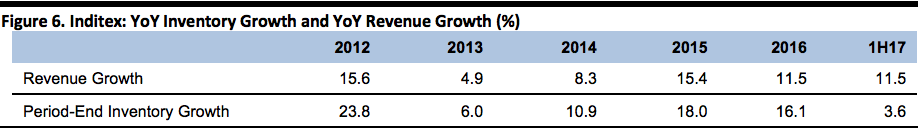 Source: S&P Capital IQ/FGRT[/caption]
[caption id="attachment_82382" align="aligncenter" width="800"]
Source: S&P Capital IQ/FGRT[/caption]
[caption id="attachment_82382" align="aligncenter" width="800"]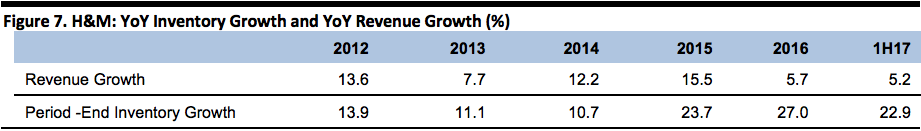 Source: S&P Capital IQ/FGRT[/caption]
1. Revenues by Segment
Both Inditex and H&M are multi-banner groups, although H&M was traditionally a mono-brand retailer and launched its additional banners only in the 2000s. H&M launched Weekday in 2002, Cheap Monday in 2004, Monki in 2006, Cos in 2007, & Other Stories in 2013 and Arket in 2017. H&M does not split out revenues by banner. Zara continues to be the dominant banner at Inditex: it accounted for two-thirds of Inditex’s revenues in the year ended January 2017. Apart from Zara, the company splits out figures for Bershka only, as we chart below. Inditex’s other banners are Massimo Dutti, Oysho, Pull&Bear, Stradivarius, Uterque and Zara Home. [caption id="attachment_82383" align="aligncenter" width="580"]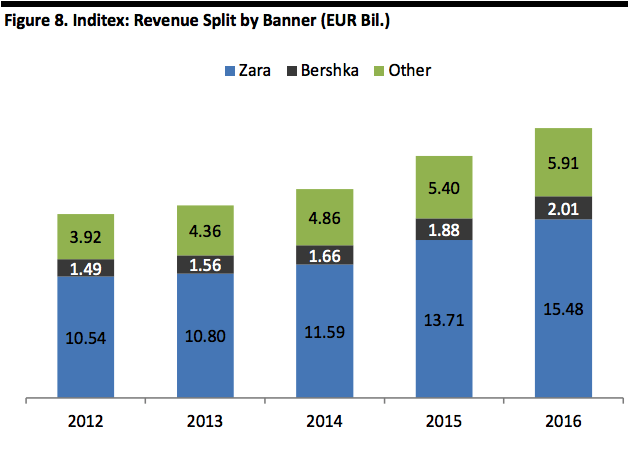 Source: Company reports/FGRT[/caption]
The regional sales split is one area of relative commonality between the two companies. In total, Europe accounted for 64% of Inditex’s revenues and 65% of H&M’s revenues in the latest fiscal year.
[caption id="attachment_82386" align="aligncenter" width="580"]
Source: Company reports/FGRT[/caption]
The regional sales split is one area of relative commonality between the two companies. In total, Europe accounted for 64% of Inditex’s revenues and 65% of H&M’s revenues in the latest fiscal year.
[caption id="attachment_82386" align="aligncenter" width="580"]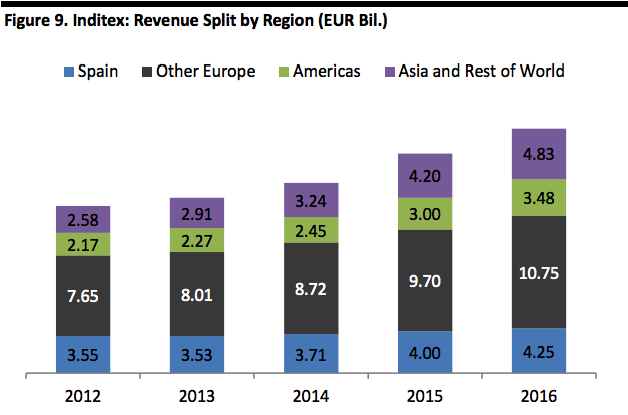 Source: Company reports[/caption]
[caption id="attachment_82388" align="aligncenter" width="580"]
Source: Company reports[/caption]
[caption id="attachment_82388" align="aligncenter" width="580"]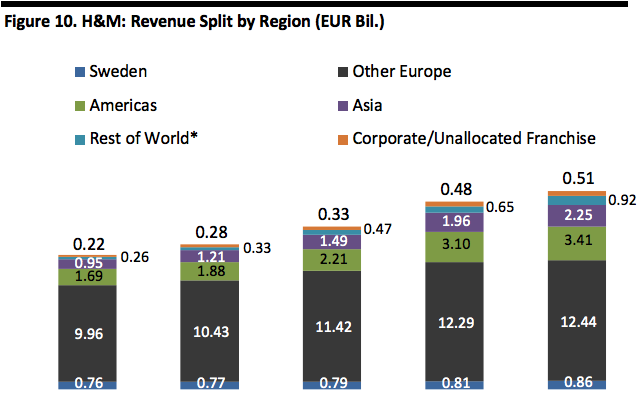 * Including Russia and Turkey.
Source: Company reports/FGRT[/caption]
Key Takeaways
- H&M is largely not a fast-fashion retailer: a number of reports state that the company produces just 20% of its clothing ranges in-season, in contrast to 60% at Inditex. Similarly, only 32% of factories used by H&M are located in or close to Europe. At Inditex, this figure is 59%.
- These two retailers have been diverging in terms of growth. H&M’s revenue growth is being supported entirely by new store openings, and its sales-per-store growth is negative. Inditex continues to report positive comparable-sales growth and sales-per-store growth.
- We see these distinctions as related and that a strong fast-fashion positioning is supporting growth at Inditex. H&M’s product offering is focused much more strongly on basic apparel items, which provides it with less differentiation in the market.
- We think H&M will continue to find it tough to maintain underlying sales growth, in the context of heightened fast-fashion competition, including from ultrafast-fashion players such as Boohoo.com and Missguided. We see Inditex as better placed to compete with such upstart rivals.