 Source: Company reports/Coresight Research
1Q18 Results
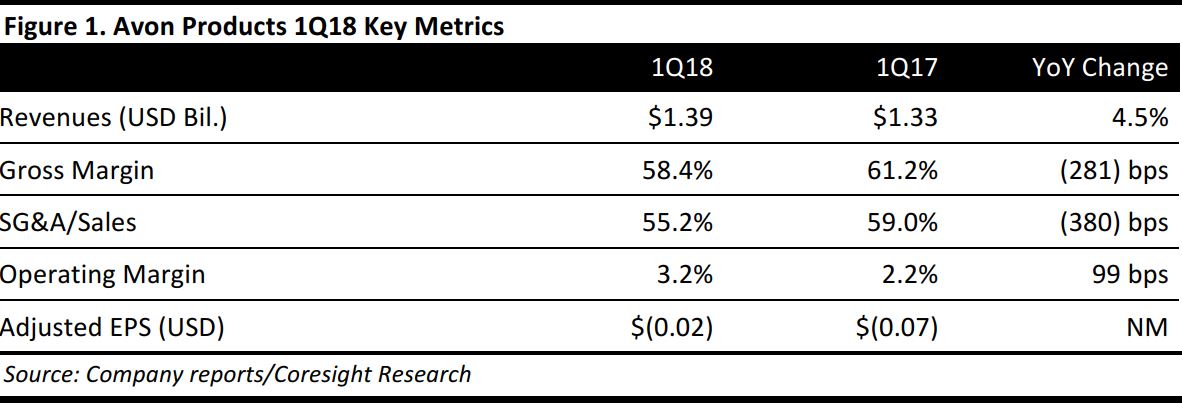
Avon Products reported 1Q18 revenues of $1.39 billion, up 4.5% year over year and beating the consensus estimate of $1.36 billion. A new revenue recognition standard added six percentage points to revenues.
The company’s gross margin declined by 281 basis points due to a 310-basis-point impact from the adoption of the new revenue recognition standard.
The company’s operating margin increased by 99 basis points, including a 120-point benefit from the new revenue recognition standard.
Adjusted EPS was $(0.02), in line with the consensus estimate. GAAP EPS was $(0.06), compared with $(0.10) in the year-ago quarter.
Details from the Quarter
- The number of active representatives declined by 4%, primarily due to decreases in the South Latin America region.
- The average order size increased by 6%, including a benefit of six percentage points from the new revenue recognition standard.
- The number of representatives at the end of the period declined by 1% due to declines in Latin America that were partially offset by growth in the Europe, Middle East and Africa region.
Results by Geography
Europe, Middle East and Africa
- Revenues were $568 million, up 12% as reported and up 2% in constant currency year over year.
- The number of active representatives decreased by 1% and ending representatives increased by 3%.
- The average order size increased by 3%, comprising a 1% increase in units and a price/mix increase of 1%.
South Latin America
- Revenues were $497 million, flat as reported and up 4% in constant currency.
- The number of active representatives decreased by 6% and ending representatives decreased by 3%.
- The average order size increased by 10%, comprising a 5% decrease in units and a price/mix increase of 9%.
North Latin America
- Revenues were $196 million, up 1% as reported and down 3% in constant currency.
- The number of active representatives decreased by 6% and ending representatives decreased by 5%.
- The average order size increased by 3%, comprising a 10% decrease in units and a price/mix increase of 7%.
Asia-Pacific
- Revenues were $111 million, down 2% as reported and down 3% in constant currency.
- The number of active representatives decreased by 5% and ending representatives decreased by 2%.
- The average order size increased by 6%, comprising a 3% decrease in units and a price/mix increase of 5%.
Outlook
Management did not offer guidance. It commented that the quarterly results were unsatisfactory and that it had initiated a comprehensive review of the company’s operations. Management is also formulating long-term plans to return the company to a competitive market position.
The consensus estimate calls for FY18 revenues of $5.79 billion, compared with revenues of $5.72 billion in the prior year, an increase of 1%. The consensus EPS estimate is $0.17, compared with$0.06 for the prior year.