albert Chan
US Retail Traffic and In-Store Metrics: August 2021
The Coresight Research US Retail Traffic and In-Store Metrics series reviews changes in selected store-based metrics, as reported by RetailNext. In this month’s report, we review store traffic changes through August 2021—which saw rising Covid-19 cases and trends impacted by a shift in the Labor Day weekend. This series usually reviews year-over-year changes in store-based metrics; however, all March, April, May, June, July and August 2021 data in this report are compared to 2019, as stores began closing in March 2020 due to Covid-19 and most stores were closed in April, May, June, July and August 2020.
RetailNext’s coverage does not include food retailers but does include some other retail sectors deemed essential; the exclusion of food retail means that the figures cited below almost certainly overstate recent declines in total retail traffic.
- August saw a slight deterioration in traffic trends: Traffic declined by 23.9% on a two-year basis in August, weaker than July’s 23.5% decline versus 2019.
- The conversion rate (sales transactions as a percentage of traffic) grew 2.2 percentage points in August, the same as July.
- In August, ATV (average transaction value, or sales divided by transactions) rose by 15.7%, increasing by 2.2 percentage points from July. This fueled the slight improvement in store-based sales to 0.6%, from a flat figure of 0.0% in July.
- Shopper yield (sales divided by traffic) increased by 25.6% in August, slightly lower than July’s 27.5% growth.
Figure 1. US Store-Based Nonfood Retail Metrics: YoY % Change
[caption id="attachment_132605" align="aligncenter" width="700"]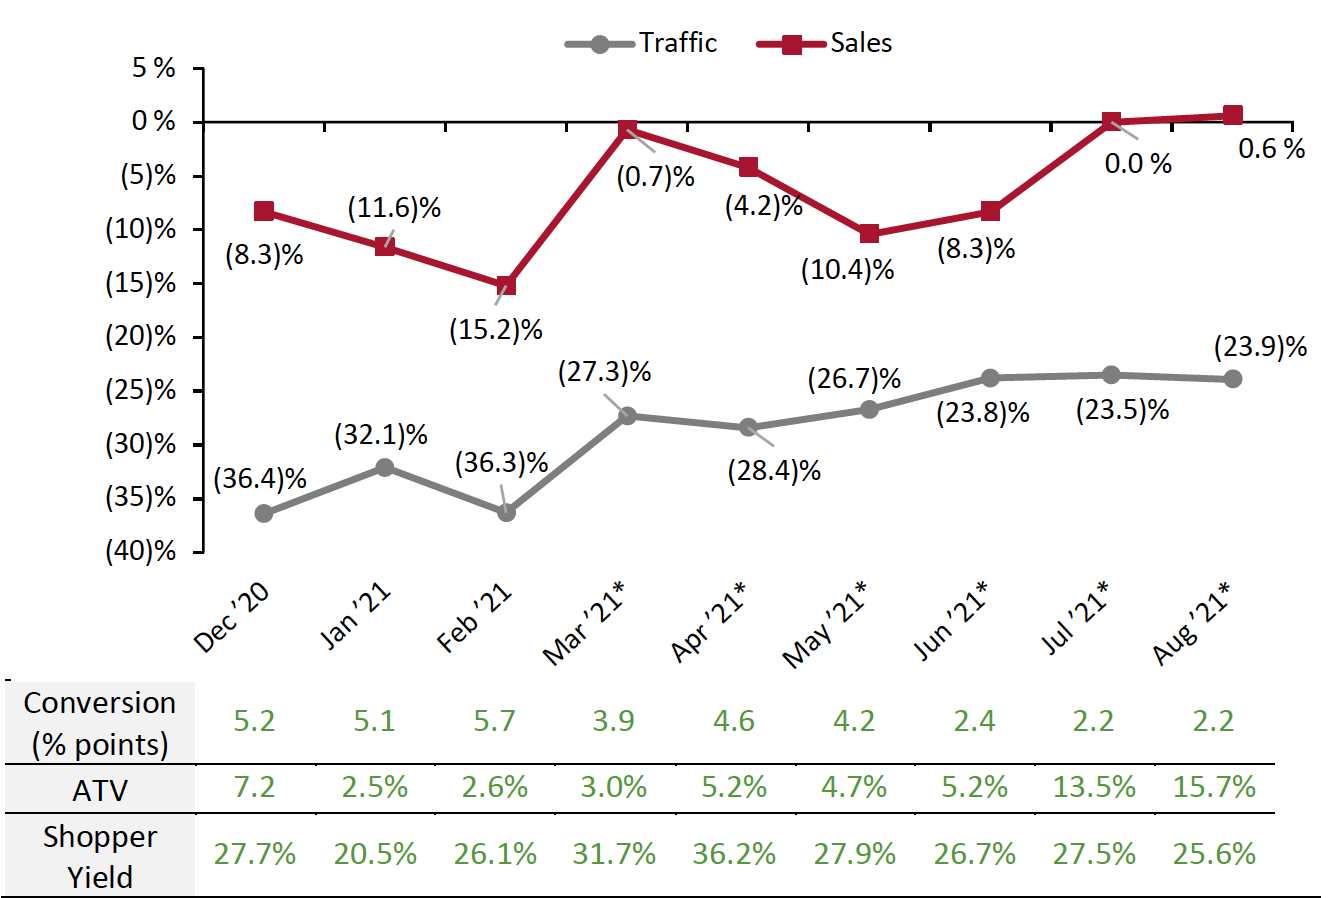 ATV=Average transaction value; Shopper yield=Sales divided by traffic
*March, April, May, June, July and August 2021 numbers are compared to 2019 as stores began closing in March 2020 due to Covid-19 and most stores were closed in April, May, June, July and August 2020.
Source: RetailNext[/caption]
Weekly Shopper Traffic Trends
Weekly data for August tracks the progress of store traffic over four weeks (August 1–August 28, 2021):
- Traffic performance improved for the first three weeks of August on a two-year basis. In the first week, traffic declined by 23.1%, a solid improvement from the final week of July, which saw a traffic decline of 25.3%.
- Traffic declines improved slightly in the second and third weeks of August to 22.7% and 21.5%, respectively.
- Traffic declines accelerated to 26.4% in the fourth week, due to the shift of the Labor Day weekend from the fourth week of August in 2019 to the first week of September in 2021.
Traffic by Retailer Vertical
RetailNext publishes traffic trends for five sectors, which make up a majority of the data set: apparel, footwear, health and beauty, home and jewelry. Other sectors, including accessories, department stores, electronics, optical goods and sporting goods, are not broken out but impact the overall (average) traffic number. In August, the traffic performance of the five sectors that are broken out outperformed the overall traffic average (see Figure 2), due to deeper declines elsewhere.
Nonessential retailers saw a year-over-year improvement in traffic between May and September 2020, following the easing of lockdown restrictions imposed during March and April. However, this momentum disappeared in October and November. Although December 2020 and January 2021 saw traffic trends slightly improve, February was a weaker month. While March 2021 saw traffic trends substantially improve even on a two-year basis (versus March 2019), April witnessed a slight deceleration in traffic trends on a two-year basis. May, June and July saw improvements in traffic trends on a two-year basis.
In August 2021, we saw a slight deterioration in traffic trends on a two-year basis: Nonessential retailers experienced an aggregate 23.9% decline in shopper traffic in August, versus July’s 23.5% decline.
Performances varied across industry verticals in August 2021 on a two-year basis:
- The home sector reported the highest traffic decline of 22.3%, an improvement of 440 basis points compared to July.
- The footwear sector posted the second-highest traffic decrease of 20.9%, deepening by 150 basis points compared to July.
- The apparel sector posted a traffic decline at 20.3%, deepening by 390 basis points compared to July.
- The health and beauty sector saw a traffic decrease of 18.7%, deepening by 60 basis points from July.
- The jewelry sector saw a traffic decline of 17.7%, deepening by 70 basis points compared to July.
Figure 2. US Retail Traffic by Industry Vertical: YoY % Change [caption id="attachment_132606" align="aligncenter" width="700"]
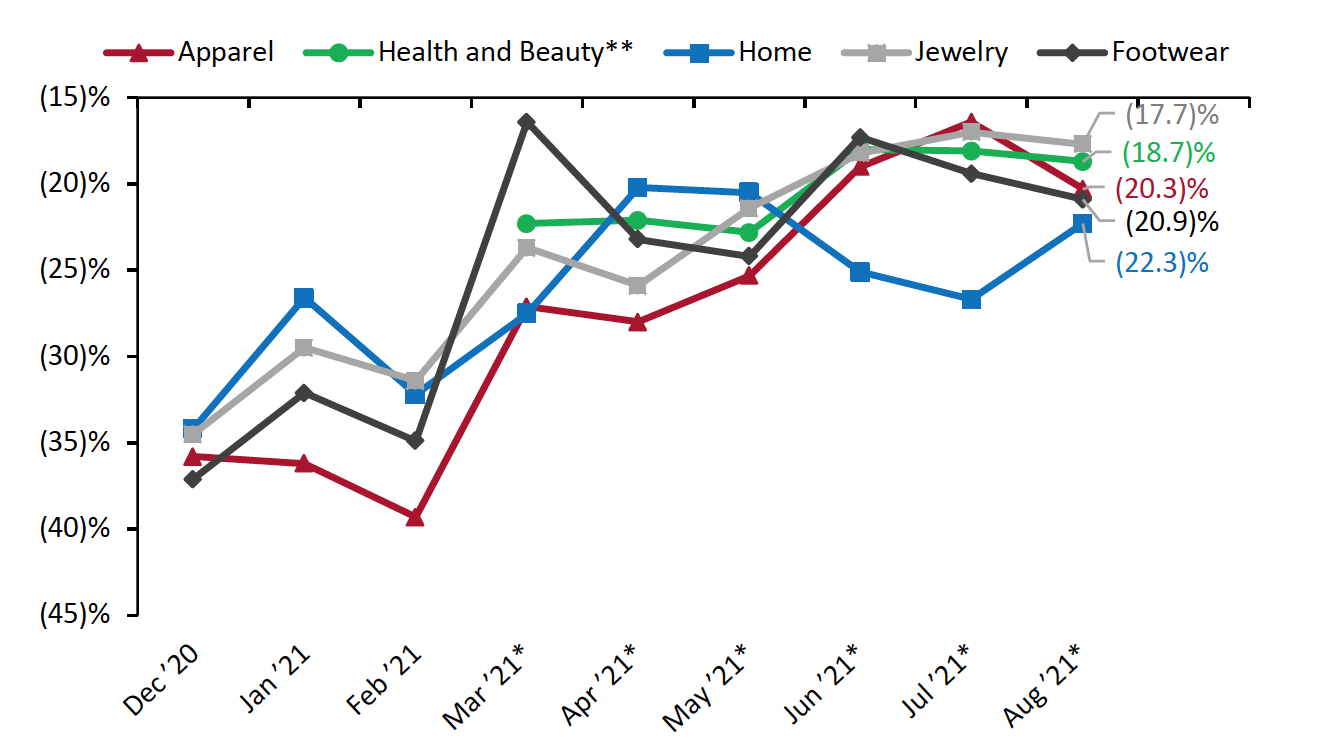 *March, April, May, June, July and August 2021 numbers are compared to 2019, as stores began closing in March 2020 due to Covid-19 and most stores were closed in April, May, June, July and August 2020.
**RetailNext started providing traffic trends for the health and beauty sector from March 2021.
Source: RetailNext[/caption]
Regional Traffic Trends
In August, new Covid-19 cases and hospitalization rates continued to surge. In the fourth week of the month, the Food and Drug Administration (FDA) approved the Pfizer/BioNTech vaccine for people aged 16 and above. Following the approval, 100 colleges introduced stipulations requiring students to be vaccinated to enter campuses. We expect this to have a positive impact on September’s traffic trends.
Furthermore, August was impacted by natural disasters. In the fourth week of the month, tropical storm Henri (which has now been downgraded to a tropical depression) brought heavy rains and strong winds to the Northeast region, which led to power outages and flooding in many states.
Retail traffic in August varied across regions:
- The South posted the strongest traffic performance this month, with a decline of 18.8% when compared to 2019. The first three weeks saw declines of around 17%, while the fourth posted a decline of 23.8%.
- The Midwest was the second-highest performing region in August, witnessing a traffic decline of 20.8%. The region outperformed all others in the third week, but the fourth week saw large declines due to the shift in Labor Day weekend.
- The West outperformed the national average, seeing a decline of 21.6%. The region’s traffic trend improved for the first three weeks and decreased in the last.
- The Northeast region saw the worst performance this month, witnessing a decline of 26.1%. Tropical storm Henri brought heavy rains and strong winds, causing power shortages from New Jersey to Maine and roadway flooding in New Jersey and New York—resulting in traffic trend declines in the last week of August.
Traffic by Retailer Location Type
In August, mall traffic continued to outperform non-mall traffic: it declined by 21% on a two-year basis, compared to non-mall traffic’s decline of 24%. Non-enclosed storefront locations continued to perform better than traditional enclosed shopping centers, declining by 21% versus the latter’s 22% decline in traffic.
- Traffic by mall location type declined between 12.8% and 31.0%. Strip malls outperformed all other location types, with a decline of only 12.8%—while outlet locations performed the weakest this month, recording a 31.0% traffic decline.
- Traditional malls were the second-highest performing location type, reporting a traffic decline of 16.3%—an improvement from July’s 18.0% decline.
- Other retail locations, including airports, casinos and hotels, reported a traffic decline of 17.0%—deepening from July’s 13.3% decline.
- Lifestyle centers outperformed the national average, declining by 21.8%.
- Street-front/freestanding locations slightly underperformed the national average at a decline of 24.3%, while luxury locations reported the second-largest traffic decline of 27.9%.